Internal rate of return calculator real estate: IRR guide
Learn how the internal rate of return calculator real estate helps you evaluate deals, maximize profits, and compare options quickly.
The internal rate of return, or IRR, is one of the most powerful tools in a real estate investor's arsenal. At its core, an IRR calculator for real estate is a financial model that tells you the true annualized rate of return on a property. It goes beyond simple metrics by factoring in all your cash flows—from the initial down payment to the monthly rental income and the final payout when you sell—while also accounting for the time value of money.
This process boils down a complex, multi-year investment into a single, compelling percentage that you can actually use.
Why IRR Is Your Most Important Real Estate Metric

Before we get into the "how," it's vital to grasp why this metric matters so much. While things like cash-on-cash return are great for a snapshot of your annual performance, they don't tell the whole story. IRR, on the other hand, gives you a panoramic view of an investment's entire lifecycle.
Think of it as the ultimate equalizer. It lets you compare wildly different deals on a level playing field. How does a short-term, high-return flip stack up against a steady, 10-year buy-and-hold rental? IRR gives you the answer.
The real genius of the IRR calculation is how it handles time. It operates on the fundamental principle that a dollar in your pocket today is worth more than a dollar you'll receive five years from now. By finding the specific discount rate that brings the net present value (NPV) of all future cash flows to zero, IRR reveals the true, time-adjusted return on every single dollar you put into the deal.
The Power of a Single Percentage
A good internal rate of return calculator for real estate takes all your financial assumptions and crunches them into one easy-to-understand number. That single percentage answers the big question every investor has: "What is my projected annual rate of growth on this investment?"
Seasoned investors lean on this metric because it forces you to think through every financial detail of the deal, leaving no stone unturned. You have to account for:
- Initial Investment: The total cash you need to close the deal, including down payment and closing costs.
- Ongoing Cash Flows: Your net operating income (or loss) each year after all expenses are paid.
- Final Sale Proceeds: The net cash you walk away with after selling the property and settling any remaining mortgage balance.
By looking at the entire investment journey—from the day you write the first check to the day you cash the last one—IRR delivers a far more complete picture of performance than any other metric. It’s not just about what you make each year; it’s about your total wealth creation over time.
For example, a fascinating historical analysis of leveraged rental properties in markets like Phoenix showed a real IRR of around 5.0% per year above inflation over a 25-year period. This kind of long-term data shows just how powerful IRR is for measuring performance across market cycles, giving you a solid benchmark for your own deals.
Gathering Your Data for an Accurate IRR Calculation
Any internal rate of return calculator for real estate is a classic "garbage in, garbage out" tool. The number it spits out is only as reliable as the numbers you put in. To get a truly accurate IRR, you have to get your hands dirty and gather some solid data across the five key areas of the deal.
Think of this not as a tedious task, but as the core of your due diligence. It's where you build the foundation for a smart investment decision.
Pinpointing Your Initial Investment
First things first, you need to know your total "all-in" cost. This isn't just the sticker price of the property; it's every single dollar that has to come out of your pocket to get the deal done and the property ready for a tenant.
This initial investment is your "Year 0" cash flow, and it’s always a negative number. It's the cash you're putting into the deal.
- Purchase Price: This one's easy—it's the price you and the seller agree on.
- Closing Costs: These often surprise new investors. Expect to pay anywhere from 2% to 5% of the purchase price for things like appraisal fees, title insurance, and lawyer fees.
- Immediate Repairs: This is your rehab budget. What will it cost to get the property in rent-ready condition? New paint? New carpet? Fix a leaky faucet? It all adds up.
It's so easy to forget closing costs or lowball the repair budget. These are common mistakes that will make your projected IRR look artificially high right from the start.
Projecting Income and Expenses
Once you have your initial cost nailed down, it's time to forecast how the property will actually perform month after month, year after year. This means getting real about both the money coming in (rent) and the money going out (expenses).
Start with the gross potential rent, but don't stop there. You have to account for the reality of vacancies. No property stays occupied 100% of the time. I usually pencil in a vacancy rate of 5-10% of the gross rent, depending on the strength of the local market.
Next, build a detailed list of all your operating expenses. These are the recurring costs of keeping the lights on. Be conservative here.
- Property Taxes
- Homeowners Insurance
- Maintenance and Repairs (A good rule of thumb is to budget 1% of the property's value each year for this.)
- Property Management Fees (If you're not self-managing, this is typically 8-12% of the rent collected.)
- Utilities (if they aren't the tenant's responsibility)
- Capital Expenditures (CapEx) – This is the big one people forget. You have to save for major replacements like a new roof or an HVAC system down the line.
When you subtract all these operating expenses from your real-world rental income (after vacancy), you get your Net Operating Income (NOI). The NOI is the lifeblood of your investment analysis. For a more detailed breakdown, check out our guide on how to calculate cash flow on a rental property.
Financing and Exit Assumptions
Finally, you have to model your loan and your plan for selling the property. The details of your mortgage—the loan amount, interest rate, and term—determine your debt service. This is the payment you'll make every year, and you'll subtract it from your NOI to find your true pre-tax cash flow.
The last piece of the puzzle is your exit strategy, which boils down to two big assumptions:
- Holding Period: How long do you plan on keeping this property? Most investors model this out for 5, 7, or 10 years.
- Future Sale Price: This is the crystal ball part. You have to project what you think you can sell it for at the end of your holding period. A common way to do this is by applying an "exit cap rate" based on market trends to your final year's projected NOI.
These assumptions are absolutely critical. A slightly longer hold period or a more optimistic sale price can completely change the IRR. To keep your projections grounded, it helps to look at historical data. For example, over the last 20 years, leveraged single-family rentals in the U.S. have historically produced an IRR of around 11.7%, which includes both rent and appreciation. You can discover more insights about historical rental returns on Arrived.com.
Let's Run the Numbers: A Real-World IRR Calculation Example
Alright, you've done the hard work of gathering all your data. Now it's time for the fun part—plugging those numbers into an internal rate of return calculator for real estate to see what kind of deal you're really looking at. This is where your assumptions meet reality.
Let's walk through a common scenario: analyzing a single-family rental. I find that breaking down the cash flows year-by-year is the best way to understand what the calculator is actually doing. It removes the mystery and gives you the confidence to run these numbers on any property that crosses your desk.
Mapping Out the Cash Flow Timeline
At its core, every IRR analysis is just a story told in numbers over time. It starts with the money you put in (a negative number), followed by the money you get back each year (positive numbers), and ends with the big payout when you sell.
This simple process is what the calculator models.
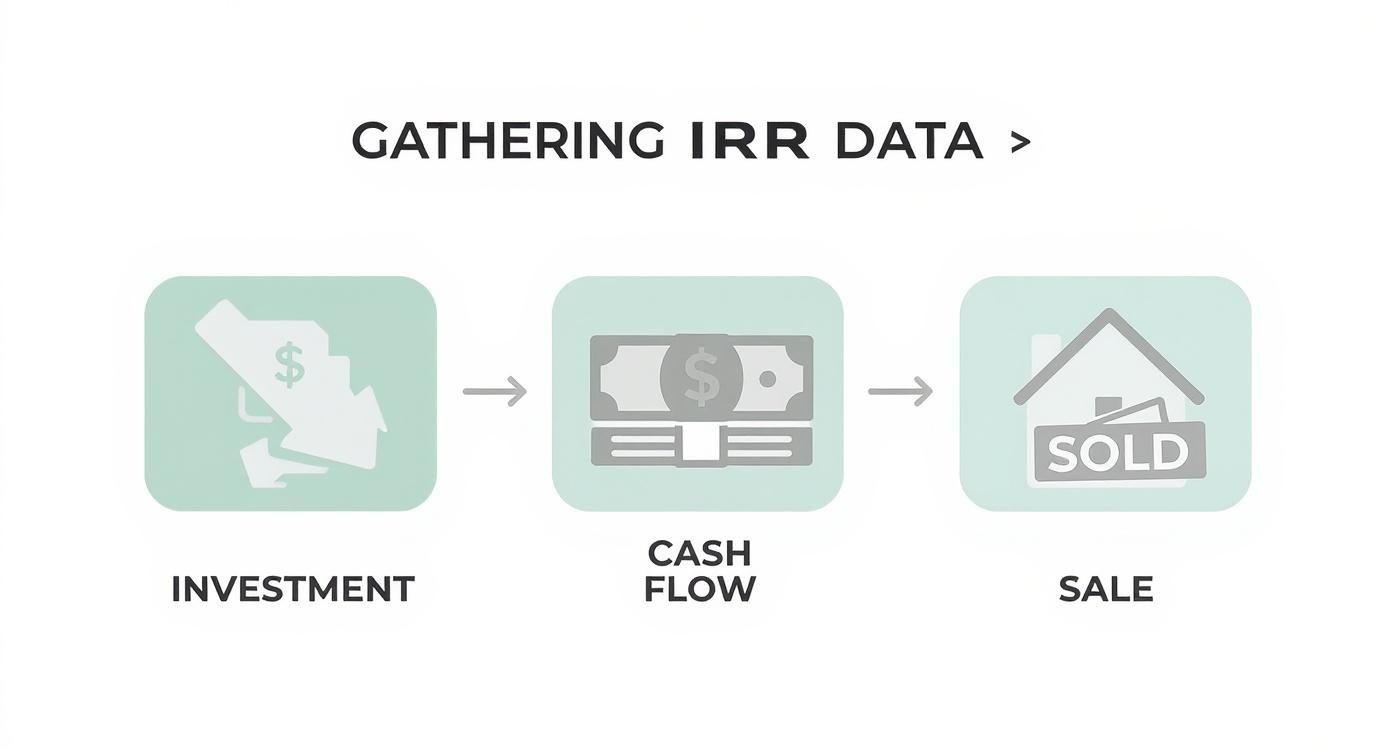
As you can see, the IRR calculation connects your initial investment, the cash flow you earn while you hold the property, and your profit from the final sale into one powerful metric.
For our example, let's assume we’re planning to hold this rental for five years.
Year 0: The Initial Investment (Cash Out)
This is the very first number you'll need. It's the total cash you have to bring to the table to close the deal, so we always treat it as a negative figure. It's money leaving your bank account.
- Purchase Price: $300,000
- Down Payment (20%): $60,000
- Closing Costs (3%): $9,000
- Initial Repairs: $6,000
- Total Initial Investment: -$75,000
So, your Year 0 cash flow is -$75,000. That's the first data point for our calculator.
Years 1-4: The Annual Operating Cash Flows (Cash In)
Next, we project the actual profit the property will generate each year. This isn't just the rent—it's your Net Operating Income (NOI) after you've paid the mortgage. For this example, let's say the annual pre-tax cash flow is $4,000 in the first year and we conservatively estimate it will grow by 3% annually as we raise rents.
- Year 1 Cash Flow: +$4,000
- Year 2 Cash Flow: +$4,120
- Year 3 Cash Flow: +$4,244
- Year 4 Cash Flow: +$4,371
These are the positive cash flows the property delivers to you year after year.
Year 5: The Big Payday from the Sale
The final piece of this puzzle is the lump sum you get when you sell the property. This is a huge part of the equation and can make or break your total return.
To figure this out, you project a future sale price, then subtract what you still owe on the mortgage and any costs to sell (like agent commissions).
A Pro Tip: Don't forget that your final year's cash flow is a combination of two things: the regular operating cash flow for that year plus the net proceeds from the sale. It's almost always the largest single positive number in your entire analysis.
Let's say in Year 5, the market has appreciated and you sell for $350,000. By then, your remaining mortgage balance is $225,000, and selling costs are $21,000 (6%).
- Net Sale Proceeds: $350,000 - $225,000 - $21,000 = $104,000
- Year 5 Operating Cash Flow: +$4,502 (That's Year 4's cash flow + 3%)
- Total Year 5 Cash Flow: $104,000 + $4,502 = +$108,502
Now we have our complete cash flow series ready for any spreadsheet or a dedicated internal rate of return calculator for real estate. This is exactly the kind of busywork that tools like Property Scout 360 are built to handle automatically. By automating these inputs, you can spend less time crunching numbers and more time actually analyzing the deal.
How to Interpret Your IRR and Run What-If Scenarios
Getting a number from an internal rate of return calculator for real estate is easy. The real work begins now: figuring out what that number actually tells you.
So, your calculation spits out a 12% IRR. Is that good? The honest answer from any seasoned investor is, "It depends." It depends on your goals, how much risk you're comfortable with, and what other opportunities you have for your money.
First things first, you need to set your own personal benchmark. We call this a "hurdle rate"—the absolute minimum return you need to make a deal worth your time and money. Think about it this way: if you can earn a relatively safe 7% from an index fund, a rental property projecting an 8% IRR might not be worth the hassle of tenants, toilets, and taxes.
What’s a “Good” IRR in Real Estate?
While there's no magic number, experienced investors tend to group deals into a few common buckets based on their return profile.
Here’s a general framework I’ve seen used time and time again:
- 8-12% IRR: This is typically the realm of stable, core properties. Think a well-located, Class A apartment building in a great neighborhood. The risk is lower, but so is the potential for explosive growth.
- 12-15% IRR: Now we're getting into "value-add" territory. These are the properties that need a little love—maybe some light renovations or better management—to boost rents and force appreciation.
- 15%+ IRR: When you see returns this high, it usually signals a higher-risk play. This could be a ground-up construction project, a complete repositioning of a troubled asset, or a bet on an unproven, up-and-coming market.
The key is to make sure the return justifies the risk. A 10% IRR on a solid, cash-flowing duplex is a win. That same 10% IRR on a speculative land deal? That's probably a hard pass. Your personal hurdle rate should climb right alongside the deal's risk profile.
For a little perspective, real estate has historically held its own against other asset classes. Publicly traded Real Estate Investment Trusts (REITs), for instance, delivered an average annual return of about 11.1% between 1972 and 2023. That's right in line with the S&P 500's performance over the same period. You can read the full analysis of real estate returns at SparkRental.com for a deeper dive.
The Power of Stress-Testing Your Assumptions
A rookie investor trusts the first number the calculator gives them. A pro intentionally tries to break it. This is where the real power of an internal rate of return calculator for real estate shines—running "what-if" scenarios. This process, often called sensitivity analysis, is what separates the amateurs from the experts.
Don't just hope your projections come true. Ask the tough questions and see what happens.
- What if my vacancy rate hits 10% instead of my rosy 5% estimate?
- What if my renovation budget balloons by 50%? (It happens!)
- What happens to my IRR if the market forces me to sell in 7 years instead of 10?
- What if rents only grow at a sluggish 2% per year instead of the 4% I was banking on?
Let's see how this plays out with a quick example. Assume our initial "base case" projection for a property gives us a 14.5% IRR.
IRR Scenario Analysis Example
| Scenario | Changed Variable | Resulting IRR |
|---|---|---|
| Base Case | Initial assumptions | 14.5% |
| Higher Vacancy | Vacancy Rate increased from 5% to 8% | 12.8% |
| Slower Rent Growth | Annual Rent Growth reduced from 3% to 1.5% | 11.2% |
| Lower Sale Price | Exit Cap Rate increased by 0.5% | 10.5% |
| Worst-Case Combo | All of the above negative changes combined | 7.1% |
By running these scenarios, you learn which assumptions have the biggest impact on your bottom line. If a tiny dip in rent growth completely tanks your returns, you know the deal is fragile. But if the IRR still looks decent even in your "worst-case" scenario, you've likely found a solid, durable investment.
This is where modern tools can really give you an edge. A platform like Property Scout 360 is built for this, letting you tweak variables on the fly and see the impact on your returns in real-time. It's an incredibly powerful way to build confidence before you ever sign on the dotted line.
Going Beyond IRR with Other Key Real Estate Metrics
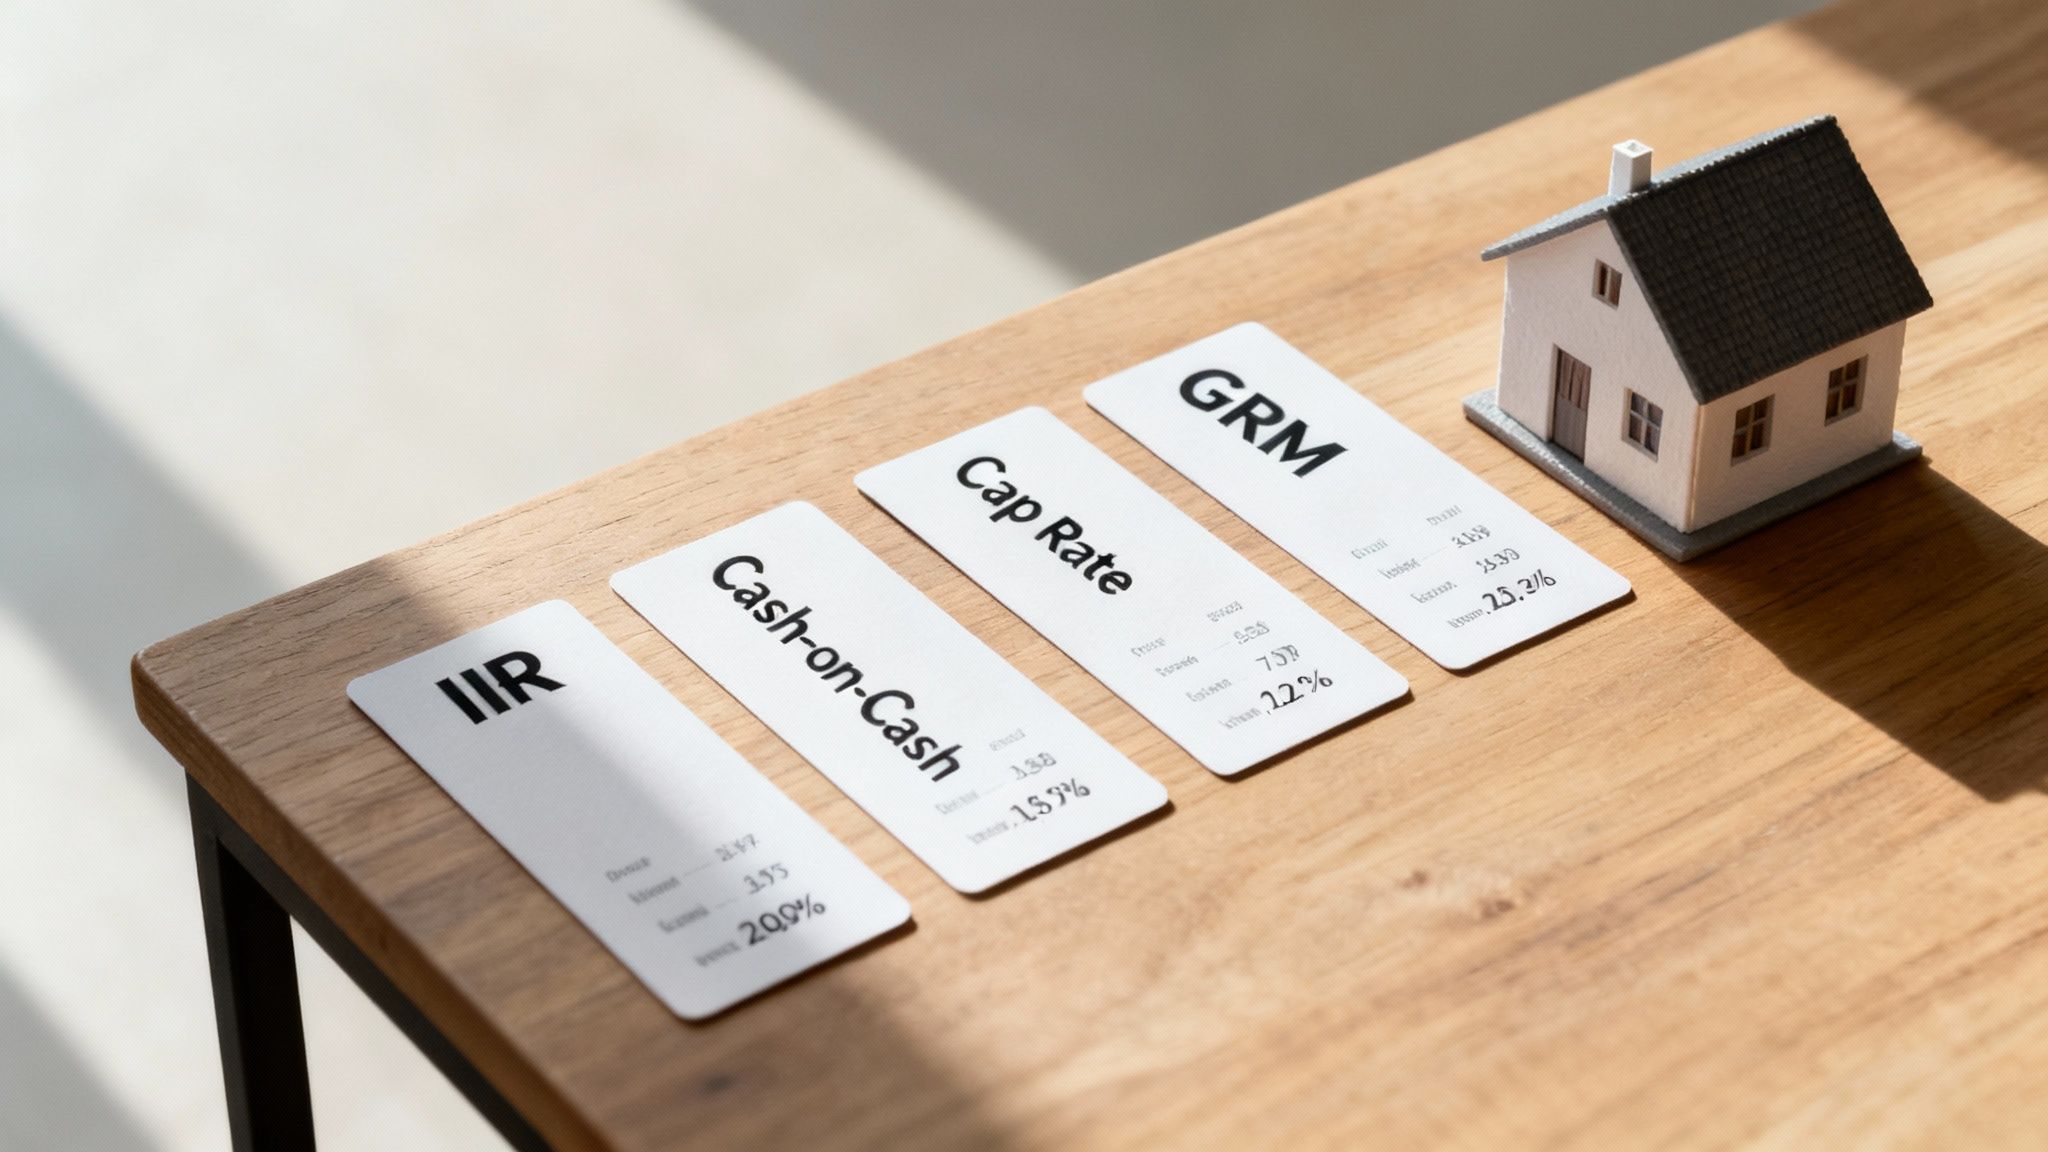
While the internal rate of return is a fantastic tool for getting a handle on a deal's performance over its entire life, it should never be the only number you look at. From my experience, the most successful investors never rely on a single metric.
Think of it this way: relying solely on IRR is like trying to navigate a city with just a compass. It tells you the general direction, but you're missing the street names, traffic patterns, and roadblocks. To really understand a deal, you need to look at it from a few different financial angles. Each metric tells its own part of the story, and together, they paint a much more complete picture of the opportunity and its risks.
Cash-on-Cash Return
If IRR is the marathon metric, Cash-on-Cash Return is the sprint. It’s all about the here and now. This metric tells you exactly what kind of annual return you’re getting on the actual cash you pulled out of your pocket.
I always think of it as the "what's this property putting in my bank account this year?" number. The math is simple:
Annual Pre-Tax Cash Flow / Total Cash Invested = Cash-on-Cash Return
So, if you put down $75,000 in cash to close a deal and it generates $6,000 in positive cash flow in the first year, you've got an 8% Cash-on-Cash Return. It’s an essential gut check for immediate profitability, especially if your goal is building passive income streams. For a more detailed walkthrough, check out our guide to using a cash on cash return calculator.
Capitalization Rate
Next up is the Capitalization (Cap) Rate. This is the industry-standard metric for quickly comparing the raw, unleveraged earning power of properties in a given market. It strips away financing completely, focusing only on the relationship between a property's income and its price.
Here's the formula:
- Net Operating Income (NOI) / Current Market Value = Cap Rate
The beauty of the cap rate is that it lets you make apples-to-apples comparisons. A property with a 6% cap rate in one part of town can be directly compared to a property with a 5.5% cap rate across town, giving you an objective look at market pricing before your specific loan terms even enter the picture.
Gross Rent Multiplier
Last but not least is the Gross Rent Multiplier (GRM). I call this the back-of-the-napkin metric. It's a quick-and-dirty tool that’s not meant for deep dives but is perfect for that initial screening phase when you’re sorting through dozens of potential deals. It just looks at the property's price relative to its gross annual rent.
By using these metrics alongside your IRR, you build a powerful system of checks and balances. You might find a deal with a killer projected IRR, but then see that its first-year cash-on-cash return is next to nothing. That’s a huge red flag for early cash flow problems. This holistic view is what separates amateur speculators from savvy investors—it ensures you don't get seduced by one shiny number and miss the whole story.
Common Questions About Real Estate IRR Calculators
Even when you feel like you've got a handle on the mechanics, a few questions always seem to pop up when you're punching numbers into an internal rate of return calculator for real estate. Let's run through some of the most common ones I hear from investors. Getting these straight can help you sidestep common mistakes and really put the metric to work for you.
What Is a Good IRR for a Real Estate Investment?
This is usually the first question people ask: "What's the magic number I should be looking for?" The honest answer is, there isn't one. A "good" IRR is completely relative to your own goals, how much risk you're willing to stomach, and the specific deal in front of you.
That said, investors often think in tiers based on the risk profile of the deal:
- 8% to 12% IRR: This is often the target for a stable, lower-risk property. Think of a turnkey rental in a great neighborhood with a solid tenant already in place. It's not a home run, but it’s a solid base hit.
- 15% or higher: When you see an IRR in this range, you're usually looking at a value-add project. These deals come with more work and more risk—maybe a gut renovation or turning around a mismanaged building—but that extra sweat equity is what earns you the higher potential return.
As a rule of thumb, your target IRR for a real estate deal should always be noticeably higher than what you could get from a passive investment like an S&P 500 index fund. If you're taking on the hassle of tenants and toilets, you'd better be compensated for it with a superior return.
Can I Calculate IRR Without a Specific Tool?
Absolutely. You don't need a fancy, dedicated real estate calculator to figure out IRR. Everyday spreadsheet software like Microsoft Excel or Google Sheets has you covered. Both have a built-in =IRR() function that does all the heavy lifting.
You just need to list your cash flows in order, year by year, in a column. Your initial investment goes in as a negative number (like -75,000 for your down payment and closing costs), and then you list all the positive annual cash flows below it. Point the IRR formula at that list of numbers, and it will spit out the percentage.
The single biggest mistake I see investors make is feeding the calculator overly rosy assumptions. Your IRR calculation is only as good as the numbers you put into it. If you plug in inflated rent growth, underestimate repair budgets, or assume an unrealistic future sale price, you'll get a beautiful IRR that is dangerously misleading.
This "garbage in, garbage out" principle is everything. Always, always ground your numbers in reality and run your analysis with conservative, market-backed data.
Ready to stop wrestling with spreadsheets and start making faster, smarter investment decisions? Property Scout 360 automates these complex calculations, letting you analyze any U.S. property in minutes. Get instant access to IRR, cash-on-cash return, 30-year projections, and more by visiting https://propertyscout360.com.
About the Author
Related Articles
Build a Powerful Rental Property Calculator XLS From Scratch
Learn to build a powerful rental property calculator XLS with this guide. Analyze cash flow, ROI, and cap rates to make smarter investment decisions.
Real Estate Investment Calculator: Analyze Deals with Confidence
Master the real estate investment calculator: a practical guide on cash flow, cap rate, and ROI to analyze properties and make smarter decisions.
Build a Pro Real Estate Investment Analysis Spreadsheet
Build a powerful real estate investment analysis spreadsheet from scratch. This guide covers key formulas, scenario testing, and cash flow analysis.