A Guide to Calculate Rental Property Value Like a Pro
Learn how to calculate rental property value using expert methods like Cap Rate, GRM, and DCF. Make smarter, data-driven real estate investment decisions.
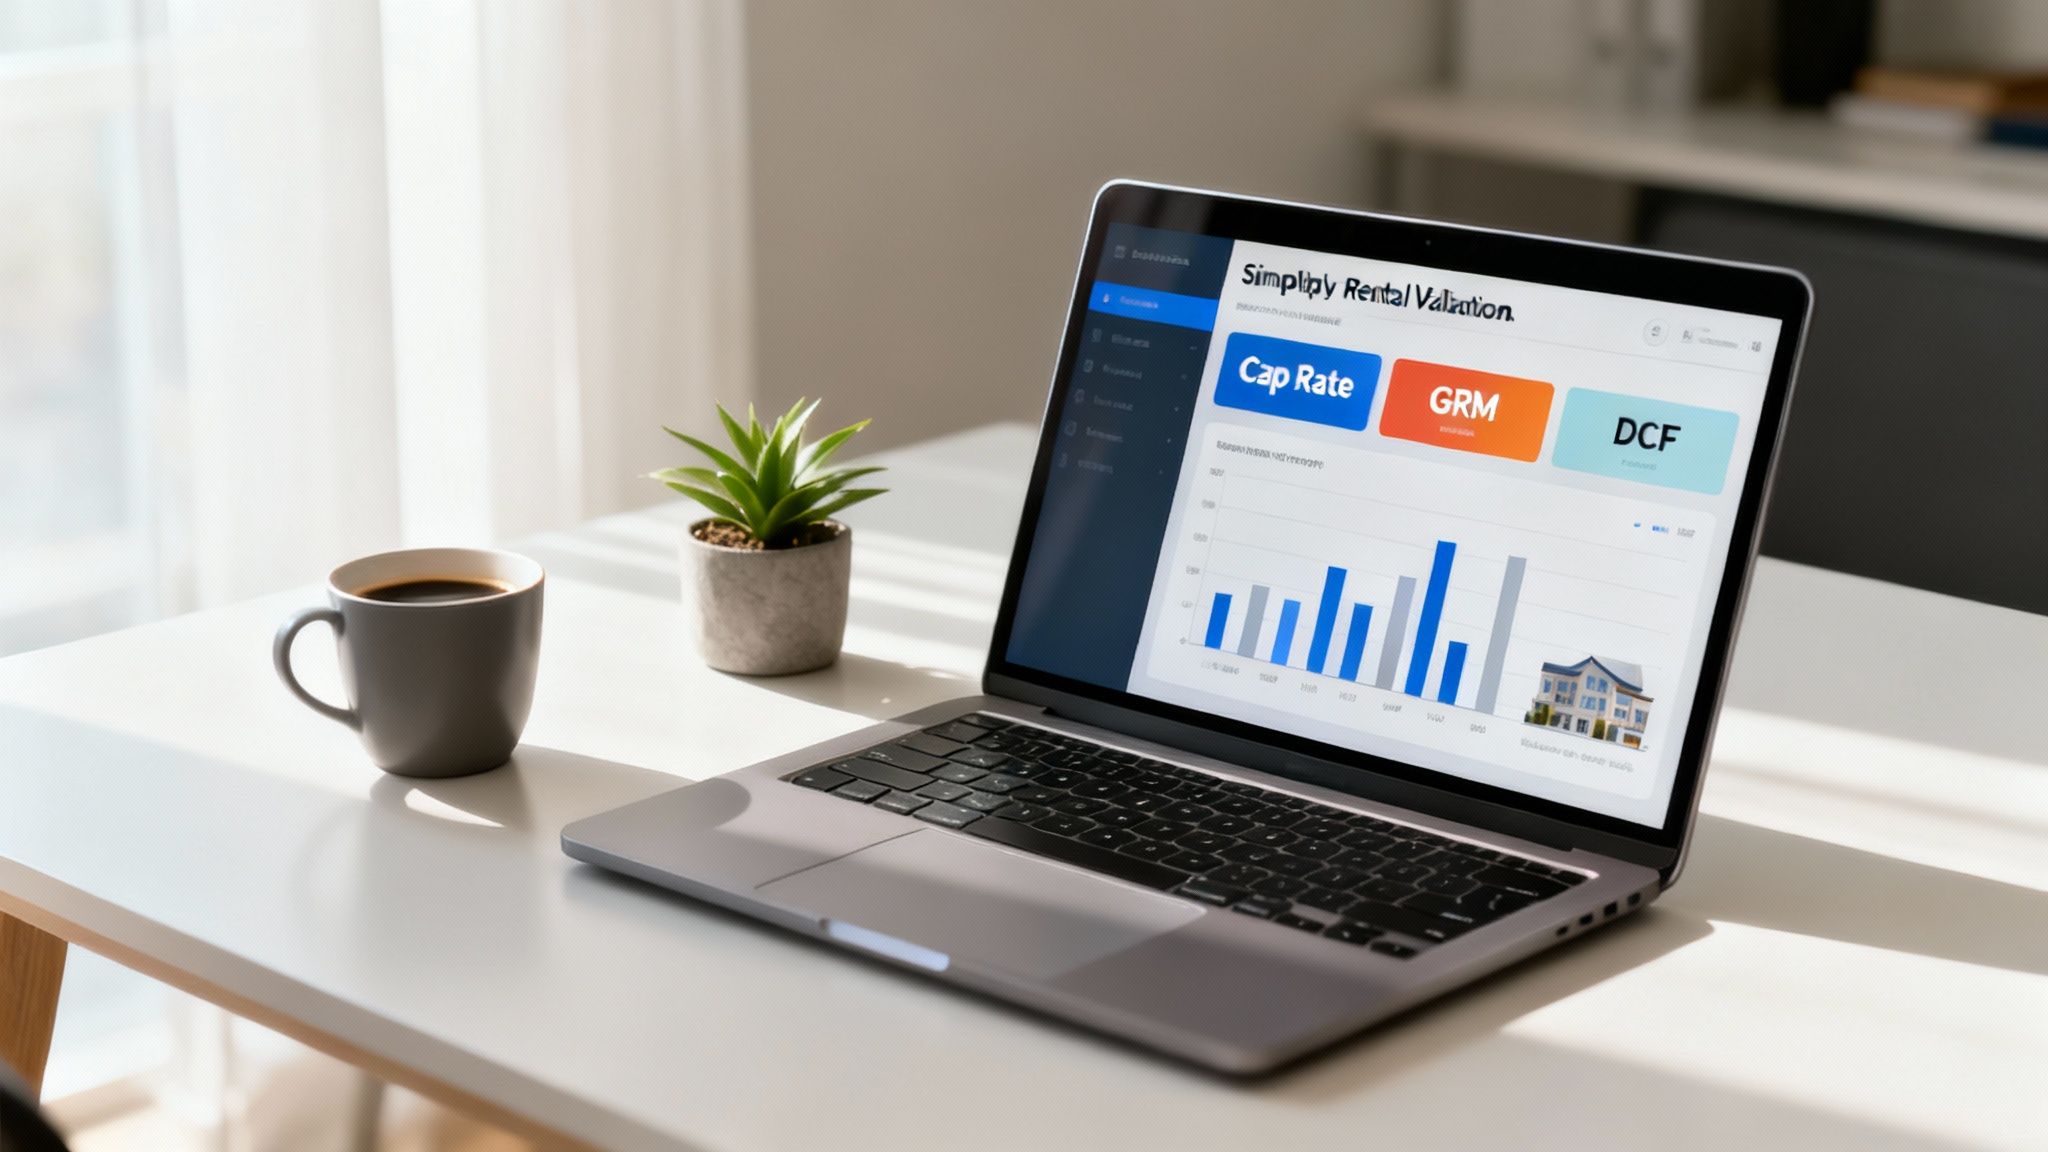
When you're looking to calculate rental property value, investors don't just pull a number out of thin air. We rely on income-based methods, with the Capitalization Rate (Cap Rate) being the go-to for comparing a property's income to its price. For a quick gut check, there's the Gross Rent Multiplier (GRM), and for a deep dive into long-term performance, the Discounted Cash Flow (DCF) model is key.
Your Foundation for Smart Rental Investing
Before you even think about making an offer, you have to understand what a property is truly worth as an income-generating asset. This means looking past the flashy sale price. Guesswork is the fastest way to a costly mistake, but a data-driven valuation is how you build a profitable, long-lasting portfolio.
Think of it this way: you're not just buying a building; you're buying a small business that should produce predictable returns.
This guide will pull back the curtain on the core valuation concepts every serious investor has in their toolkit. We’re going to walk through several powerful methods, each giving you a different angle on a property's financial health and future potential.
Why Accurate Valuation Matters
Getting this right is the absolute bedrock of a solid investment strategy. It’s what separates the pros from the amateurs. A proper valuation helps you:
- Avoid Overpaying: This is the cardinal sin of real estate investing. A good valuation stops you from getting into a deal that’s bleeding cash from day one.
- Spot Undervalued Deals: When you know what a property should be worth based on its income, you can spot the hidden gems others miss.
- Secure Financing: Banks love numbers. Show them a clear, justifiable valuation, and they'll have much more confidence in lending you the money.
- Negotiate Like a Pro: When you walk into a negotiation armed with solid data, you're not just making an offer—you're making a case.
Ultimately, all these methods are designed to help you accurately determine a property's investment potential.
A property's price is what you pay, but its value is what it earns. Mastering valuation allows you to focus on the value, ensuring every purchase moves you closer to your financial goals.
We're going to break these methods down into simple, actionable steps. Nailing this foundational skill is essential before you can truly learn https://propertyscout360.com/blog/how-to-analyze-a-rental-property for its detailed cash flow and ROI. By the time we're done, you’ll be ready to stop guessing and start investing with real confidence.
Mastering the Cap Rate Method
When you're trying to figure out if a rental property is a good deal, the capitalization rate—or cap rate—is one of the most reliable tools you can have. It’s a favorite among seasoned investors for a good reason.
Think of it like a stock's dividend yield. It gives you a quick, standardized way to measure a property's profitability and see how it stacks up against other investments. The cap rate cuts right through the fluff and gets to the heart of the matter: What’s the unleveraged return I can expect from this property’s income?
The Foundation: Net Operating Income
Before you can even think about the cap rate, you need to nail down the property’s Net Operating Income (NOI). This is a big one. NOI is the money a property brings in after you've paid all the essential operating bills, but before you've paid the mortgage or income taxes.
This distinction is crucial because it lets you evaluate the asset on its own merits, separate from whatever financing you or another buyer might arrange.
Figuring out the NOI is a pretty straightforward process:
- Start with Gross Scheduled Income (GSI): This is your best-case scenario—the total annual rent you'd collect if every unit was occupied 100% of the time. For a duplex with each side renting for $1,500 a month, your GSI would be $36,000 ($1,500 x 2 units x 12 months).
- Find Your Effective Gross Income (EGI): Now, let's get realistic. No property stays full all the time. You need to subtract a vacancy allowance. A typical vacancy rate is between 5-10%. Using a 5% rate for our duplex, we'd subtract $1,800, bringing our EGI down to $34,200.
- Deduct Operating Expenses: Finally, subtract all the costs of keeping the lights on. This includes things like property taxes, insurance, management fees, regular maintenance, and any utilities you cover. Remember, your loan payment (principal and interest) is not an operating expense.
By focusing on NOI, you assess the property's raw profitability. This allows for an apples-to-apples comparison between different properties, regardless of how an investor chooses to finance them.
Putting the Cap Rate Formula to Work
Once your NOI is solid, the cap rate math is simple. The formula gives you a direct line from the property's income to its value.
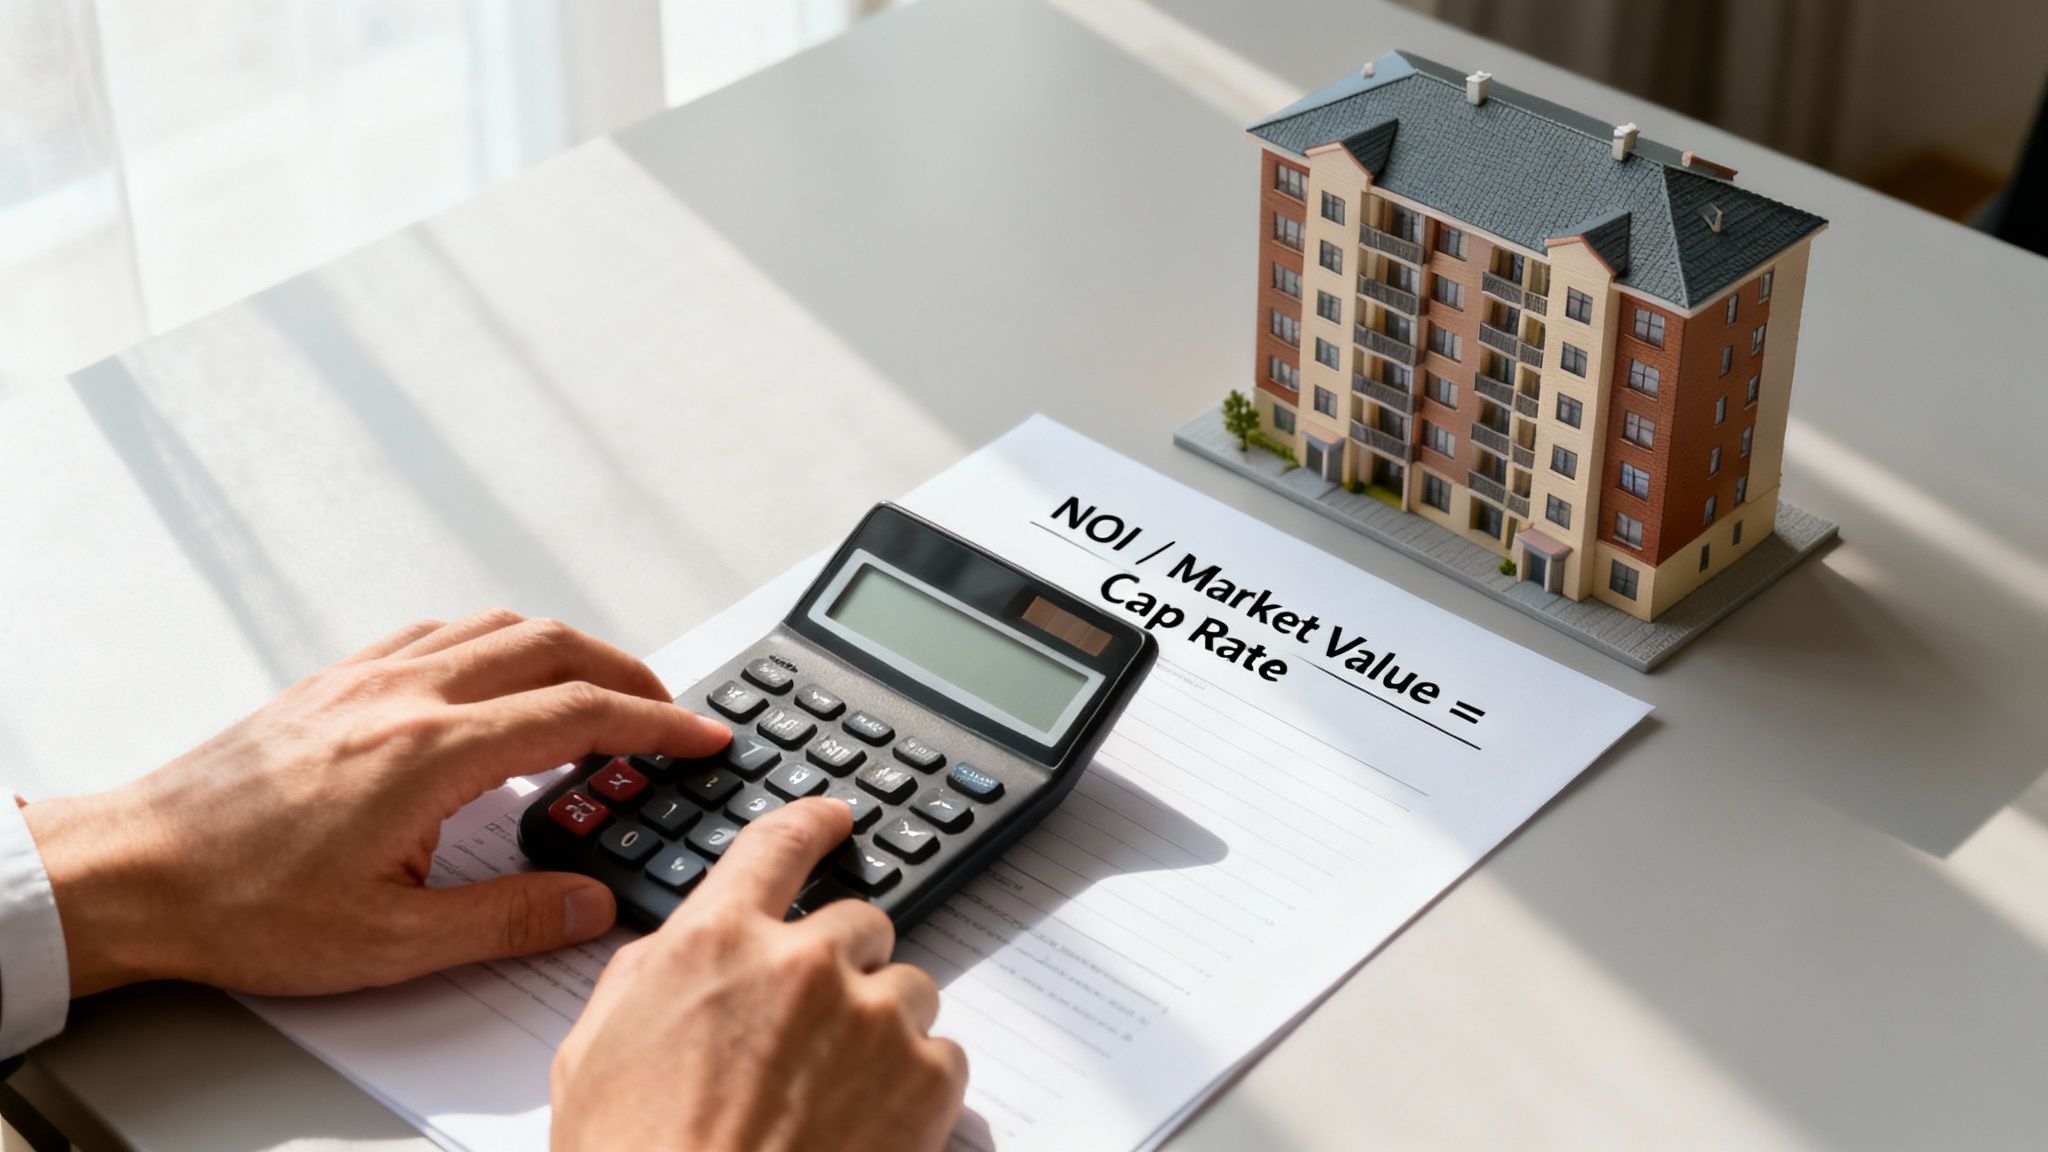
The formula is: Net Operating Income (NOI) / Current Market Value = Cap Rate
Let's stick with our duplex example. Let's say the seller is asking $500,000. We already have an EGI of $34,200. Now we need to total up the annual operating expenses.
Here’s a sample breakdown:
- Property Taxes: $6,000
- Insurance: $1,500
- Repairs & Maintenance (budgeted at 8% of EGI): $2,736
- Property Management (10% of EGI): $3,420
- Water/Sewer (paid by owner): $1,200
Total Operating Expenses come out to $14,856.
Now, let's find that NOI: $34,200 (EGI) - $14,856 (Expenses) = $19,344 (NOI).
With the NOI locked in, we can finally get our cap rate: $19,344 / $500,000 = 0.0387, which is a 3.87% Cap Rate.
Here is a table that breaks down the calculation step-by-step for our hypothetical duplex.
Sample Cap Rate Calculation Breakdown
This table illustrates how we moved from potential rent to the final cap rate, giving a clear picture of the property's financial performance.
| Financial Metric | Calculation/Value | Notes |
|---|---|---|
| Gross Scheduled Income (GSI) | $1,500/unit x 2 units x 12 months = $36,000 | The total potential rent with 100% occupancy. |
| Vacancy Loss (5%) | $36,000 x 0.05 = $1,800 | A conservative estimate for periods when a unit might be empty. |
| Effective Gross Income (EGI) | $36,000 - $1,800 = $34,200 | The more realistic annual income after accounting for vacancies. |
| Total Operating Expenses | Taxes, Insurance, Maint., Mgmt., etc. = $14,856 | All costs to run the property, excluding mortgage payments. |
| Net Operating Income (NOI) | $34,200 - $14,856 = $19,344 | The property's annual profit before debt service and taxes. |
| Cap Rate | $19,344 / $500,000 = 3.87% | The final rate of return based on the property's income stream. |
This detailed breakdown shows exactly how the numbers flow, leaving no doubt about how the final cap rate was determined.
Interpreting the Results
So, we landed on a 3.87% cap rate. What does that actually mean? By itself, not a whole lot. The magic happens when you compare it to the going cap rates for similar properties in that specific neighborhood.
You can also flip the formula around to gut-check a property's asking price. Let's say you do some research and find that the average cap rate in the area is 5%. Using our property's NOI of $19,344, you can solve for value: NOI / Cap Rate = Value.
In this case: $19,344 / 0.05 = $386,880. This calculation suggests that, based on its income, the property's value is closer to $387k than the $500k asking price. That’s a powerful piece of information for your negotiation.
Investors worldwide lean on this kind of analysis. Projections show that prime office sectors are expected to attract a huge slice of over USD 1 trillion in real estate investments by 2026. This trend underscores how investors use rates of return to find value. For instance, a property generating USD 50,000 in annual NOI at a 5% cap rate is valued at USD 1 million. In major U.S. markets, multifamily cap rates have recently averaged 5-7%, partly driven by a 28.2% surge in rents since the pandemic.
Knowing what makes a good cap rate is essential. To learn more about how location and property type affect this number, check out our guide on what is a good cap rate for a rental property.
Using the Gross Rent Multiplier for Quick Appraisals
While the cap rate gives you a sharp, surgical look at a property's profitability, sometimes you just need a quick-and-dirty tool. You need something fast and simple to help you sift through a long list of potential deals and find the few that are actually worth a closer look.
That's where the Gross Rent Multiplier (GRM) comes in.
Think of it as the investor's first filter. It's a back-of-the-napkin calculation that tells you if a property's asking price is even in the right ballpark. You wouldn't make a final decision based on it alone, but it's perfect for that initial screening phase when you're just trying to narrow the field.
The beauty of the GRM is its sheer simplicity. It completely ignores operating expenses, vacancies, and all the other nitty-gritty details that go into a full analysis. It asks one simple question: How many years would it take for the property's gross rental income to pay for the purchase price?
The GRM Formula in Action
Calculating the GRM is as straightforward as it gets. You just take the property's asking price and divide it by its total annual gross rent.
Market Value / Gross Annual Rent = Gross Rent Multiplier (GRM)
A lower GRM generally points to a more favorable price relative to the income it generates. On the flip side, a higher GRM means you're paying a premium for every dollar of rent the property brings in.
Let's walk through a real-world scenario. Imagine you're scanning new listings in a specific neighborhood and have three single-family homes you want to compare before committing hours to a deep dive.
- Property A: Asking price of $300,000, rents for $2,200/month ($26,400/year).
- Property B: Asking price of $340,000, rents for $2,500/month ($30,000/year).
- Property C: Asking price of $280,000, rents for $2,000/month ($24,000/year).
Let's run the numbers:
- Property A GRM: $300,000 / $26,400 = 11.36
- Property B GRM: $340,000 / $30,000 = 11.33
- Property C GRM: $280,000 / $24,000 = 11.67
At a glance, Properties A and B look almost identical from a GRM standpoint and appear slightly more attractive than Property C. This quick math helps you prioritize. You'd probably move on to a full cap rate analysis for A and B first, and maybe put C on the back burner.
Strengths and Weaknesses of the GRM
The biggest advantage of the Gross Rent Multiplier is its speed. When you've got dozens of properties to sift through, you don't have time to chase down expense reports for every single one. The GRM lets you use just two data points—price and gross rent—to make a fast comparison.
However, that simplicity is also its greatest weakness.
The GRM is a blunt instrument. By ignoring operating expenses, it assumes all properties have similar costs, which is rarely the case. An older property might have a fantastic GRM but be an absolute money pit because of high maintenance and utility bills.
This is exactly why the GRM should never be your final valuation metric. It’s a screening tool, not a decision-making tool. Use it to build a short list, but the real work of due diligence always comes next.
Applying GRM in a Shifting Market
In many U.S. markets, you'll find typical GRMs ranging from 8-12. This quick metric is incredibly useful for spotting potential deals, especially in a dynamic market. Global trends underscore the importance of rental income; a recent Savills report shows 82% of experts forecast prime residential rental growth and 78% anticipate higher demand.
With U.S. multifamily rents jumping 28.2% post-pandemic, a fast metric like the GRM is vital for identifying potentially undervalued assets before everyone else does.
The key is to compare apples to apples. A GRM is only meaningful when stacked up against the average GRM for very similar properties—think same age, size, type, and location. A GRM of 12 might be excellent in a high-cost coastal city but terrible in a Midwest market where the average might be closer to 8.
Using a platform like Property Scout 360 can automate this initial screening. By providing instant rent estimates and key financial metrics, it helps you filter through hundreds of listings to find properties with a GRM that aligns with your market's benchmarks. This saves you from tedious manual work and lets you focus your deep analysis only on the most promising opportunities.
Advanced Valuation With Discounted Cash Flow
When you're ready to move past back-of-the-napkin math and get serious about long-term wealth building, it’s time to embrace the Discounted Cash Flow (DCF) method. It’s definitely more involved than using a Cap Rate or GRM, but this is the tool sophisticated investors use to get the most accurate picture of an investment's true worth over its entire lifecycle.
At its core, DCF works on a fundamental financial principle: a dollar today is worth more than a dollar tomorrow. The analysis treats a rental property’s value as the sum of all its future cash flows, with each of those future dollars "discounted" back to what it's worth in the present day.
You'll project your income and expenses over a holding period—usually 5-10 years—estimate what you'll sell it for at the end, and then use a "discount rate" to pull all that future money back to today's value. It’s the ultimate way to analyze a deal if you're serious about building a strong, profitable portfolio.
Forecasting Future Cash Flows
First things first, you need to map out the property's annual Net Operating Income (NOI) for every year you plan to own it. This isn't a one-and-done calculation. The real world isn't static, and neither is your forecast.
You'll need to make a few educated guesses, or assumptions:
- Annual Rent Growth: Dig into your local market data. Is this a hot area where you can realistically bump rents by 3-5% each year? Or is it a slower, more stable neighborhood where a conservative 2% increase makes more sense?
- Expense Inflation: Your costs are going to climb, too. Think property taxes, insurance premiums, and maintenance. A general inflation rate of 2-3% annually is a reasonable starting point for most operating expenses.
- Vacancy Rates: You might have a tenant on day one, but what about in year three? Keep an eye on local economic trends. If a major employer is rumored to be leaving town, your vacancy assumption might need a second look.
By layering these growth rates year over year, you create a dynamic financial model of your property's performance. It’s a much more powerful and realistic view than a simple one-year snapshot.
Determining The Discount Rate
This next part is arguably the most critical—and most personal—piece of the puzzle. The discount rate is the minimum annual return you demand to make the investment worth your time, money, and risk.
A higher discount rate means future cash is less valuable to you today, which results in a lower valuation for the property. A lower rate does the opposite.
Think of it as your "opportunity cost." If you know you can get a relatively safe 8% return from a stock market index fund, you'd want your real estate deal to beat that, plus a little extra for the headaches and illiquidity that come with owning property.
For residential real estate, a common discount rate falls somewhere between 8-12%. A more risk-averse investor might use a rate closer to 8%, while an investor taking on a fixer-upper with more uncertainty might demand a 12% return or even higher.
The rate you choose is a direct reflection of your personal investment goals and how much risk you're comfortable with.
Projecting The Future Sale Price
The final piece of the forecast is figuring out what the property will be worth when you sell it. This is often called the terminal value or reversion value, and you don't just guess.
The standard way to do this is with a "terminal cap rate" (or exit cap rate). You'll project the property's NOI for the year after you plan to sell and divide it by your estimated exit cap rate. So, if your holding period is 10 years, you'll need the projected NOI for year 11.
A smart, conservative approach is to assume the exit cap rate will be a bit higher than the rate you're buying at today. This builds in a safety cushion. For example, if the market cap rate is 5% now, you might use a 5.5% exit cap rate in your 10-year model to protect against a potential market slowdown. This helps ensure you're not overestimating your future payday.
For investors who want to go even deeper, you can explore other metrics like the Internal Rate of Return. We have a great guide that explains how to use an internal rate of return calculator for real estate to add another layer of sophistication to your analysis.
The infographic below shows the far simpler GRM formula. It's a quick-and-dirty tool you might use for an initial look at a property before committing the time to a full DCF analysis.
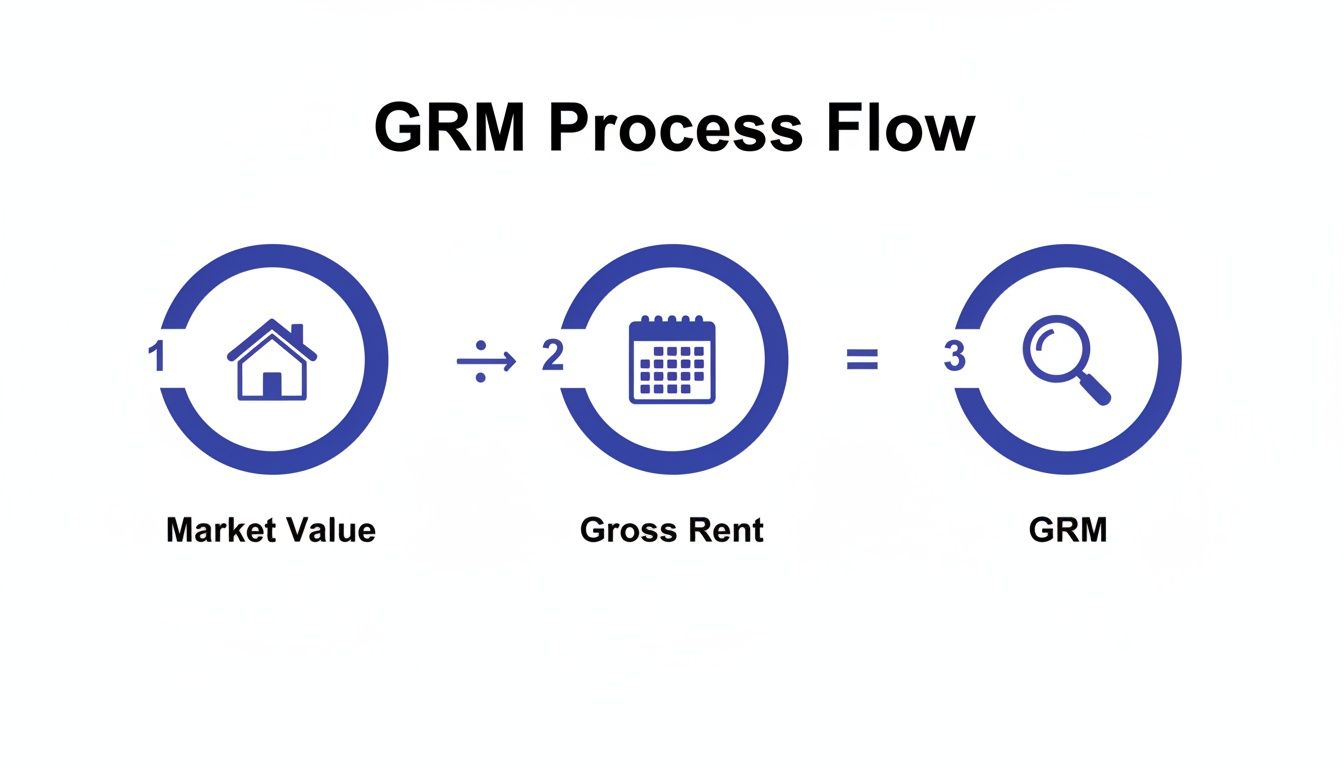
As you can see, the GRM focuses only on the relationship between price and gross rent—a stark contrast to the detailed, multi-year forecasting that DCF demands.
Bringing It All Together
Okay, you've projected your annual cash flows and estimated your terminal value. The final step is to discount each of those future dollar amounts back to what they're worth today and add them all together. The grand total is the intrinsic value of the property, according to your unique assumptions and goals.
This forward-looking approach is validated by global investment trends. In volatile markets, DCF is crucial for understanding true long-term potential. Data backed by the OECD highlights how strong demographic shifts in cities are likely to keep rental demand high.
In the U.S. market, a proper DCF analysis for a well-chosen multifamily property can reveal potential cash-on-cash returns in the 10-15% range. This level of detailed analysis is what separates casual investors from those who build lasting wealth.
While it's undoubtedly complex, DCF is the most powerful method out there. It forces you to think like a long-term business owner, not just a property buyer.
Valuation Method Comparison At A Glance
To help put these different income-based methods into perspective, here’s a quick summary of when and why you might use each one.
| Method | Best For | Key Pro | Key Con |
|---|---|---|---|
| Cap Rate | Quickly comparing similar properties in a specific market. | Simple, widely used, and great for initial screening. | Ignores financing and doesn't account for future growth. |
| GRM | Fast, high-level screening, especially for smaller properties. | Extremely easy to calculate with minimal data needed. | Ignores all operating expenses, making it very rough. |
| DCF Analysis | In-depth analysis for making final buy/sell decisions. | Provides the most complete, long-term financial picture. | Complex, time-consuming, and relies on many assumptions. |
Each method has its place in your toolkit. The key is knowing which one to pull out for the job at hand—from a quick look to a deep, analytical dive.
Using Sales Comps for a Reality Check
While income-based models like Cap Rate and DCF are fantastic for judging a property as a business, you can't get tunnel vision. At the end of the day, a property is only worth what someone is willing to pay for it.
This is where the Sales Comparison Approach comes in. Think of it as your ultimate reality check. It grounds your spreadsheet analysis in what’s actually happening in the market, forcing you to see the property through the eyes of a buyer, an appraiser, or a bank.
If your income analysis tells you a property is worth $400,000, but nearly identical houses on the same block have been selling for $320,000, you’ve got a major red flag. Something in your math, or your understanding of the market, is off.
Finding and Selecting Quality Comps
The whole approach hinges on finding good "comps"—recently sold properties that are genuinely similar to the one you're analyzing. This isn't a step you can rush. Your valuation is only as good as the comps you choose.
So, what makes a great comp? You’re looking for properties that are as similar as possible across a few key criteria:
- When did it sell? Ideally, you want sales from the last three to six months. A year-old sale might as well be from a different market entirely.
- How close is it? The closer, the better. Stick to the same neighborhood or subdivision, and never cross major boundaries like a highway or school district line.
- Is it a twin? Look for homes with a similar age, square footage (within 10-15% is a good rule of thumb), bed/bath count, and lot size.
This kind of sales data is what professionals like real estate agents and brokerages live and breathe. You can often find it on public real estate sites, but for the best data, tapping an agent with MLS access is the way to go.
Making Smart Value Adjustments
Let's be real: no two properties are ever exactly the same. One might have a slick new kitchen, while your target property has an old, dated one. This is where you have to play appraiser and make adjustments.
It’s a bit of an art, but it’s rooted in logic. You assign a dollar value to the differences. For instance, say your target property has a two-car garage, but a nearly identical comp that sold for $350,000 only has a one-car garage. You’d need to add value to the comp's price. If a local agent tells you a garage stall is worth about $15,000 in that area, you’d adjust that comp's sale price up to $365,000.
Pro Tip: Always adjust the comp's price, never your target property's. If the comp is better (e.g., has a new roof), you subtract value from its sale price. If the comp is worse (e.g., smaller square footage), you add value. The goal is to figure out what the comp would have sold for if it were identical to your property.
Here's a quick look at how that plays out:
| Feature | Subject Property | Comp 1 (Sold $350k) | Adjustment | Adjusted Price |
|---|---|---|---|---|
| Beds/Baths | 3 bed / 2 bath | 3 bed / 2 bath | $0 | |
| Square Feet | 1,800 sq ft | 1,750 sq ft | +$5,000 | |
| Garage | 2-car | 1-car | +$15,000 | |
| Condition | Updated | Needs work | +$20,000 | |
| Total | $390,000 |
Once you've done this for three to five solid comps, you’ll have a tight range of adjusted values. This range gives you a powerful, market-driven estimate of your target property's worth, serving as the final, critical piece of your valuation puzzle.
Turning Your Calculations Into Confident Decisions
Alright, you've run the numbers. You've got your Cap Rate, GRM, a DCF projection, and a stack of sales comps. Now you're staring at a spreadsheet, and the figures might be pointing in different directions. This is the moment where the real analysis begins.
Don't be alarmed if your valuation methods don't spit out the exact same number. That's not just normal; it's expected. For example, your DCF model might paint a rosy picture based on projected rent increases, while the sales comps are pulling the value down to what the market is paying today. The trick is to dig into why they don't match up.
Weighing The Results
So, which number do you trust? It all comes back to your personal investment strategy.
If you're a buy-and-hold investor, your world revolves around long-term cash flow. In that case, the Cap Rate and DCF valuations should be your North Star. These methods are fundamentally about the property's ability to generate income over time.
If you're more focused on appreciation or a potential flip, the sales comps are king. They give you a snapshot of current market sentiment and what someone else is likely to pay for the property in the near future.
Here's how I think about it: your income-based numbers (Cap Rate, DCF) reveal the property’s intrinsic value as a business. The sales comps show its market price. A truly great deal happens when you can buy for a price well below its intrinsic value.
This is how you move from just crunching numbers to making savvy investment choices. When you understand the story each metric is telling you, you can finally make that 'buy' or 'pass' call with genuine conviction.
Common Questions on Valuing Rental Properties
Even after you've learned the formulas, a few real-world questions always pop up when you start running the numbers. Let's tackle some of the most common sticking points that trip up investors.
What’s a Good Cap Rate for a Rental Property?
Honestly, there's no magic number. A "good" cap rate is completely relative to the specific market, the type of property, and how much risk you're comfortable taking on.
In many major US cities, you'll find that multifamily properties trade somewhere in the 5-7% cap rate range. If you see a deal advertised with a cap rate over 8%, it might look great on paper, but it could also signal higher risk—maybe it's in a rougher part of town or needs a ton of work. On the flip side, cap rates of 4-5% are common in those stable, "A-class" neighborhoods where demand is sky-high. The returns are lower, but so is the risk. The trick is to compare your target property against what's typical for that specific area.
How Can I Estimate Operating Expenses if the Seller Has No Data?
This happens more often than you'd think. If you can't get reliable expense numbers from the seller, you absolutely should not just guess. A good starting point is the 50% Rule, a well-known guideline that assumes your operating expenses (everything except the mortgage) will be about half of your gross rental income.
For a more dialed-in estimate, you can build your expense forecast piece by piece:
- Property Taxes: Don't take the seller's word for it. Look up the property on the county assessor's website for the real numbers.
- Insurance: Call a couple of local insurance agents who specialize in investment properties and get actual quotes.
- Vacancy: A safe bet is to budget 5-10% of the gross rent for times the unit sits empty.
- Repairs & Maintenance: Plan on setting aside 5-15% of gross rent. Use the higher end of that range for older buildings with deferred maintenance.
- Property Management: If you're not managing it yourself, expect to pay a professional between 8-12% of whatever rent they collect.
Which Valuation Method Is the Best?
The best investors know this is a trick question. You don't use just one—you use them in combination to get a well-rounded view of the deal. Each method tells you something different.
Think of it like a toolkit. The Gross Rent Multiplier (GRM) is your quick-and-dirty tool for a fast initial check. The Cap Rate is the industry standard for comparing one property's profitability against another. Discounted Cash Flow (DCF) is for the deep dive into long-term performance. And the Sales Comparison Approach keeps your feet on the ground with a reality check based on what's actually selling. Using all of them together is how you build a valuation you can stand behind.
Stop drowning in spreadsheets and start making confident investment decisions. Property Scout 360 gives you instant cap rate, cash flow, and ROI projections for any U.S. property, turning hours of analysis into minutes. Find your next profitable rental with Property Scout 360.
About the Author
Related Articles
2026 Investor's Guide: Cost of Installing a Sewer Clean Out
Understand the cost of installing a sewer clean out for investment properties in 2026. Get expert advice on prices, ROI, & budgeting for flips. Plan smart!
15 Year vs 30 Year Mortgage: The Investor's Choice
Deciding between a 15 year vs 30 year mortgage for a rental property? Our guide analyzes cash flow, ROI, and equity to help you pick the best loan.
Real Estate Appraisal Software: Features & Limits
Discover what real estate appraisal software is, its core features, and limits. See how it differs from investment tools for profitable deals.