How to Analyze a Rental Property Like a Pro
Learn how to analyze a rental property with our guide. We cover key metrics, cash flow, and market analysis to help you invest with confidence.
To really nail the analysis of a rental property, you have to do some groundwork first. It's a simple, three-part framework: define your goals, create a research roadmap, and then—and only then—dive into the hard numbers. This whole process is about building a solid foundation before you ever get tempted by a specific deal, moving you from emotional decisions to ones based on solid data.
Building Your Investment Foundation
Before you even start scrolling through property listings, a successful analysis begins with the right mindset and a clear plan. This isn't just about plugging numbers into a spreadsheet. It's about developing a repeatable system you can use for every single property that crosses your desk. This foundational work is what separates disciplined investors from those just chasing a gut feeling.
It all starts with a little self-reflection. You need to know exactly what you're trying to achieve, because your personal goals will dictate which numbers and metrics actually matter.
Define Your Investment Goals
First things first, what does a "good deal" actually look like to you? An investment that's a home run for one person might be a total dud for another. Are you looking for immediate monthly cash flow to pad your income, or are you playing the long game, focused on appreciation to build wealth over decades?
Maybe you're aiming for a mix of both. Or perhaps you're drawn to a specific strategy like the BRRRR method (Buy, Rehab, Rent, Refinance, Repeat), which has its own unique set of numbers to watch. Knowing your target lets you create a "buy box"—a specific set of criteria a property has to meet before you'll even waste your time looking at it.
Key Takeaway: You can't measure success without a target. A property netting $200/month in cash flow might be a huge win for a first-time investor, but it could be a waste of time for a seasoned pro aiming for much bigger returns.
This simple visualization lays out how you move from high-level goals to the nitty-gritty data.
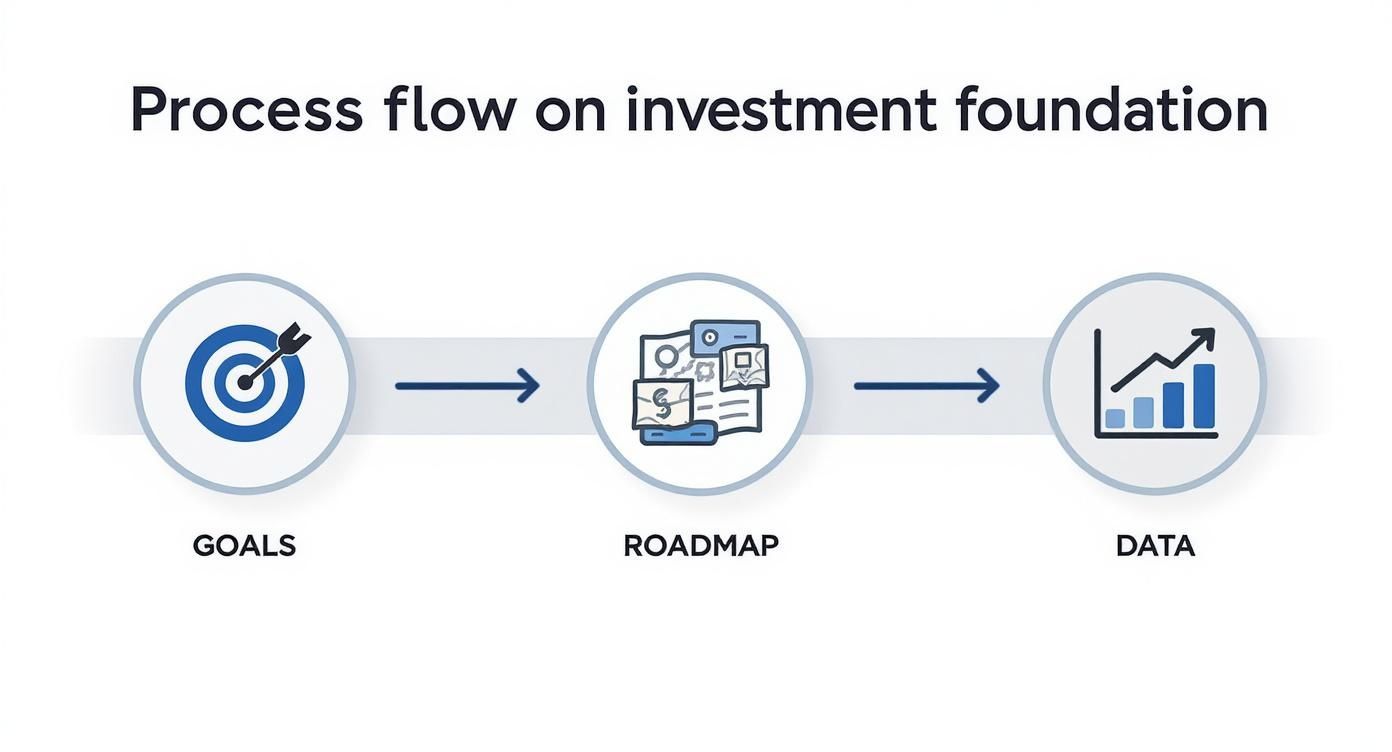
As you can see, a solid analysis isn't just a random collection of calculations; it's a logical, sequential process.
Establish Your Analytical Roadmap
With your goals locked in, you can map out how you'll analyze potential deals. Think of this as your personal checklist—it brings structure to the chaos and makes sure you don’t overlook something critical.
A solid roadmap usually looks something like this:
- Market-Level Research: Get a feel for the economic health of the entire city or region. Is it growing or shrinking?
- Neighborhood Vetting: Zoom in on specific areas. What are the schools like? What about crime rates and local amenities?
- Property-Specific Financials: This is where you forecast income, list out every possible expense, and calculate your key performance metrics.
- Due Diligence: Time to verify everything. Get inspections, review the documents, and make sure your assumptions were correct.
Following the same roadmap every time means you can compare different properties apples-to-apples, making your final decision based on objective data instead of a whim. If you're just getting started and want to build that base of knowledge, checking out some of the best real estate books for beginners can give you some great frameworks to add to your toolkit. This structured approach is your blueprint for making smarter, more confident investment choices right from the start.
Get the Lay of the Land: Market and Neighborhood Analysis
A killer property in a failing neighborhood is a money pit, plain and simple. That old real estate mantra—location, location, location—isn’t just a cliché. For rental investors, it's everything. The health of the market dictates who your tenants are, how much you can charge for rent, and whether your property's value will climb or tank. Nail this, and you've built your investment on solid ground.
I always approach this like I'm looking at a map. You don't just pick a random street; you start with the state, narrow it down to the city, and only then do you zoom in on the specific block.
Start with the Big Picture: Is the City Healthy?
Before you fall in love with a property, you need to vet the city or metro area it’s in. You’re looking for a place with a strong, diversified economy that pulls people in, creates jobs, and keeps the demand for housing high.
Here are the vital signs I always check:
- Job Growth: Are companies hiring here? A city with steady job growth is a magnet for new residents, which means a bigger pool of tenants for you. Check out the local chamber of commerce or city economic development websites for this data.
- Population Trends: Are people moving in or out? I use data from the U.S. Census Bureau to see the long-term trends. A steady climb in population is one of the best indicators of a healthy rental market.
- Industry Mix: Is the whole town propped up by one big factory? That's a huge red flag. If that one industry hits a rough patch, the entire local economy can go down with it. You want to see a healthy mix of different sectors—think healthcare, tech, education, and government jobs.
Getting these macro trends right is non-negotiable. Globally, the real estate rental market is valued at around USD 2.91 trillion as of 2025 and is expected to reach USD 3.87 trillion by 2029. That's a huge 7.4% annual growth rate, fueled by things like remote work and the simple fact that buying a home is getting tougher. This makes rentals a fantastic asset, but only if you're in the right markets. You can find more insights on the global rental market growth to see the bigger picture.
Zoom In: What’s the Neighborhood Vibe?
Okay, so you've found a promising city. Now it's time to get granular. Two houses just a few streets apart can be worlds away in terms of investment potential. Your goal is to pinpoint a neighborhood that attracts the kind of stable, long-term tenants you want.
Put on your detective hat and dig into these local factors:
- School Districts: Great schools are a powerful magnet, even if your ideal tenant doesn't have kids. They anchor property values and draw in responsible people, which elevates the entire area.
- Crime Rates: This one is a deal-breaker. No one wants to live where they don't feel safe. Your local police department's website is the best place to find crime maps and stats. Low crime is essential for attracting tenants who will treat your property with respect.
- Amenities and Convenience: Can tenants walk to a coffee shop, a grocery store, or a park? Is public transit nearby? Convenience is a massive selling point and can absolutely justify a higher rent.
- Signs of Growth: Keep your eyes peeled for new construction, homes being renovated, and new businesses popping up. These are the tell-tale signs that money and confidence are flowing into the area.
My Go-To Move: I always spend a weekend in a neighborhood I'm serious about. Drive it, walk it, and see it at different times. That quiet street on a Tuesday morning might be a parking nightmare on Friday night. Look at the neighboring houses—are the lawns mowed? Is there pride of ownership? That tells you more than any spreadsheet.
Run the Numbers: Comparative Market Analysis
You’ve found a great neighborhood. The final piece of the puzzle is a comparative market analysis (CMA). This is where you ground your expectations in reality by comparing your target property to similar ones nearby, often called "comps." This single step will help you figure out a fair offer price and what you can realistically charge for rent.
A proper CMA looks at two different sets of comps:
- Sales Comps: Find at least three properties with a similar bed/bath count and square footage that have sold in the last three to six months. This is how you figure out the property’s market value and make sure you aren’t overpaying.
- Rental Comps: Now, find at least three similar places that are currently rented or listed for rent. This is your best crystal ball for projecting monthly income. Be brutally honest when comparing their condition and amenities to your potential property.
Running the comps is the most critical part of a solid rental property analysis. It forces you to ditch the wishful thinking and base your financial projections on hard data. Get this wrong, and even a great property can become a losing investment.
Forecasting Income and Operating Expenses
This is where the rubber meets the road. An accurate financial forecast is the absolute bedrock of a sound investment, separating the deals that build wealth from those that drain your bank account. It’s time to move past the flashy listing photos and dig into the real numbers.
Getting this right means building a complete picture of every dollar coming in and every dollar going out. I've seen too many new investors get tripped up by underestimating the true cost of owning a rental. Our goal here is to create a detailed, line-item budget that leaves no stone unturned.

Projecting Your Total Income
Sure, your primary income source is the gross monthly rent, but stopping there is a rookie mistake. A savvy investor knows how to spot all potential revenue streams.
Think about ancillary income. These little extras can seriously boost your bottom line:
- Pet Fees: A one-time fee or monthly "pet rent" is pretty standard these days.
- Laundry Facilities: In a multi-family building, coin-op or app-based laundry is a steady, reliable moneymaker.
- Parking Fees: Don't underestimate this one. In tight urban areas, a dedicated parking spot can easily command a hefty monthly fee.
- Late Fees: You don't want to rely on these, but they are part of the potential income picture and should be in your lease agreement.
You also need to ground your rent projections in reality. Recent trends show serious upward pressure on rents; in 2024, about 85% of landlords increased them to offset their own rising costs. Even with vacancy rates ticking up slightly to 6.9%, the median rent for a two-bedroom unit still climbed 3.2% to $1,906 a month. This kind of data is crucial for realistic forecasting. You can discover more rental market trends and insights at Baselane.com to make sure your numbers are sharp.
Building a Detailed Expense Sheet
This is where the dream meets reality. It's tempting to use shortcuts like the "50% Rule," which suggests operating expenses will eat up about half of your gross rent. While it’s fine for a quick gut check, making a final decision based on it is just asking for trouble.
You absolutely must build a line-item budget with real, local numbers. Property taxes in New Jersey are a world away from those in Alabama, and that single line item can make or break a deal.
Investor Insight: Never, ever trust the expense numbers on a seller's proforma statement without verifying them yourself. Always do your own homework to get accurate, local estimates for every single line item.
To create a realistic budget, it's helpful to see a breakdown of common expenses. The table below shows a sample annual budget for a typical single-family rental, which you can use as a template for your own analysis.
Sample Annual Operating Expense Breakdown
| Expense Category | Estimated Annual Cost | Notes & Assumptions |
|---|---|---|
| Property Taxes | $3,000 | Based on county assessor records; confirm if a sale will trigger reassessment. |
| Insurance | $1,200 | Quote for a landlord policy, not a standard homeowner's policy. |
| Vacancy | $1,200 | Assumes 5% of a $24,000 gross annual rent. Adjust for market conditions. |
| Repairs & Maintenance | $1,800 | Budgeting 7.5% of gross rent for routine upkeep and small fixes. |
| Property Management | $2,160 | Standard 9% of collected rent. Include even if self-managing. |
| Capital Expenditures (CapEx) | $1,800 | Setting aside 7.5% of gross rent for future big-ticket items. |
| Utilities (Owner-paid) | $600 | Includes water/sewer, trash collection. Highly variable by location. |
| Total Annual Expenses | $11,760 | 49% of Gross Annual Income. In this case, the 50% rule was close! |
This detailed breakdown ensures you're looking at the complete financial picture and understand exactly where your money is going each month. Now, let's dive into what each of those categories really means.
Key Operating Expense Categories
Here are the non-negotiable expenses you have to nail down.
Property Taxes: This is an easy one to find. Just look up the property on the local county assessor’s website. But be careful—a recent sale often triggers a reassessment, meaning your tax bill could jump significantly higher than what the previous owner paid.
Insurance: Don’t just guess. Call an insurance broker and get a real quote for a landlord policy. It costs more than a standard homeowner's policy because it includes liability coverage specific to tenants and rentals.
Vacancy: No property stays occupied 100% of the time. Period. A conservative vacancy estimate is 5-8% of the gross annual rent. If you’re in a slower market or the property needs some work, I’d even bump that up to 10% to be safe.
Repairs and Maintenance: This covers the day-to-day stuff—a leaky faucet, a running toilet, a broken light switch. A good rule of thumb is to budget 5-10% of the gross rent, adjusting based on the property's age and condition. An older home will almost always cost more to maintain.
Property Management: Thinking of managing it yourself? Great, but you should still budget for this expense. Professional managers typically charge 8-12% of the collected monthly rent. By including this in your analysis, you confirm the deal still works if you ever decide to hire out the work. Trust me, you'll want that option. To go deeper on this, you can learn more about how to calculate cash flow on a rental property in our detailed guide.
Capital Expenditures (CapEx): This is the big one that so many people forget. CapEx is your savings account for major replacements. We're talking about a new roof ($10,000+), an HVAC system ($7,000+), or a water heater ($1,500+). Setting aside 5-10% of gross rent for these future costs prevents one major repair from wiping out years of your hard-earned profit.
Running the Numbers: How to Calculate Key Investment Metrics
Now that you have your income and expense projections, it’s time for the fun part—turning those raw numbers into real, actionable insights. This is where you move past guesswork and start making confident decisions. The metrics we're about to cover are the language of successful real estate investing, and they'll tell you the true story of any deal.

These calculations aren't just academic exercises. They’re the tools you’ll use every day to compare properties, understand your real returns, and build a profitable portfolio. Let's walk through them one by one with a practical example.
Start with Net Operating Income (NOI)
The first and most important number you need is the Net Operating Income (NOI). Think of NOI as the property's pure profit before you factor in any mortgage payments. It’s a crucial figure because it lets you compare the performance of different properties on an apples-to-apples basis, regardless of how they’re financed.
The formula is dead simple:
NOI = Gross Operating Income - Total Operating Expenses
Remember, Gross Operating Income is your total rent after accounting for vacancy, plus any other income streams. And Total Operating Expenses includes everything we budgeted for—taxes, insurance, maintenance, etc.—but it does not include your mortgage payment.
Find Your Real Monthly Cash Flow
While NOI is great for comparisons, Cash Flow is the metric that hits your bank account. This is the actual money you have left over each month after paying every single bill, including your mortgage. It’s the ultimate test of a property's day-to-day performance.
Calculating cash flow is just one more step:
- Cash Flow = Net Operating Income (NOI) - Debt Service (Mortgage Payment)
Positive cash flow means the property pays you to own it. Negative cash flow means you’re paying to own it, a situation you want to avoid unless you have a very specific appreciation-heavy strategy in mind.
Let's plug in some numbers.
Example: Single-Family Rental
- Gross Annual Income: $24,000 ($2,000/month rent)
- Total Annual Expenses: $11,760 (from a sample budget)
- Annual Mortgage Payment: $10,800 ($900/month)
- Calculate NOI: $24,000 (Income) - $11,760 (Expenses) = $12,240 NOI
- Calculate Cash Flow: $12,240 (NOI) - $10,800 (Mortgage) = $1,440 Annual Cash Flow
That breaks down to $120 per month in your pocket. Now you have a real number to work with.
Use the Cap Rate for Quick Comparisons
The Capitalization Rate (Cap Rate) is one of the most common metrics you'll hear about, especially when looking at larger or commercial properties. It gives you a fast way to gauge a property's potential return and see if it’s priced in line with the rest of the market, completely independent of financing.
Here’s the formula:
- Cap Rate = Net Operating Income (NOI) / Property Purchase Price
Let's stick with our example and say the purchase price is $250,000:
- Cap Rate = $12,240 (NOI) / $250,000 (Price) = 4.9%
A higher cap rate often signals a higher potential return, but it can also mean higher risk. A lower cap rate might point to a safer, more stable investment in a premium area. Once you learn the typical cap rates for your target market, you can instantly spot whether a deal is priced right. To get a better handle on this, you can learn more about how to calculate cap rate and what it really tells you.
Calculate Your True Return with Cash-on-Cash
This is it. For most investors, this is the number that matters most. The Cash-on-Cash (CoC) Return tells you exactly how hard your own money is working for you. It measures the annual cash flow you get relative to the total amount of cash you had to bring to the table.
The formula is:
- Cash-on-Cash Return = Annual Pre-Tax Cash Flow / Total Cash Invested
Your Total Cash Invested is everything you paid out-of-pocket: the down payment, all your closing costs, and any upfront repair costs to make the property rent-ready.
Continuing Our Example:
- Purchase Price: $250,000
- Down Payment (20%): $50,000
- Closing Costs: $7,500
- Initial Repairs: $5,000
- Total Cash Invested: $50,000 + $7,500 + $5,000 = $62,500
Now, let's calculate the CoC Return:
- CoC Return = $1,440 (Annual Cash Flow) / $62,500 (Total Cash Invested) = 2.3%
A 2.3% Cash-on-Cash return is pretty low. Many investors look for returns in the 8-12% range, or even higher. This number immediately tells us that to make this deal work, we'd need to negotiate a much lower price, find a way to boost income, or cut expenses.
Key Takeaway: While a property's cap rate is useful for market analysis, your Cash-on-Cash return tells you if the deal is actually good for your money.
Of course, these powerful metrics depend on a healthy rental market. Fortunately, housing supply constraints and affordability issues are pushing more people to rent. Research shows that over 80% of households in many developed economies are leaning toward renting, and there's a global housing shortage estimated at 6.5 million units. This deficit continues to fuel strong rental demand across the U.S., Europe, and the Asia-Pacific region. You can discover more insights about this global housing trend at Hines.com.
By mastering these key calculations, you can analyze any deal with confidence and make data-driven decisions that build real wealth.
Finalizing Your Analysis with Due Diligence
You’ve run the numbers, your spreadsheet looks good, and the property seems like a winner on paper. But now comes the most important part of the entire process: due diligence.
This is where you stop being an analyst and start being a detective. Your goal is to verify every single assumption you've made, transforming your financial model from a hopeful projection into a battle-tested plan. This final phase is your safety net, designed to catch the expensive problems that glossy photos and pro forma statements conveniently hide.
Trust, But Get a Professional Inspection
Let me be blunt: never, ever skip the professional home inspection. I don’t care if the property was built last year and looks flawless. An inspection is your best and cheapest insurance policy against the kind of hidden nightmares that can drain your bank account.
An experienced inspector is trained to see things you and I would walk right past. They spot the subtle signs of foundation issues, notice the outdated wiring hidden behind a fresh coat of paint, and can tell you if that 20-year-old furnace is on its last legs.
For a few hundred dollars, you get a comprehensive report that becomes an incredibly powerful negotiating tool. You can now go back to the seller and ask for repairs or a credit at closing, directly improving your bottom line before you even own the place. Skipping this step is easily one of the biggest and most costly mistakes new investors make.
A good inspection will give you the real story on the most critical systems:
- Roof and Attic: How much life is left? Are there signs of past or current leaks?
- Foundation and Structure: Is there cracking, bowing, or water intrusion that points to bigger problems?
- HVAC System: What’s the age and condition of the furnace and A/C? An unexpected replacement can cost thousands.
- Plumbing and Electrical: Are we looking at old galvanized pipes or a fuse box that needs a complete overhaul?
Investor Insight: Don't stop at the general inspection. If the inspector flags a potential roof issue, pay a roofer $100 to come out and give you a detailed quote. This turns a vague "roof problem" into a hard number, like an $8,000 replacement cost, that you can take straight to the negotiating table.
Stress-Test Your Deal with a Sensitivity Analysis
The numbers you first run are almost always a best-case scenario. But what happens when reality hits? This is where a sensitivity analysis comes in handy. It’s a fancy term for a simple but powerful exercise: playing "what if" with your numbers to see just how fragile your deal is.
You’re essentially stress-testing your investment to find its breaking point. You don't need complicated software—just make a few copies of your spreadsheet and start plugging in some less-than-ideal scenarios.
Here are a few I run on every potential deal:
- The Vacancy Spike: What if it takes three months to find a tenant instead of one? If your vacancy rate jumps from 5% to 15% for the year, does the property still break even, or are you feeding it cash every month?
- The Rent Drop: The market softens, and you can only get $1,750 in rent instead of the $1,900 you projected. Is it still a good investment?
- The Big Repair: The water heater dies unexpectedly, costing you $2,000. Or worse, the main sewer line needs a $5,000 repair. Can your reserves handle that hit without wiping out your entire year's cash flow?
This exercise tells you how much wiggle room you truly have. A deal that only works if everything goes perfectly is a house of cards. A great deal can take a few punches and still come out profitable.
Hunt for Red Flags Before It's Too Late
The due diligence period is your last chance to walk away. Now is the time to look beyond the physical property and dig into any potential legal or financial skeletons in the closet.
Keep a sharp eye out for these classic deal-killers:
- Zoning & Code Violations: Call the local building department. Is that basement apartment a legal unit, or was it an unpermitted DIY job? Are there any open violations you’ll be on the hook for?
- Problematic Tenant History: If the property comes with a tenant, you need to see the lease and, more importantly, the payment history (estoppel certificate). A string of late payments or past evictions is a massive red flag.
- Title & Ownership Issues: The title company will run a search for this. You’re looking for any unexpected liens (like an unpaid contractor bill), easements that limit your use of the property, or ownership disputes.
- High Insurance Claims: Ask the seller for a CLUE report. This shows every insurance claim filed on the property in the last seven years. A history of water damage claims, for example, might tell you there’s a recurring plumbing issue the seller "forgot" to mention.
Getting through this final checklist ensures you're moving forward with total clarity, armed with verified facts, not just optimistic assumptions.
Common Questions on Rental Property Analysis
Even after you've run all the numbers, a few nagging questions always seem to surface. These are the practical, real-world doubts that bridge the gap between a spreadsheet and a signed contract. Let's tackle a few of the most common ones to help you analyze deals with more confidence.

What Is the Most Important Metric for a Rental Property?
While every metric tells you something, most seasoned investors will tell you to focus on the Cash-on-Cash Return. Why? Because it's the most personal number. It answers the one question that really matters: "For every dollar I pull out of my own pocket, how much am I getting back each year?"
Cap Rate is fantastic for a quick, apples-to-apples comparison of properties in a given market. But a solid Cash-on-Cash return proves that your specific investment—your down payment, closing costs, and rehab budget—is working hard for you.
How Can I Accurately Estimate Repair Costs?
A common rule of thumb is the 1% Rule, which suggests setting aside 1% of the home's purchase price annually for maintenance. So, for a $300,000 house, that’s $3,000 a year, or $250 per month. It's a decent starting point.
But you can get much more precise. The real key is to look at the age and condition of the big-ticket items. A property with a brand-new roof and a modern HVAC system will have a very different maintenance budget than one with a 15-year-old furnace on its last legs.
Investor Takeaway: Never, ever skip a professional home inspection. It’s the difference between guessing and knowing. An inspector's report gives you a concrete list of potential capital expenditures you can budget for before you're locked into the deal.
Should I Count on Appreciation in My Analysis?
Here's the disciplined investor's answer: Treat appreciation as a fantastic bonus, not a reason to buy the property. Your deal analysis should stand entirely on its own two feet, based on its ability to generate positive cash flow from day one.
Why? Because market values can be wildly unpredictable. Banking on appreciation is speculating, not investing. A truly great rental property is profitable from the moment your first tenant moves in, purely based on the rent it brings in.
If the property also happens to climb in value, your total return gets a massive boost. But by focusing on cash flow, you insulate yourself from market slumps and build a portfolio that produces consistent, reliable income no matter what the headlines say.
Tired of getting lost in spreadsheets for every potential deal? Property Scout 360 delivers instant, comprehensive property analysis, letting you evaluate profitable U.S. rentals in minutes, not weeks. You can run different financing scenarios, get accurate cash-on-cash projections, and make decisions backed by solid data. Stop guessing and start investing smarter by visiting https://propertyscout360.com.
About the Author
Related Articles
2026 Investor's Guide: Cost of Installing a Sewer Clean Out
Understand the cost of installing a sewer clean out for investment properties in 2026. Get expert advice on prices, ROI, & budgeting for flips. Plan smart!
15 Year vs 30 Year Mortgage: The Investor's Choice
Deciding between a 15 year vs 30 year mortgage for a rental property? Our guide analyzes cash flow, ROI, and equity to help you pick the best loan.
Real Estate Appraisal Software: Features & Limits
Discover what real estate appraisal software is, its core features, and limits. See how it differs from investment tools for profitable deals.