Master the metric: calculate equity multiple explained
Learn how to calculate equity multiple with practical examples. See how this metric compares to IRR and how to apply it.
To get your equity multiple, you simply divide the total cash you get back from a deal by the total cash you put in.To get your equity multiple, you simply divide the total cash you get back from a deal by the total cash you put in. That’s it.
This simple but powerful metric answers one of the most important questions an investor can ask: for every dollar I invest, how many dollars will I get back by the time this is all over? An equity multiple of 2.0x, for instance, means you've doubled your money.
What Equity Multiple Reveals About Your Investment
Think of the equity multiple as a complete, cumulative snapshot of an investment's performance from the day you buy it to the day you sell it. Unlike other metrics that focus on annual returns, this one tells the story of the entire journey.
It's so useful because it accounts for every single dollar that comes back to your pocket, including:
- Ongoing Cash Flow: All the net rental income you collect after paying the mortgage and all other expenses.
- Capital Events: Any cash you pull out from a refinance during the holding period.
- Final Sale Proceeds: The net profit you pocket after selling the property and paying off the loan.
By rolling all these cash infusions into one number, the equity multiple gives you a crystal-clear picture of how much wealth an asset generated compared to your initial out-of-pocket investment.
Equity Multiple At a Glance
So, what does a "good" equity multiple look like? It really depends on the deal, but this table gives you a quick reference for what the numbers mean.
| Equity Multiple Value | Meaning for Your Investment | Example ($100k Invested) |
|---|---|---|
| < 1.0x | You lost money. You didn't even get your original capital back. | You get back less than $100,000. |
| = 1.0x | You broke even. You got your initial investment back, but no more. | You get back exactly $100,000. |
| 1.0x to 2.0x | You made a profit. You got your money back plus some extra. | You get back between $100,001 and $200,000. |
| > 2.0x | You doubled your money (or more). This is often a sign of a great deal. | You get back more than $200,000. |
A higher multiple is generally better, but as we'll see, the time it takes to achieve that multiple is also a critical piece of the puzzle.
Why This Metric Matters So Much
The equity multiple is a favorite for assessing the absolute return on capital, especially in commercial real estate. Pros use it to quickly size up a deal's potential. Imagine an investor buys a small apartment building for $4 million cash. They collect $300,000 in net cash flow each year for five years ($1.5 million total) and then sell it for the original $4 million.
The total cash returned is $5.5 million ($1.5M cash flow + $4M sale). The initial investment was $4 million. This results in a 1.375x multiple, a concept detailed further in this excellent commercial real estate guide.
The beauty of this metric is its simplicity. It cuts through the noise and financial jargon to give you one straightforward number.
An equity multiple below 1.0x means you lost capital. Anything above 1.0x means you made a profit. If you see a 2.5x multiple, it means for every dollar you put in, you got $2.50 back.
The Bigger Picture on Your Investment
At the end of the day, the equity multiple helps you understand how efficiently your money was multiplied over the entire life of an investment. It doesn't care about timing—its only job is to compare total cash out versus total cash in.
This makes it a fantastic starting point for comparing different opportunities, whether you're looking at a quick house flip or a long-term rental property. It provides the foundational answer to the most important question: was this investment successful in growing my original capital?
Breaking Down the Equity Multiple Formula
The Equity Multiple formula looks simple on the surface, and that’s its beauty. But don't let that fool you—the real skill is in understanding what goes into the two main components. Getting the inputs right is what separates a flimsy guess from a solid, bankable projection.
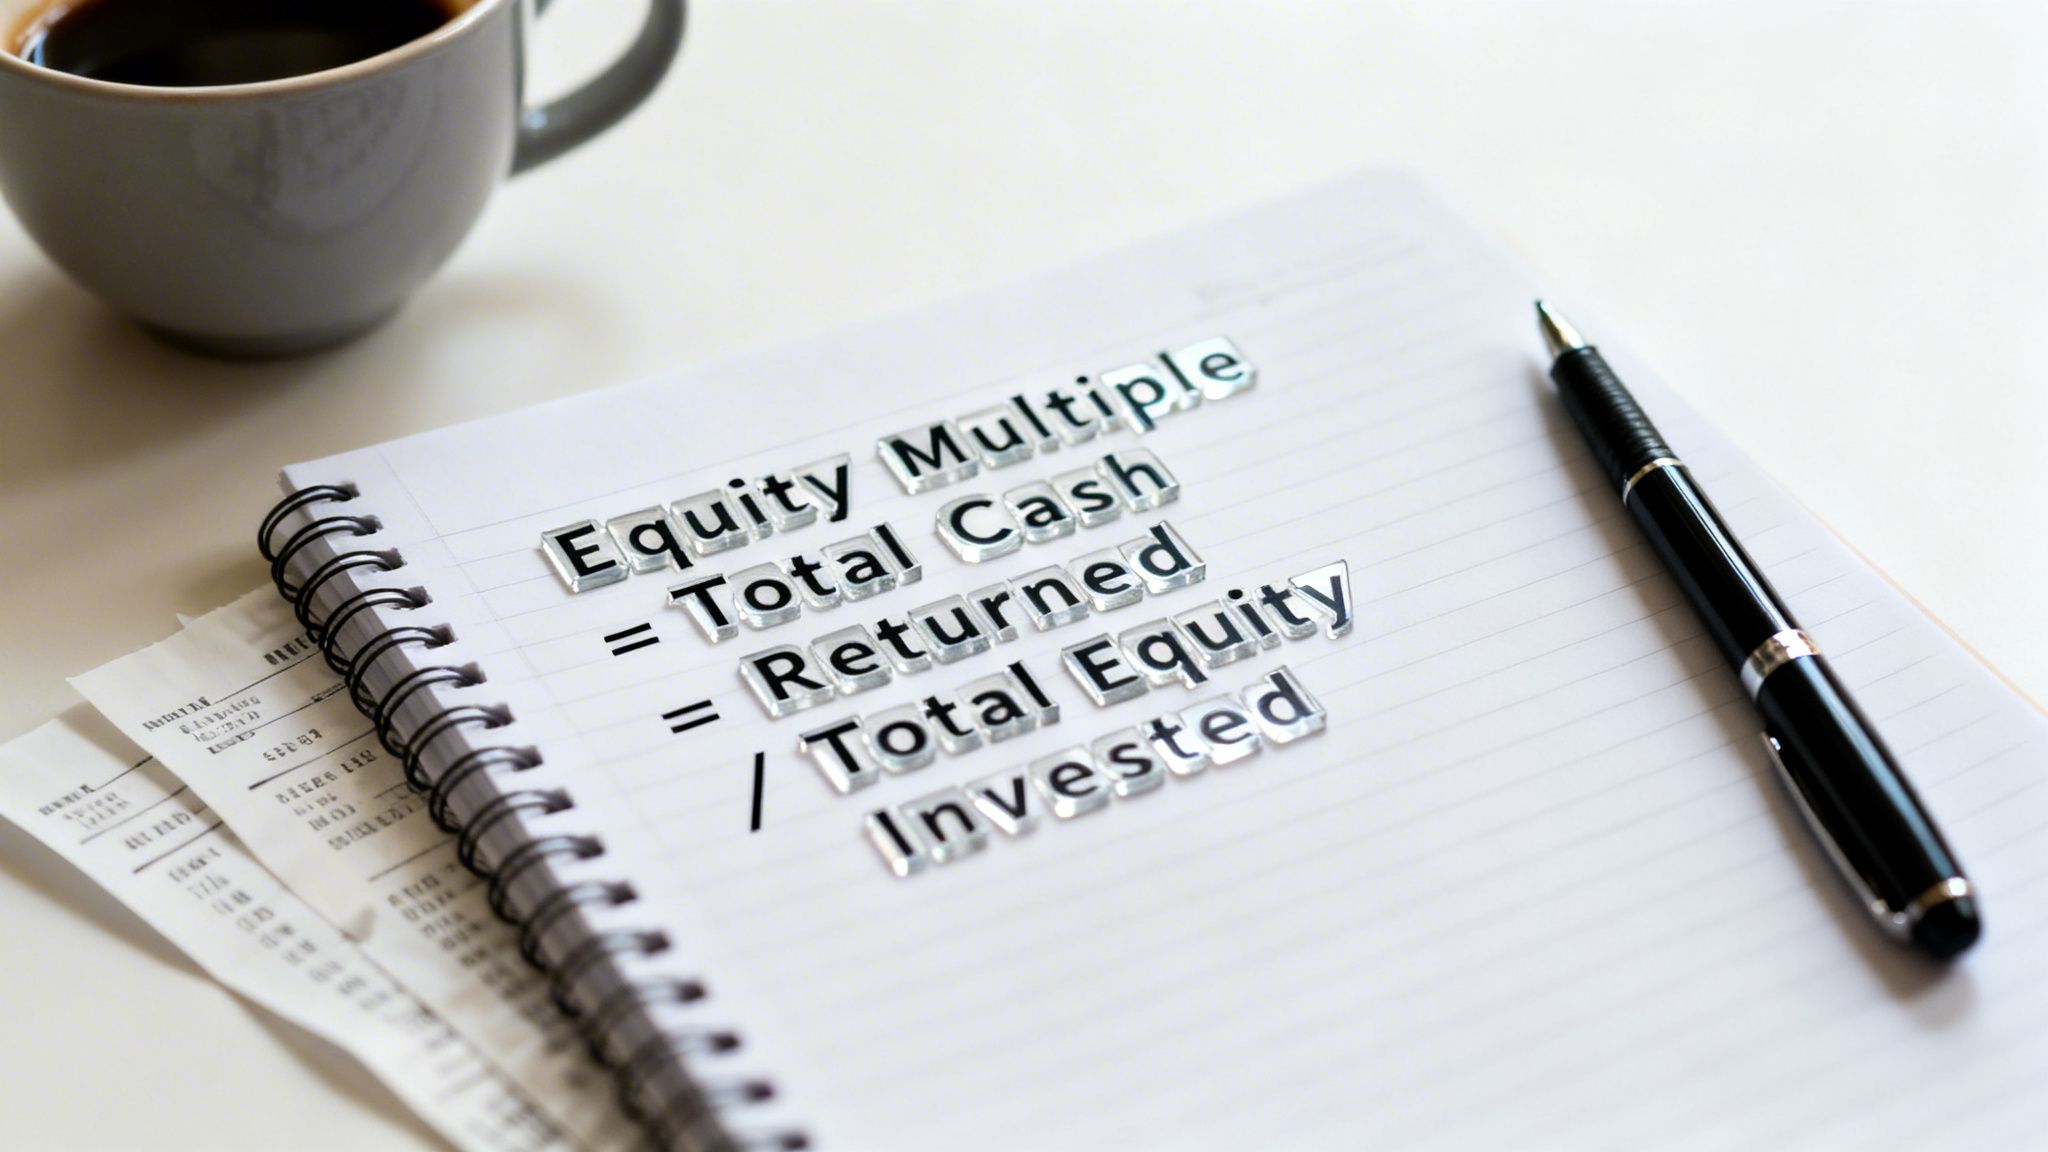
At its core, the formula is:
Equity Multiple = Total Cash Distributions / Total Equity Invested
Let’s dig into what these terms actually mean out in the field.
Identifying Your Total Equity Invested
This is the denominator, the "skin in the game" part of the equation. It's every single dollar you personally contribute to buy the property and get it off the ground. A common mistake is thinking this is just the down payment. It’s not.
Your Total Equity Invested is the sum of all your upfront, out-of-pocket costs:
- The Down Payment: The big one. This is the lump sum you pay to secure the mortgage.
- Closing Costs: All those miscellaneous fees that add up fast—lender fees, title insurance, appraisal, legal paperwork. You should budget anywhere from 2% to 5% of the purchase price for these.
- Upfront Renovation Capital: This is cash you need on day one for immediate repairs or planned upgrades to force appreciation. If you need to put in a new kitchen or replace the roof right after closing, that money is part of your initial investment.
Basically, if you had to write a check for it to get the deal done and ready to perform, it belongs in this bucket. Add it all up, and you have your Total Equity Invested.
Pinpointing Your Total Cash Distributions
Now for the fun part—the numerator. This is the total cash that comes back to you and any other equity investors over the entire investment lifecycle, from the first rent check to the final wire transfer from the sale.
It's a cumulative figure. You have to account for every dollar returned.
What to Include in Total Cash Distributions:
- Cumulative Net Cash Flow: This is the profit you pocket after all the bills are paid. For a rental, it's the total rent you've collected over the years, minus every operating expense and mortgage payment. It's the slow-and-steady return.
- Capital Event Proceeds: Did you pull off a cash-out refinance in year three? That influx of tax-free cash that lands back in your bank account is a distribution. You absolutely have to count it.
- Net Sale Proceeds: This is the final payout. It's the amount you walk away with after selling the property, paying off the remaining loan balance, and covering all selling costs like realtor commissions.
Tally up the ongoing cash flow, any mid-hold cash-out events, and the final proceeds from the sale. That gives you your Total Cash Distributions.
Divide that grand total by your initial investment, and you've got your Equity Multiple. It gives you a clear, holistic view of how much your money grew from start to finish.
Putting the Calculation to Work with Real Scenarios
Theory is great, but let's be honest—the numbers only start to make sense when you apply them to actual deals. Seeing how the equity multiple works in practice is where the lightbulb really goes on.
We're going to walk through three completely different investment strategies. This will show you just how flexible this metric is, whether you're in it for the long haul or just a quick flip. No matter the deal, the equity multiple always gets back to that one core question: for every dollar I put in, how many am I getting back?
Example 1: The Classic Buy-and-Hold Rental
Let's start with a classic. You've found a solid single-family home that looks perfect for a long-term rental. The plan is to hold it for five years, let it cash flow, and then sell.
First, let's figure out how much cash you need to bring to the table.
- Down Payment (20%): $60,000
- Closing Costs (3%): $9,000
- Initial Repairs (Carpet & Paint): $6,000
- Total Equity Invested: $75,000
Over those five years, the property is a steady performer, generating positive cash flow after you've paid the mortgage, taxes, insurance, and set aside money for maintenance. If you want to get into the weeds on that part, we've covered it in detail in our complete guide to rental property cash flow analysis.
Now, let's see what comes back into your pocket.
- Cumulative Net Cash Flow (5 Years): $15,000 (that’s $250/month)
- Net Sale Proceeds (After Loan Payoff & Fees): $127,500
- Total Cash Distributions: $142,500
With those two key numbers—total cash in and total cash out—the calculation is a piece of cake.
Equity Multiple = $142,500 / $75,000 = 1.9x
A 1.9x multiple means you nearly doubled your money over those five years. You got your initial $75,000 back, plus another $67,500 in profit on top. Not bad at all.
Example 2: The Quick House Flip
Next up, a much faster-paced deal: a six-month house flip. With a flip, there’s no long-term cash flow to worry about. Your entire return comes at the very end when you sell.
For this kind of project, your upfront investment is usually heavier because of the renovation budget.
- Down Payment (Hard Money Loan): $40,000
- Closing Costs: $8,000
- Full Renovation Budget: $55,000
- Total Equity Invested: $103,000
There's no monthly rent check coming in. After six months of managing contractors and making design choices, you sell the beautiful, renovated property.
- Cumulative Net Cash Flow: $0
- Net Sale Proceeds (After Loan Payoff & Fees): $145,000
- Total Cash Distributions: $145,000
Let's run the numbers for this flip.
Equity Multiple = $145,000 / $103,000 = 1.41x
Wait, 1.41x? That's lower than the rental example. But here's the crucial part: you made that return in just six months, not five years. This is a perfect illustration of how the equity multiple gives you a fantastic snapshot of total return, but you always need to consider the timeline to get the full story.
Example 3: The BRRRR Strategy
Finally, let's tackle the BRRRR (Buy, Rehab, Rent, Refinance, Repeat) method. This one's a bit more complex because it involves a cash-out refinance—a major financial event that happens right in the middle of your holding period.
We'll assume you hold the property for two years before ultimately selling.
Initial Investment Phase:
- Down Payment (Cash Purchase): $150,000
- Closing Costs: $4,500
- Rehab Budget: $45,500
- Total Equity Invested: $200,000
After you've fixed it up and placed a tenant, you do a cash-out refinance about six months into the deal. This is a key "cash distribution" moment.
Cash Distributions Breakdown:
- Cash-Out Refinance Proceeds: The bank lets you pull out $180,000, which pays back most of the money you put in.
- Cumulative Net Cash Flow (2 Years): The property cash flows for two years, bringing in a total of $9,600.
- Net Sale Proceeds (Year 2): When you sell, you pay off the new loan and walk away with $50,000.
Now, let's add up every dollar that came back to you over the life of the deal.
- Total Cash Distributions: $180,000 (Refi) + $9,600 (Cash Flow) + $50,000 (Sale) = $239,600
Let's run that final calculation.
Equity Multiple = $239,600 / $200,000 = 1.2x
The 1.2x multiple might seem low, but think about what really happened here. The BRRRR strategy let you pull 90% of your cash back out within six months. You could then take that money and go find another deal, all while this first property kept making you money. The equity multiple perfectly captures all these moving pieces to give you a true, complete picture of the deal's profitability.
Building Your Own Equity Multiple Calculator
Let's be honest, canned examples are great for learning, but the real magic happens when you start running your own numbers. This is where a simple equity multiple calculator in Excel or Google Sheets becomes one of your most powerful tools for sniffing out good deals. It doesn’t have to be some beast of a spreadsheet; it just needs to be organized.
The whole point is to create a template you can use over and over. You plug in the numbers for a potential property, and—boom—you get an instant read on its long-term potential. Seeing the cash flows mapped out over time, from that first check you write to the final deposit from the sale, is the bedrock of good deal analysis.
The flow chart below breaks down the three main stages of money movement in a real estate investment. Your calculator needs to track every single one.
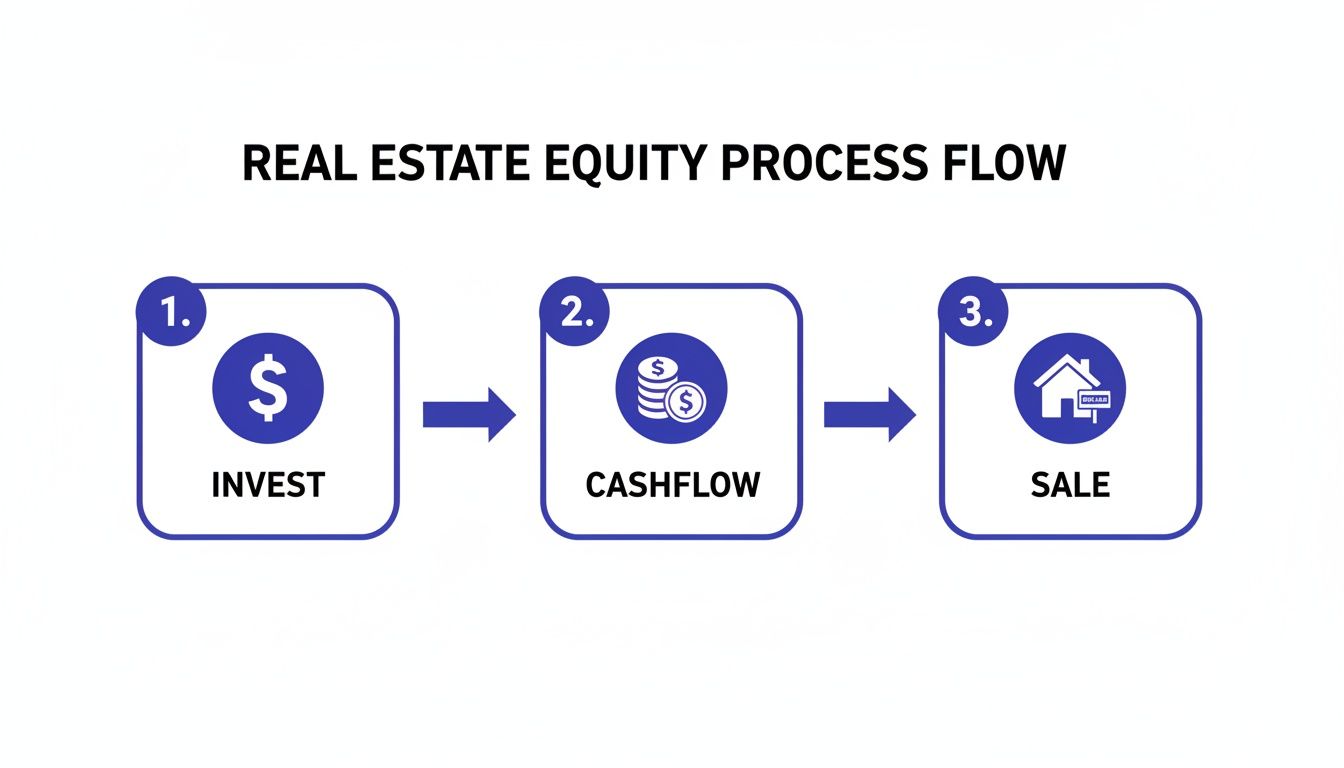
This visual really drives home the point: you have to account for every dollar you put in, every dollar the property spits out during the hold period, and every dollar you get back when you sell.
Setting Up Your Spreadsheet
Pop open a blank spreadsheet. The key to a useful calculator is a logical structure that tracks the investment's financial story year by year.
You'll want to create a few essential rows to capture the full picture:
- Initial Equity Invested: This is your total cash out-of-pocket (down payment, closing costs, initial rehab). Make it a negative number.
- Annual Net Cash Flow: The pure profit from rent each year after paying the mortgage and all other expenses.
- Capital Events: A crucial row for one-time cash events, like pulling money out from a cash-out refinance.
- Net Sale Proceeds: The cash you walk away with after selling the property and paying off the mortgage and closing costs.
This isn't just theoretical. For example, the firm REEP Equity, which has delivered a historical average equity multiple of 2.04x to its investors, often uses value-add strategies that involve a mid-hold refinance. I saw one deal where they returned 104% of the initial investor capital before the property was even sold. That's a massive capital event that completely changes the equity multiple calculation and shows why that row is non-negotiable for accurate analysis.
The Formulas for Your Final Calculation
Once your sheet is set up and the data is in, the math is refreshingly simple. First, you'll sum up all the money you received. That means adding together the annual net cash flows, any capital events, and the net sale proceeds. This sum is your Total Cash Distributions.
Then, you just divide that total by your initial investment. Since you entered the investment as a negative number, you'll want to use its absolute value for the division. The answer is your equity multiple.
Pro Tip: In your spreadsheet, use the
=SUM()function to add up all your incoming cash. To handle the initial investment, use the=ABS()function to turn it into a positive number for the division. A finished formula might look like=SUM(C3:G5)/ABS(B2), depending on your cell layout.
If you enjoy the process of creating financial models, you might find some crossover techniques in guides on building a Total Addressable Market calculator. But if you'd rather grab a pre-built tool and get straight to analyzing deals, check out our guide on using a rental property calculator in Excel.
Understanding Equity Multiple vs. IRR and Cash-on-Cash
No single metric can tell you the whole story about a real estate deal. To really get a feel for an investment's potential, you have to look at it from a few different angles. The equity multiple is fantastic for the big-picture, total return story, but it’s most powerful when you use it alongside two other heavy hitters: the Internal Rate of Return (IRR) and Cash-on-Cash Return.
Think of these three as different lenses for looking at the same property. Each one highlights a unique—and equally important—aspect of the deal’s performance. Using them together gives you a much more balanced and complete view, preventing you from getting blindsided by focusing on just one number.
Where Each Metric Shines
The main difference between these metrics is what they prioritize. The equity multiple is all about the total amount of cash you get back compared to what you put in. It doesn't care if a deal takes two years or ten; it only measures the final score. A 2.0x multiple is a 2.0x multiple, period.
The Internal Rate of Return (IRR), on the other hand, is obsessed with time. It calculates the annualized rate of return on your investment, putting a heavy emphasis on cash flows you receive earlier in the holding period. This makes it extremely sensitive to the timing of your returns. For a deeper dive, check out our guide on how to calculate the internal rate of return for real estate.
Finally, you have Cash-on-Cash Return, which gives you a simple, yearly snapshot of performance. It tells you how much pre-tax cash flow you’re pocketing in a given year relative to the total cash you’ve invested. It’s perfect for gauging immediate income but completely ignores future appreciation or the profit you’ll make from the sale.
An easy way I remember it: Equity Multiple is about how much profit, IRR is about how fast you earn it, and Cash-on-Cash is about how much you’re earning right now.
Comparing Key Real Estate Investment Metrics
Looking at these metrics side-by-side really helps clarify their individual strengths and weaknesses. Here’s a quick breakdown to help you see how they fit together.
| Metric | What It Measures | Primary Pro | Primary Con |
|---|---|---|---|
| Equity Multiple | The total cash returned on your total cash invested over the entire hold period. | Simple, intuitive, and captures the complete return from start to finish. | Ignores the time value of money—a 2.0x return in 3 years is treated the same as 2.0x in 10 years. |
| IRR | The annualized, time-weighted percentage return on your investment. | Accounts for the time value of money, rewarding deals that return capital faster. | Can be more complex to calculate and may mislead if cash flows are irregular. |
| Cash-on-Cash | The annual pre-tax cash flow as a percentage of your total initial investment. | Provides an easy-to-understand snapshot of a property's yearly cash flow performance. | Ignores loan amortization, tax benefits, and appreciation—missing the total return picture. |
At the end of the day, a savvy investor never relies on just one number. You use the equity multiple to confirm the deal's total profit potential, the IRR to check how efficiently you’ll earn that return, and the cash-on-cash return to verify its performance year-over-year. This approach gives you a complete, 360-degree understanding of any deal that comes across your desk.
Common Questions About Equity Multiple
Even after you've got the formula down and walked through a few examples, some questions always seem to pop up when investors start running the numbers on their own deals. Nailing these details is crucial if you want to use the equity multiple with real confidence. Let's clear up the most common sticking points I hear all the time.
What Is a Good Equity Multiple in Real Estate?
This is the big one, and the honest answer is, "it depends." What's considered "good" is completely tied to your strategy, how much risk you're taking on, and how long you plan to hold the property.
- For something like a high-risk, short-term flip or a major value-add project, you should be targeting a 2.0x multiple or even higher over a 3-5 year period. Hitting that mark means you've successfully doubled your money.
- On the other hand, for a stable, lower-risk asset like a turnkey rental, a multiple of 1.5x to 1.8x over a longer 7-10 year hold is generally considered a very solid return.
The key thing to remember is that the multiple is meaningless without context. A 2.0x return in three years is a home run. That same 2.0x over ten years? Much less impressive. It might even mean you could have done better elsewhere.
Does Equity Multiple Factor in Debt and Leverage?
Yes, it does, and frankly, this is one of its biggest strengths. The "Total Equity Invested" part of the formula is strictly your own cash—the money you personally put in for the down payment, closing costs, and any upfront repairs. The loan from the bank is completely excluded.
Likewise, all your cash flow is calculated after the mortgage payment has been made. Because of this, the equity multiple does a fantastic job of showing how well you're using other people's money (leverage) to boost the return on your actual cash investment. It's a measure of your capital's performance, not the bank's.
Can Your Equity Multiple Be Less Than 1.0x?
It absolutely can, though it’s the outcome every investor works hard to avoid. An equity multiple below 1.0x means you lost money. Plain and simple.
For example, a 0.8x multiple means for every dollar you put in, you only got 80 cents back. This happens when your total cash flow plus the money you get from selling the property isn't enough to cover what you originally invested, resulting in a loss of capital.
Stop drowning in spreadsheets and start making smarter, faster investment decisions. Property Scout 360 automates these complex calculations, giving you instant access to equity multiple, IRR, cash-on-cash return, and 30-year projections for any U.S. property. Find your next profitable investment today at PropertyScout360.com.
About the Author
Related Articles
2026 Investor's Guide: Cost of Installing a Sewer Clean Out
Understand the cost of installing a sewer clean out for investment properties in 2026. Get expert advice on prices, ROI, & budgeting for flips. Plan smart!
15 Year vs 30 Year Mortgage: The Investor's Choice
Deciding between a 15 year vs 30 year mortgage for a rental property? Our guide analyzes cash flow, ROI, and equity to help you pick the best loan.
Real Estate Appraisal Software: Features & Limits
Discover what real estate appraisal software is, its core features, and limits. See how it differs from investment tools for profitable deals.