Mastering Rental Property Cash Flow Analysis for Profit
A complete guide to rental property cash flow analysis. Learn to calculate NOI, cash-on-cash return, and find profitable real estate deals with confidence.
If you want to succeed in real estate investing for the long haul, mastering cash flow analysis isn't just important—it's everything. It's the process of figuring out your actual profit by subtracting all your operating expenses and mortgage payments from the income a property generates. This is the only way to know for sure if a potential investment will be a money-maker or a money pit.
Why Cash Flow Is the Engine of Real Estate Investing
It’s easy for new investors to get fixated on appreciation—the hope that a property's value will shoot through the roof. They'll chase properties in hot markets, even if it means losing a little money each month, all while betting on a huge payday down the road. That isn’t investing; it’s speculation. You're essentially gambling on market trends you have zero control over.
I’ve seen this play out many times. Think of someone who bought a trendy condo back in 2021, convinced its value would double. When interest rates jumped and the market went sideways, they were left holding a property that was bleeding cash every month, with no easy way out. Their "investment" quickly turned into a liability.
The Business of Predictable Income
Smart, experienced investors, on the other hand, treat their portfolios like a business. For them, cash flow is the key metric of success. Their entire strategy revolves around buying properties that produce a steady, predictable income from the very first day. That monthly surplus is the engine that keeps the whole portfolio running.
If you need a refresher on the basics, our guide on what is cash flow in real estate is a great place to start.
Having positive cash flow gives you a crucial safety net. When a water heater suddenly dies or a tenant leaves unexpectedly, the property’s own income is there to cover the hit. An investor who was banking on appreciation would be digging into their personal savings to pay those bills.
"Appreciation is the icing on the cake, but cash flow is the cake itself. You can survive without the icing, but you can't build a portfolio on it."
This business-first mindset is what makes your investments resilient. They can handle economic slumps, rising interest rates, and surprise repairs without causing you financial stress. It’s the fundamental difference between owning a self-sustaining asset and a financial burden that relies on wishful thinking. A property that pays you every month is how you build wealth systematically and reliably.
Eliminating Guesswork with Modern Tools
Not too long ago, running these numbers meant building complicated spreadsheets that were a nightmare to manage and prone to errors. I remember spending hours just plugging in numbers and double-checking formulas, knowing one small mistake could cost me thousands.
Thankfully, those days are over.
Modern platforms like Property Scout 360 are built to take the guesswork out of the equation. They automate all the heavy lifting and complex calculations we're about to cover, which lets you focus on making the right decision. With a tool like this, you can:
- Instantly calculate NOI and cash flow: Just enter the property details and get accurate financial projections in seconds.
- Model financing scenarios: Easily compare how different down payments, interest rates, and loan terms affect your returns.
- Stress-test your investment: See how the deal holds up by tweaking variables like vacancy rates or repair costs.
By using these tools, you can analyze dozens of deals in the time it used to take to analyze one. This guide will walk you through how to do the math by hand so you understand what's happening behind the scenes. But once you've got that down, modern tools are what will let you apply that knowledge at scale to find great investments faster.
Gathering the Right Data for Your Analysis

Any rental property cash flow analysis lives and dies by the quality of the numbers you plug into it. Garbage in, garbage out. To build a truly bulletproof financial model, you have to dig much deeper than just the asking price and a Zillow rent estimate.
This is about uncovering the real cost of ownership, not just the obvious bills. We're turning a hopeful guess into a reliable projection by getting the data right from the start.
Identifying Your Fixed Costs
Let's start with the easy stuff: your fixed costs. These are the predictable, recurring expenses you can count on paying month after month, year after year. They're the non-negotiable line items in your budget.
Here’s what you need to nail down first:
- Purchase Price & Closing Costs: Don't stop at the price of the home. You need to account for appraisal fees, inspections, title insurance, and all the other little closing table surprises. These are crucial for calculating your true initial investment.
- Property Taxes: Never, ever trust the seller's old tax bill. A sale almost always triggers a reassessment by the local tax office, which can jack up this expense significantly. Get the real number.
- Homeowners Insurance: It's time to get some actual quotes. Premiums can swing wildly depending on the property's location, age, and the coverage you choose.
- HOA or Condo Dues: If the property is in an association, get the exact monthly or annual fee. You should also ask if they have any special assessments planned for big projects—that’s a cash flow killer waiting to happen.
Getting these figures right is the first step toward an accurate calculation. They form the stable foundation of your entire analysis.
The goal is to build a financial model based on reality, not optimism. Every dollar you fail to account for here is a dollar that comes directly out of your future profit.
Budgeting for Variable Expenses
This is where so many new investors get burned. Variable expenses are the costs that fluctuate, and they can absolutely wreck your budget if you aren't planning for them conservatively. This is the reality of being a landlord.
Your analysis has to include solid, real-world estimates for these costs:
- Vacancy Rate: I've never seen a property stay occupied 100% of the time. A conservative vacancy estimate is non-negotiable. I always budget for 5-10% vacancy, which works out to about one month of lost rent per year. It's a smart industry standard.
- Property Management Fees: Even if you plan to self-manage, put this fee in your analysis. Why? Because things change. If you have to hire a pro later, you want to know the deal still works. A typical fee is 8-10% of the monthly rent.
- Routine Maintenance & Repairs: This is for the small stuff—a leaky faucet, a running toilet, a broken doorknob. A good rule of thumb is to budget at least 1% of the property's value annually for these ongoing fixes.
When you're pulling your numbers together, you have to account for all potential upkeep. This rental property maintenance checklist is a great resource for understanding what's involved in managing these costs.
Planning for Major Capital Expenditures
Finally, we need to talk about Capital Expenditures, or CapEx. This is a critical distinction many people miss. Maintenance fixes things, but CapEx replaces them. This requires a completely different savings strategy.
Patching a few shingles after a storm is a maintenance repair. Replacing the entire 20-year-old roof for thousands of dollars is a major CapEx event. The same goes for the HVAC system, water heater, and major appliances.
You need a separate reserve fund just for these big-ticket items. I recommend setting aside an additional 5-10% of your gross rental income specifically for future CapEx. This buffer is what protects your cash flow from getting completely wiped out by a single, predictable system failure. A good rental property spreadsheet for analysis can be a huge help in keeping these numbers organized.
Calculating Net Operating Income: The Core of Your Property's Profitability
Once you’ve gathered all your income and expense numbers, it’s time to calculate the single most important metric for any rental property: Net Operating Income (NOI). Think of NOI as the property's pure, unleveraged profit.
NOI is simply your total rental income minus all of your operating expenses. Critically, this calculation is done before you factor in your mortgage payment. This is a vital distinction because it separates the property's financial performance from your personal financing decisions. It tells you exactly how profitable the asset is on its own, which is the only way to make a true apples-to-apples comparison between different investment opportunities.
Putting the NOI Formula to Work
The formula itself is pretty simple: NOI = Effective Gross Income - Operating Expenses.
Let’s run the numbers with a real-world example. Imagine you're looking at a duplex where each unit rents for $1,500 a month. That gives you a Gross Potential Rent of $3,000 monthly, or $36,000 for the year.
First, we have to account for reality—vacancies happen. Using a conservative 7% vacancy rate, we’ll subtract $2,520 from that gross rent. This leaves us with an Effective Gross Income (EGI) of $33,480.
Next up are the operating expenses. For this duplex, they break down like this:
- Property Taxes: $4,000/year
- Insurance: $1,500/year
- Property Management (8% of EGI): $2,678/year
- Maintenance & Repairs (5% of EGI): $1,674/year
- CapEx Reserves (5% of EGI): $1,674/year
Add those all up, and you get total operating expenses of $11,526.
Now for the final step. We take our income and subtract our expenses:
$33,480 (EGI) - $11,526 (Expenses) = $21,954 (Annual NOI)
That $21,954 is the key figure. It’s what the property earns in a year before you pay the bank. This is the foundational number you'll use for every other calculation in your analysis.
This NOI metric is your ultimate benchmark. A duplex in a high-yield market might have a much higher NOI relative to its price than a similar property in an expensive coastal city. That difference instantly signals which one is likely the stronger cash-flowing asset.
Why NOI Is Such a Powerful Comparison Tool
The real magic of NOI is that it cuts through the noise of financing.
Let’s say you're comparing our duplex to another property. Maybe you’re planning to put 20% down, while another investor is buying a similar property with all cash. Your personal financing choices will absolutely change your monthly cash flow, but they don't change the property's fundamental profitability. The NOI stays the same for both of you.
This is a huge deal when you realize how different markets perform. Between 2012 and 2022, for example, single-family rentals in secondary markets often saw gross rental yields of 7–10%, while prime coastal areas were stuck around 4–6%. An investor who zeroed in on high-yield markets like Cleveland or Memphis could achieve incredible cash-on-cash returns by using a mortgage, but it all started with finding properties that had a strong underlying NOI. You can dig deeper into how market selection impacts rental returns on RentalIncomeAdvisors.com.
Ditch the Manual Math, Speed Up Your Analysis
While doing these calculations by hand is the best way to really understand the mechanics, it gets old fast. It's slow and easy to make a mistake, especially when you’re trying to vet a dozen deals before someone else snags them.
This is where a dedicated tool becomes a total game-changer.
Platforms like Property Scout 360 are built to do this heavy lifting for you. You plug in the property’s details, and the software spits out an accurate NOI and a full financial breakdown in seconds.
This screenshot shows exactly how Property Scout 360 presents this information.
You can see how it clearly separates the income from all the itemized expenses to generate the NOI. This frees you up to focus on making smart decisions instead of getting bogged down in spreadsheet formulas.
Finding Your True Cash Flow and Key Performance Metrics
You've done the hard work to calculate your Net Operating Income (NOI), giving you a solid grasp of the property's profitability before the mortgage. But let's be honest, the number that really matters is the one that hits your bank account each month.
Now, we get to the heart of it: figuring out your actual pre-tax cash flow.
It's a refreshingly simple calculation. You just take your NOI and subtract the total annual cost of your mortgage, which is known as your debt service. What's left is the real profit—the money you can pocket, reinvest, or use to build your portfolio.
This diagram helps visualize how we boil everything down to that essential NOI figure.
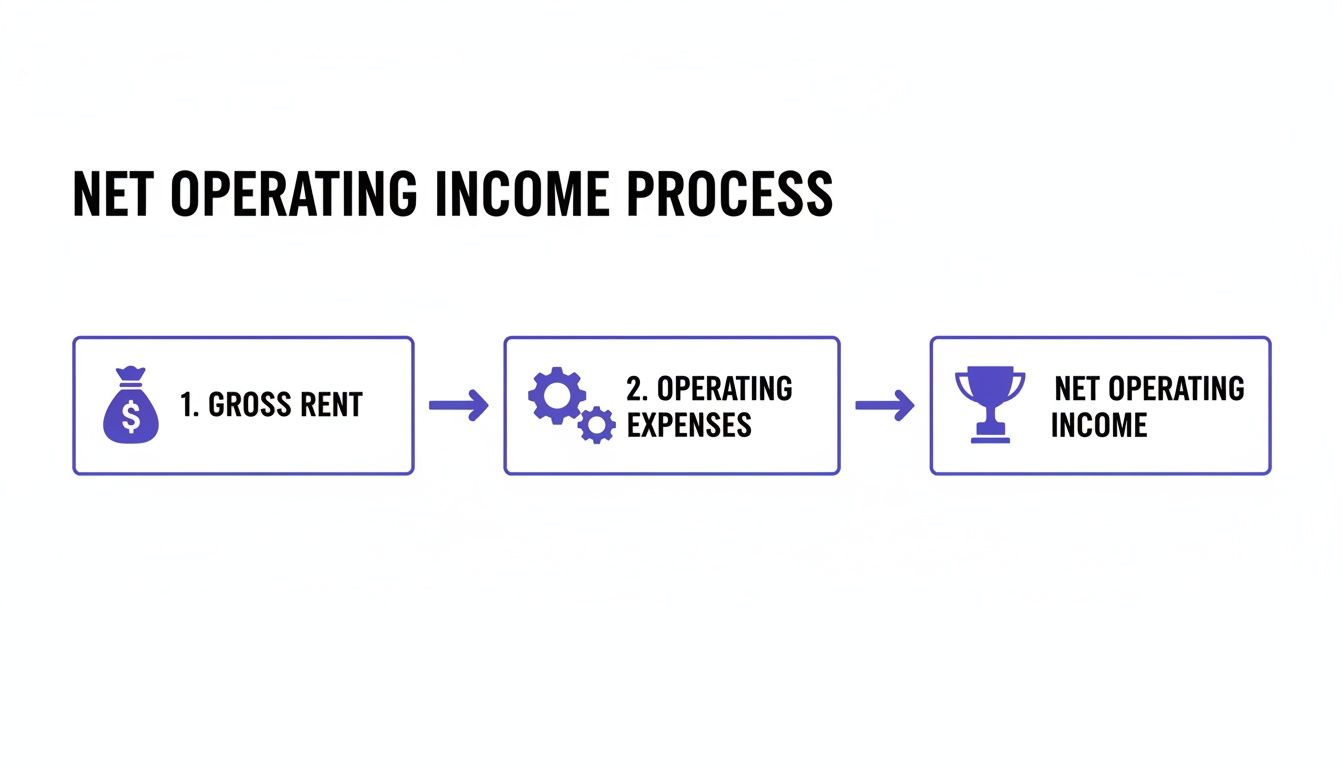
Think of NOI as the engine of your investment. It’s what the property earns based on its own merit, separate from how you choose to finance it.
From NOI to Monthly Cash in Your Pocket
Let's pick back up with our duplex example. We already established it has an annual NOI of $21,954.
Now we introduce the financing. Let's say you landed a loan with an annual debt service of $16,800. That breaks down to a $1,400 monthly payment for principal and interest. The math is straightforward:
$21,954 (NOI) - $16,800 (Debt Service) = $5,154 Annual Cash Flow
That works out to $429.50 per month in positive cash flow. This isn't just a number on a spreadsheet; it's the real cash surplus you have after all the bills—including the big one, the mortgage—are paid.
Measuring Performance with Cash-on-Cash Return
Okay, so the property cash flows. But is it a good investment? This is where the Cash-on-Cash (CoC) Return comes in. I love this metric because it cuts right to the chase: how hard is the money I put in actually working for me?
CoC Return measures your annual cash flow against the total cash you paid out of pocket to buy the property.
- The Formula: Annual Cash Flow ÷ Total Cash Invested
Let's stick with the duplex. The purchase price was $400,000. You made a 20% down payment ($80,000) and had $5,000 in closing costs. That means your total cash invested was $85,000.
Here’s how it shakes out:
$5,154 (Annual Cash Flow) ÷ $85,000 (Total Cash Invested) = 6.06%
A 6.06% CoC return gives you a clear benchmark. Is it good? That depends entirely on your personal goals and the market you're in. Many investors I know shoot for 8-12%, but in a hot market with high appreciation potential, you might be perfectly happy with a lower initial return. To dig deeper, check out our complete guide on the investment property ROI calculator.
Gauging Your Risk with the Break-Even Ratio
Another metric I never skip is the Break-Even Ratio (BER). This tells you what percentage of your potential income is needed just to cover all your expenses, mortgage included. It’s a fantastic gut-check for a property's risk level.
- The Formula: (Operating Expenses + Debt Service) ÷ Gross Potential Income
Let’s run the numbers for our duplex again:
($11,526 OpEx + $16,800 Debt Service) ÷ $36,000 Gross Income = 0.787 or 78.7%
This means you need the property to generate 78.7% of its potential income just to break even. Personally, I like to see this number as low as possible because it signals a wider margin for error. A property with a 95% BER? That’s a high-wire act. One long vacancy, and you're funding the shortfall yourself.
Key Takeaway: These metrics—Cash Flow, CoC Return, and BER—are what separate amateur investors from pros. They take you beyond a simple "does it make money?" question and help you truly understand the relationship between risk and reward for any deal you're considering.
A Tale of Two Properties
Numbers on their own can feel abstract. Let's look at a side-by-side comparison to see how these metrics reveal the better investment, even when the purchase prices are identical.
Comparative Cash Flow Analysis Property A vs Property B
| Metric | Property A (High Yield) | Property B (Low Yield) |
|---|---|---|
| Purchase Price | $400,000 | $400,000 |
| Gross Potential Rent | $36,000 / year | $30,000 / year |
| Operating Expenses | $11,526 | $12,000 |
| Net Operating Income (NOI) | $24,474 | $18,000 |
| Annual Debt Service | $16,800 | $16,800 |
| Annual Cash Flow | $7,674 | $1,200 |
| Total Cash Invested | $85,000 | $85,000 |
| Cash-on-Cash Return | 9.03% | 1.41% |
| Break-Even Ratio | 78.7% | 96.0% |
As you can see, even with the same purchase price and financing, Property A is the clear winner. It generates over 6x the cash flow and has a much healthier break-even point, making it a far safer and more profitable investment. This is exactly why you can't just look at the price tag.
How to Stress-Test Your Investment for a Reality Check

A positive rental property cash flow analysis based on perfect conditions is a recipe for disaster. I've seen it happen too many times. The real world is messy, and your investment needs to be resilient enough to handle it. Stress-testing is how you do that—it's the process of intentionally poking holes in your numbers to see how the deal holds up when things inevitably go wrong.
It’s all about asking the tough "what if" questions before you sign on the dotted line. What if interest rates tick up? What if it takes three months to find a good tenant? What if the HVAC unit gives out in the dead of winter? A deal that looks great on paper can crumble under the slightest pressure if the margins are razor-thin.
Modeling the Impact of Financing Changes
Financing is the single biggest variable that can make or break an investment. A small shift in your interest rate or a change in your down payment can have a massive impact on your monthly debt service and, consequently, your cash flow. This is where you need to be particularly ruthless in your stress test.
A detailed cash-flow analysis is more critical than ever, especially since the post-2022 interest-rate shock. For a typical investor using a 30-year mortgage, a rate increase from 4% to 7% on a $300,000 loan boosts the monthly principal-and-interest payment from about $1,432 to $1,996. That 39% jump can completely erase your projected cash flow, shifting the focus from speculative growth to solid, rent-driven returns. You can explore more insights on how these global financing trends impact real estate on PWC.com.
Let's put this into practice. Imagine you analyze a property assuming a 6% interest rate, and it cash flows $300 per month. That seems decent. But what happens if rates climb to 7% before you lock in your loan?
Suddenly, your monthly mortgage payment jumps by $150. Your once-healthy cash flow is now slashed in half. This simple 1% shift has dramatically increased the risk profile of the entire investment.
This is exactly why you must run multiple financing scenarios. Don't just analyze your ideal loan; model the worst-case scenario to see if the deal still makes sense.
Simulating Vacancy and Unexpected Repairs
Beyond financing, your property's day-to-day operations are the next area to pressure test. Two of the most common cash flow killers are higher-than-expected vacancy and a sudden major repair. Your initial analysis should already include reserves for both, but a stress test pushes those assumptions to their limits.
What happens if the local job market takes a hit and your vacancy rate jumps from 5% to 15% for a year? How does that impact your bottom line?
Let’s model a nightmare scenario. Imagine in a single year you face:
- Three months of vacancy: Your gross income for the year is immediately slashed by 25%.
- An HVAC failure: A sudden, unplanned $7,000 expense hits your books.
A fragile investment will be instantly pushed into the red, forcing you to feed it money from your own pocket just to stay afloat. A strong investment, however, will have built-in buffers—like a healthy break-even ratio and robust CapEx reserves—that allow it to absorb these hits without causing a financial crisis.
Using Technology to Analyze Risk Efficiently
Manually running dozens of these "what if" scenarios in a spreadsheet is tedious and a great way to make a costly mistake. This is where modern analysis tools become indispensable for any serious investor looking to perform a thorough rental property cash flow analysis.
Platforms like Property Scout 360 are designed for exactly this. You can instantly adjust variables like the interest rate, down payment, vacancy rate, or repair costs and see the impact on your cash flow and returns in real-time.
Instead of spending hours wrestling with formulas, you can:
- Model a 1% and 2% increase in your mortgage rate.
- Simulate a 10% and 20% vacancy scenario.
- Add a $10,000 surprise CapEx expense to see if the property can handle it.
Running these simulations takes minutes, not hours. This gives you a complete risk profile of the property and shows you exactly where its breaking points are. It's about getting the data-driven confidence you need to either move forward on a resilient deal or walk away from one that's too fragile to withstand real-world challenges.
Diving Deeper: Your Top Cash Flow Questions Answered
Even when you've got the formulas down, real-world questions always creep in during a rental property analysis. These are the practical, "what-if" scenarios that can bring your decision-making to a screeching halt. Let's get these common uncertainties sorted out so you can move forward with confidence.
These aren't just academic questions; they get to the heart of what makes a good investment, from setting the right expectations to knowing the difference between cash in your pocket and profit on paper.
What’s a Good Cash-on-Cash Return for a Rental Property?
Everyone wants a magic number, but the truth is, it depends. Many experienced investors I know won't touch a deal unless it projects an 8-12% Cash-on-Cash (CoC) return or higher. But that target is completely tied to the market and your personal strategy.
For example, an investor in a hot, high-growth market like Austin might feel great about a lower 4% CoC return. They're not just buying for monthly income; they're betting on a big payday from appreciation down the road. On the other hand, someone investing in a stable Midwest market that’s all about income might see 10% as the bare minimum to even look at a property.
Here's a great gut check: compare the property's potential CoC return to what you could get from a more passive investment, like an S&P 500 index fund. If the rental doesn’t offer a significantly better return for all the hands-on effort and risk involved, it’s a big red flag.
How Do I Really Estimate Repair and Maintenance Costs?
This is where so many new investors get burned. You’ve probably heard of the "1% Rule," which says to budget 1% of the purchase price for annual maintenance (so, $3,000 a year for a $300,000 house). The "5% of Rent Rule" is another popular one.
While they’re decent starting points, they’re far from precise. A much better approach is to look at the specific age and condition of the property's major systems. A five-year-old home with a new HVAC system will have a completely different maintenance budget than a 50-year-old house with its original roof and furnace.
My best advice? Get a thorough home inspection before you buy. The inspector's report is a goldmine. It will estimate the remaining life of the big-ticket items, letting you build a real-world budget for Capital Expenditures (CapEx), not just small-fry repairs.
What's the Difference Between Cash Flow and Profit?
This is a critical distinction that trips people up, but it's essential for any serious investor. They are not the same thing, and confusing them has huge financial consequences.
- Pre-Tax Cash Flow: This is the actual cash left in your bank account after you’ve collected rent and paid all the operating bills, including the mortgage. It’s a direct measure of your property’s short-term financial health.
- Profit (Net Income): This is a formal accounting number. It’s what’s left after you subtract non-cash expenses—most importantly, depreciation—from your Net Operating Income.
Because depreciation is a major tax deduction, it’s very common to have a property that’s putting positive cash in your pocket every month but shows a net loss on your tax return. This "phantom loss" is one of the most powerful tax advantages of real estate. You need cash flow to survive, but you need to understand profit for tax season.
Can a Negative Cash Flow Property Ever Be a Good Investment?
Yes, technically. But it’s an advanced, high-risk strategy that I wouldn't recommend for most investors. This approach is a pure gamble on market appreciation, forcing you to feed the property with your own money every single month just to cover the shortfall.
You typically see this strategy in hyper-expensive coastal markets where sky-high prices make positive cash flow almost impossible from the start. The danger is immense. If the market goes flat or, worse, declines, you're stuck with an asset that's actively draining your savings.
For 99% of investors, the golden rule should be to invest for positive cash flow from day one. Let appreciation be the icing on the cake, not the whole cake. A cash-flowing property can weather a market storm; a negative cash flow property usually can't.
Ready to run these numbers without the headache? Property Scout 360 gives you instant, accurate cash flow projections, CoC returns, and break-even analysis for any U.S. property. Try it for free and make your next investment decision with data-driven confidence.
About the Author
Related Articles
2026 Investor's Guide: Cost of Installing a Sewer Clean Out
Understand the cost of installing a sewer clean out for investment properties in 2026. Get expert advice on prices, ROI, & budgeting for flips. Plan smart!
15 Year vs 30 Year Mortgage: The Investor's Choice
Deciding between a 15 year vs 30 year mortgage for a rental property? Our guide analyzes cash flow, ROI, and equity to help you pick the best loan.
Real Estate Appraisal Software: Features & Limits
Discover what real estate appraisal software is, its core features, and limits. See how it differs from investment tools for profitable deals.