Mastering Real Estate Profits with Cap Rate and NOI
Unlock property investment success with our guide to cap rate and NOI. Learn to calculate these key metrics and make smarter, data-driven decisions.
Before you even start scrolling through property listings, you need to learn the language of real estate profit. Two terms stand out above all others: Net Operating Income (NOI) and the Capitalization Rate (Cap Rate).
Think of it this way: NOI is the purest measure of a property's own ability to make money, before any loans are factored in. The cap rate, on the other hand, tells you what that return looks like compared to its market price.
Your Foundation for Smart Property Investing
Getting a solid grip on how NOI and cap rates work together is the first real step toward making smart, data-backed investment choices. These numbers let you peel back the layers of curb appeal and asking prices to see a property's true financial engine. They give you a standard ruler to measure totally different opportunities, making sure you’re always comparing apples to apples.
It’s like popping the hood before buying a car. You wouldn't buy a flashy convertible just because you like the color, right? You'd want to know about its horsepower and gas mileage. NOI and the cap rate are the real estate equivalents—they tell you about the property's financial horsepower and efficiency.
For any serious investor, mastering these two metrics isn't optional. They are the core numbers that tell you if a deal is priced right, makes enough money, and actually fits your goals.
Why These Metrics Matter So Much
When you learn to speak the language of NOI and cap rates, you shift from being a simple buyer to a strategic investor. You stop guessing and start calculating. Here’s what you unlock by focusing on the numbers first:
- Objective Comparisons: You can finally compare that downtown condo to a suburban duplex on a level playing field, even if their rents and prices are worlds apart. The cap rate is the great equalizer.
- Quick Risk Assessment: A cap rate can be a quick gut check for risk. A suspiciously high rate might be a red flag for hidden problems, while an extremely low one could mean you're looking at an overpriced property with little room to grow.
- Sharp Valuation Insight: Once you know the typical cap rate for a neighborhood, you can use a property's NOI to work backward and estimate its real market value. This is how you find those underpriced gems others miss.
- Accurate Profit Forecasting: NOI is the starting block for every other calculation you’ll run. It’s the essential first step for figuring out your actual cash flow, return on investment (ROI), and long-term financial picture.
For a quick reference, here’s a simple breakdown of these two powerhouse metrics.
NOI and Cap Rate at a Glance
| Metric | What It Measures | Simple Formula | Primary Use |
|---|---|---|---|
| NOI | A property's profitability before mortgage & taxes | Revenue - Operating Expenses | To assess the raw income-generating power of an asset |
| Cap Rate | The rate of return based on the property's income | NOI / Property Value | To quickly compare investment opportunities and gauge risk |
This table provides a snapshot, but truly understanding how to apply these numbers is where the real advantage lies.
To keep building on this foundation, it's always smart to dig into more investor-focused advice that can shape your strategy. By putting in the work to understand these core concepts, you'll be able to analyze deals with confidence and build a portfolio that stands the test of time.
Calculating Net Operating Income the Right Way
Before you can even think about a property’s potential, you have to get a handle on its Net Operating Income (NOI). I like to think of NOI as the property's true annual profit from its day-to-day business—before things like your mortgage, income taxes, or depreciation come into play. It’s the pure, unvarnished number that tells you if the asset itself is a money-maker.
The formula looks simple: Gross Operating Income minus Operating Expenses. But as any seasoned investor knows, the devil is in the details. Getting those details right is what separates a smart buy from a financial headache.
Tallying Up the Income
First, let's nail down what actually counts as income. It’s more than just the rent you collect each month. You need to account for all the money the property brings in.
- Gross Potential Rent: This is your starting point—the absolute maximum rent you could collect if every single unit was rented out for the entire year at full market value.
- Vacancy Loss: Now for a dose of reality. No property stays 100% occupied forever. You have to subtract a realistic amount for the income you'll lose when units are empty between tenants.
- Other Income: Don't forget the miscellaneous revenue streams. This could be anything from coin-operated laundry machines and parking fees to pet fees or late charges.
Add it all up—Gross Potential Rent, minus your vacancy loss, plus that "other income"—and you get your Gross Operating Income (GOI). This is a much more realistic picture of your property's earning power.
Identifying True Operating Expenses
Next up, you subtract the costs of keeping the lights on and the property running smoothly. These are the necessary, recurring expenses tied directly to operating the asset.
An accurate NOI calculation is the beating heart of any good property analysis. Get your NOI wrong, and every other calculation that follows, including your cap rate, will be completely off base. It’s a house of cards—if the foundation is shaky, the whole thing comes crashing down.
This flow chart really drives home how one metric builds directly on the next. You can't get to a reliable cap rate without first calculating a solid, defensible NOI.
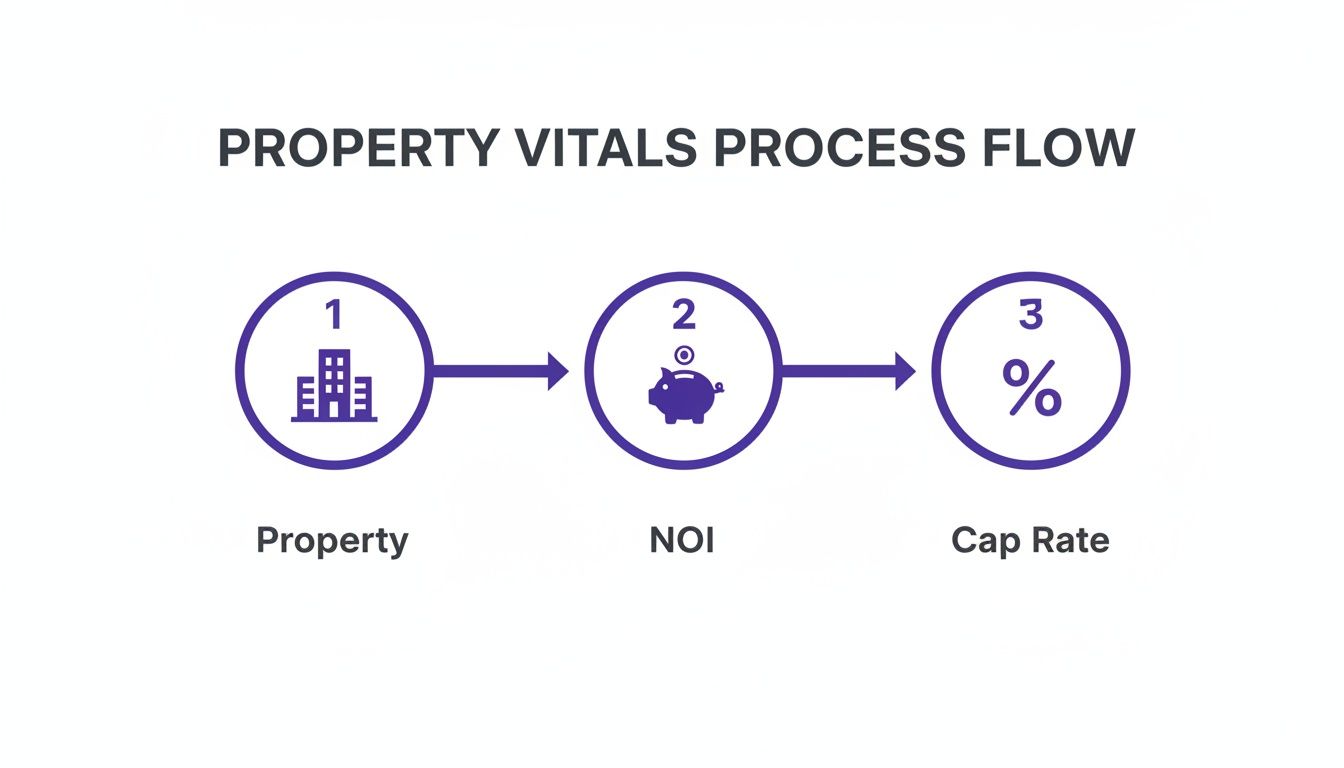
As you can see, it all starts with the property and flows logically toward the final investment metrics.
Common operating expenses to factor in include:
- Property Taxes
- Insurance Premiums
- Property Management Fees
- Routine Maintenance and Repairs
- Utilities (for common areas or if included in rent)
- Landscaping and Pest Control
What You Must Exclude From NOI
Knowing what not to include is just as critical. Certain expenses are tied to you, the investor, not the property's operational performance.
Things like your mortgage payments (principal and interest), income taxes, and major capital expenditures (like replacing a roof) are kept out of the NOI calculation.
Why? Because excluding these items lets you compare different properties on an even playing field. You can analyze Property A's performance against Property B's, regardless of how each one was financed or the owner's personal tax situation. If you want to dig deeper into the numbers that follow NOI, check out our complete guide on rental property cash flow analysis.
Remember, NOI is the engine that drives your cap rate. Understanding this relationship helps you make sense of market cycles. For example, during the real estate boom from 2003-2007, strong NOI growth combined with easy financing pushed cap rates down, which sent property values soaring. Knowing how these levers work is essential for navigating today's market.
What Is a Cap Rate and What Does It Tell You About a Deal?
Okay, so you've nailed down the Net Operating Income (NOI). Now it's time to meet its partner in crime: the Capitalization Rate, or cap rate for short.
If NOI is the engine of a property, think of the cap rate as its speedometer. It tells you how fast your investment is working for you relative to what you paid for it. It's a beautifully simple metric that gives you a quick snapshot of a deal's potential return and its underlying risk.
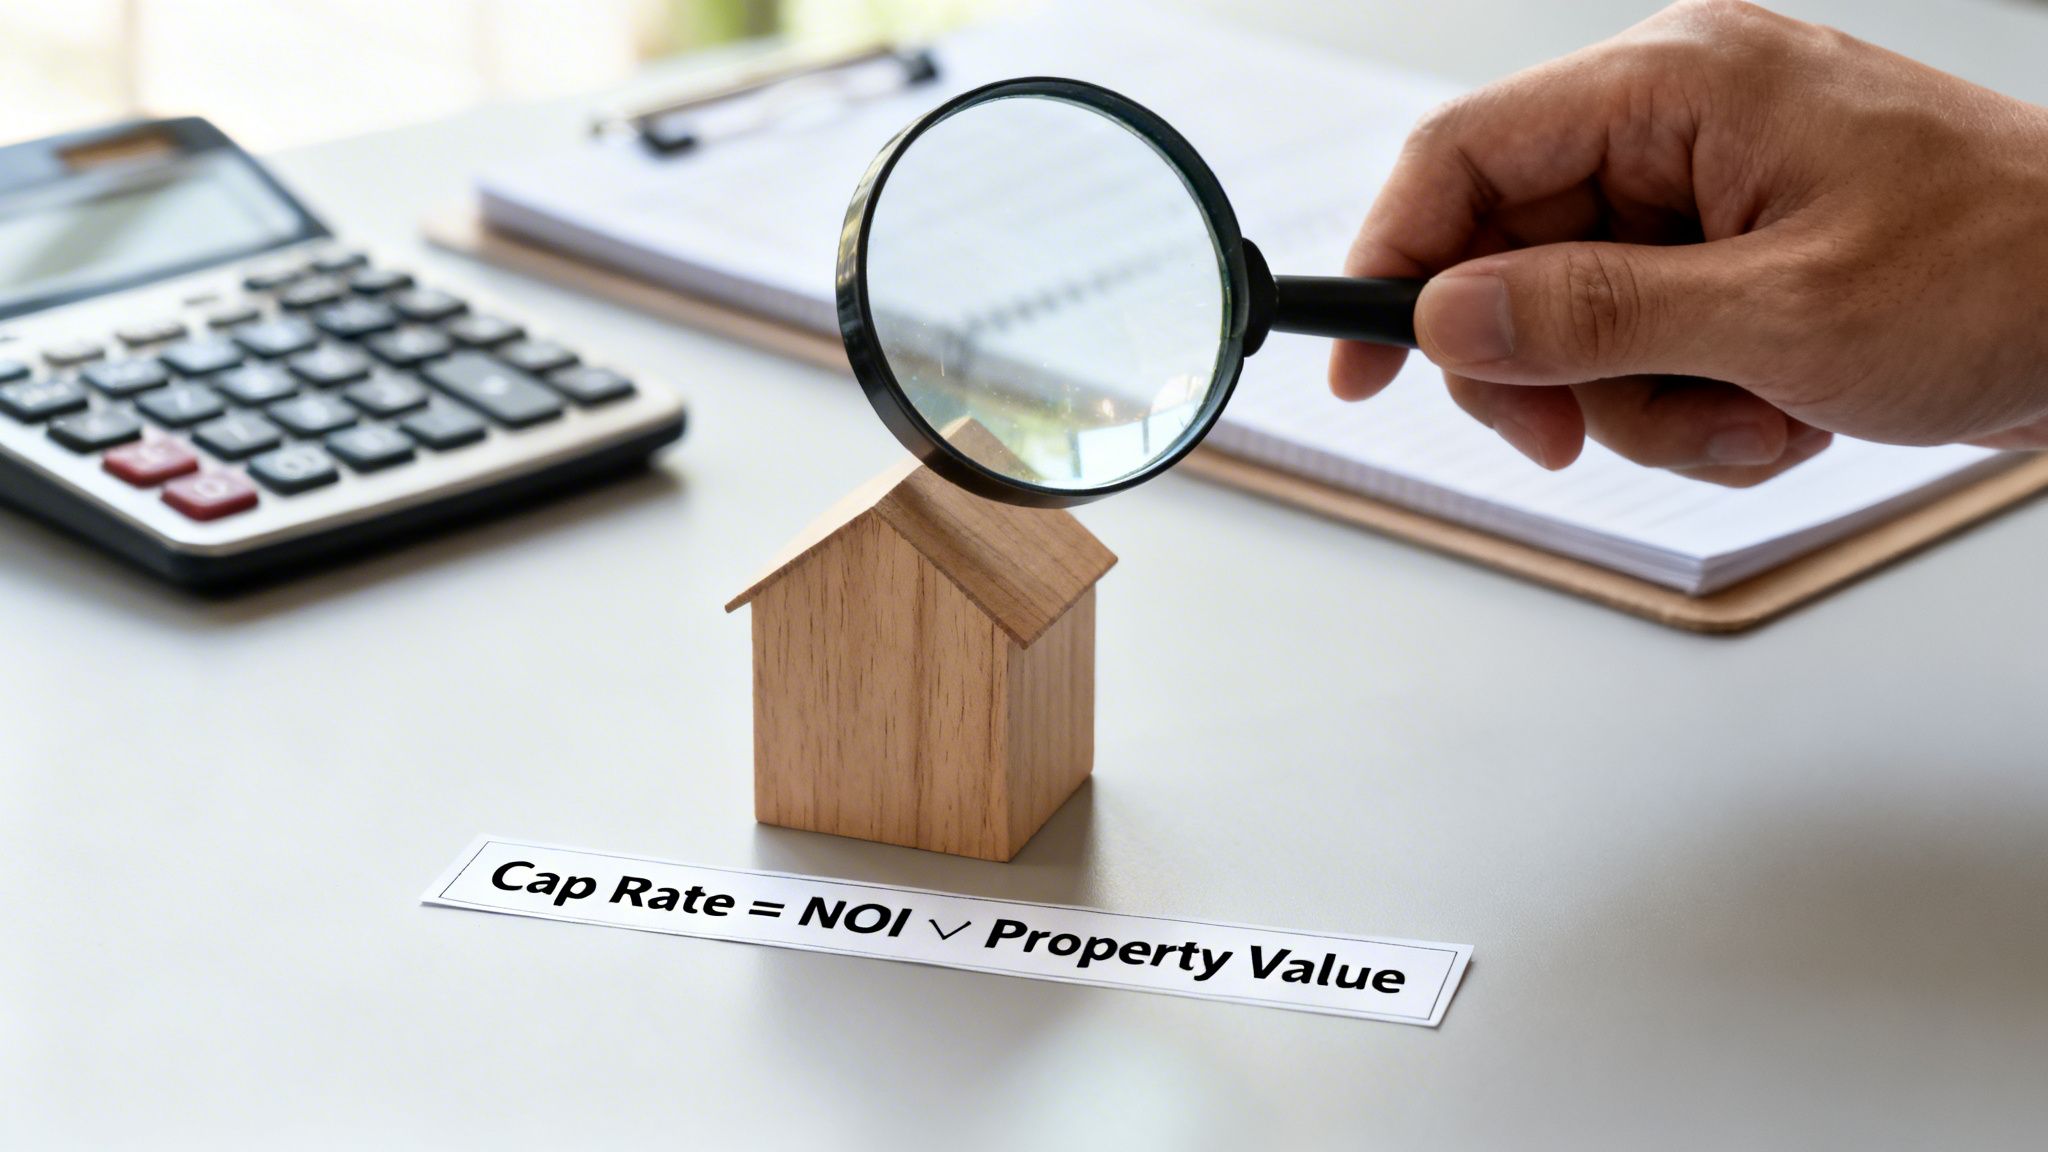
The formula itself couldn't be easier:
Cap Rate = Net Operating Income (NOI) / Current Market Value
Essentially, this is the raw, unleveraged rate of return you'd get if you bought the property with a suitcase full of cash. This is a big deal because it removes financing from the equation. By doing that, you can compare totally different properties—like a downtown condo and a suburban duplex—on a purely operational level. It answers the most basic question: "For every dollar I'm investing in the property's value, how much income is it kicking back to me?"
Reading Between the Lines: High vs. Low Cap Rates
Just getting a number isn't enough; you have to know what it means. Cap rates have an inverse relationship with the property's price and perceived risk. It's a seesaw.
- Low Cap Rates (think 4-5%): A low cap rate usually points to a safer, more expensive property in a hot, stable market. Investors are willing to pay a premium for that stability and predictable income, which pushes the price up and, in turn, the cap rate down. Imagine a pristine apartment building in a prime neighborhood—that's a low cap rate property.
- High Cap Rates (say, 8-10%+): On the flip side, a higher cap rate suggests you're getting a better return on your money, but it almost always comes with more risk. The property might be in a sketchier area, need a ton of work, or face an uncertain rental market. Investors demand a bigger potential payoff to compensate them for taking on that headache.
You can think of the cap rate as the market's gut feeling about the risk of a property's income stream. A low number means the market is betting on it being a sure thing. A high number signals that there are some question marks.
Let's Run the Numbers: A Real-World Example
Remember that small apartment building from our NOI example? We calculated its annual NOI to be a solid $55,000.
Now, let's say the seller is asking $1,000,000 for it. To find the cap rate, we just plug those numbers into our formula.
- Grab your NOI: $55,000
- Find the Property Value (or Purchase Price): $1,000,000
- Do the math: $55,000 / $1,000,000 = 0.055
To turn that decimal into a percentage, just multiply by 100. That gives us a cap rate of 5.5%.
This single number is your new best friend for comparing deals. If other buildings in that same neighborhood are selling at a 4.5% cap rate, you might have found a fantastic deal. But if the market average is closer to 6.5%, you'd better start digging to figure out why this property is lagging behind. Is it the location? The condition? Bad management? That's where the real detective work begins.
How Market Forces Shape Your Cap Rate
The relationship between cap rate and NOI isn't just simple math; it's a dynamic dance influenced by powerful market forces. A cap rate doesn't exist in a vacuum. It breathes with the economy, reacts to investor sentiment, and shifts with the cost of money, telling a story about risk and opportunity in the broader market.
Understanding these external pressures is critical. Why? Because the same exact property with the same NOI can have a wildly different cap rate—and therefore, a different valuation—from one year to the next. Key drivers like interest rates, local economic health, and overall investor demand are constantly pushing and pulling on this vital metric.
The Ebb and Flow of Market Cycles
Real estate markets move in cycles, and cap rates are one of the best indicators of where we are in that cycle. You'll often hear investors talk about these movements in two ways: compression and expansion.
Cap Rate Compression: This is what happens when investor demand is high and capital is cheap. More buyers are competing for the same assets, which naturally bids up prices. Since
Cap Rate = NOI / Price, as the price (the denominator) goes up while NOI stays the same, the cap rate gets squeezed downwards. This is a classic seller's market, where values are on the rise.Cap Rate Expansion: This is the other side of the coin. When interest rates rise or economic uncertainty makes investors nervous, demand cools off. With fewer buyers in the market, property prices might soften or even fall. If prices drop while the NOI holds steady, the cap rate expands (goes up). This often signals a buyer's market, where you might find better deals.
Think of cap rates as a barometer for investor confidence. When confidence is high and money is cheap, investors are willing to accept lower returns (compressed cap rates). When fear creeps in and borrowing gets expensive, they demand higher returns to compensate for taking on more risk (expanded cap rates).
Watching the Right Economic Signals
So, what are the big-picture indicators that cause these shifts? The most important one is the cost of borrowing, which is closely tied to the interest rates set by central banks. For commercial real estate, many seasoned investors benchmark their expected returns against the 10-year Treasury yield. This is often called the "risk-free" rate of return.
A real estate investment simply has to offer a higher return to justify its inherent risks—things like tenants leaving, unexpected repairs, or a downturn in the local market. The difference between a property's cap rate and the 10-year Treasury yield is known as the "spread." A healthy spread is what compensates an investor for taking on real estate risk.
Historical data tells a fascinating story here. Back in the early 2000s, you could find prime commercial properties with cap rates in the 8-10% range. But by 2006, a flood of cheap debt caused major cap rate compression, pushing rates down to 5-7%. More recently, in early 2022, with 10-year Treasury yields at 2.4%, cap rates hit a historic low of 4.1%. That squeezed the spread to a razor-thin 170 basis points (bps), signaling to savvy investors that the market might be overvalued. You can dig into more of this history on how cap rates react to market progress.
Putting Cap Rate and NOI to Work in Your Investments
Okay, you've got the formulas down. Now it's time for the fun part: putting your knowledge of cap rate and NOI to work in the real world. These aren't just numbers on a spreadsheet; they are powerful tools that help you make smarter, faster decisions when your money is on the line.
At their core, they help you do two critical things: figure out what a property is worth and compare different investment opportunities.
Using Cap Rate to Value a Property
One of the most powerful ways to use these metrics is to quickly estimate a property's market value. If you know the typical cap rate for similar properties in a neighborhood—what investors call "market cap"—you can work backward to see if a listing is priced fairly.
Just flip the formula around: Market Value = NOI / Cap Rate.
Let’s say you know that duplexes in a specific area are consistently selling at a 6% cap rate. You find a new listing that generates $30,000 in NOI. A quick calculation ($30,000 / 0.06) tells you that a fair market value for this property is around $500,000. If it's listed for $450,000, you might have just found a fantastic deal.
This is also fundamental to pricing a rental property effectively. Your NOI shows what you can realistically earn, and the market cap rate tells you if your price is in line with what other local investors are expecting.
Comparing Investment Opportunities Head-to-Head
The second major use is as a universal yardstick. Cap rate lets you cut through the noise and compare completely different properties on an apples-to-apples basis.
Imagine you're looking at two very different properties, but both are listed for $500,000. Which one is the better investment? Cap rate gives you the answer.
Let's look at a side-by-side comparison to see this in action.
Property A vs. Property B Investment Comparison
Here, we're comparing a sleek downtown condo against a practical suburban duplex. Both have the same price tag, but their income potential tells a very different story.
| Metric | Property A (Downtown Condo) | Property B (Suburban Duplex) |
|---|---|---|
| Purchase Price | $500,000 | $500,000 |
| Annual NOI | $25,000 | $35,000 |
| Calculated Cap Rate | 5.0% | 7.0% |
At first glance, Property B looks like the clear winner. Its 7.0% cap rate means it's generating a higher initial return for every dollar you invest compared to Property A's 5.0%. It’s working harder for your money.
But this is where your expertise comes in. A higher cap rate often comes with higher perceived risk. Is the duplex in a less desirable neighborhood? Is the building older and likely to need more repairs? Conversely, Property A's lower cap rate might signal a safer, more stable asset in a prime location with high demand.
To see how these numbers can be projected forward, check out our guide on understanding the pro forma cap rate.
Cap rate is your first-pass filter, not your final verdict. It’s the tool that helps you quickly sort through dozens of listings to find the few that truly deserve a deeper dive.
Remember, cap rates aren't static; they move with the market. A seemingly small 100 basis point (1%) jump in market cap rates—say, from 4% to 5%—can slash a property's value by 20% if the NOI stays the same. This shows just how sensitive property values are to both income and market sentiment.
Put Your Analysis on Autopilot with Property Scout 360
Understanding how to calculate cap rate and NOI by hand is a fundamental skill for any serious investor. But let's be honest—it's also slow, repetitive, and leaves the door wide open for costly mistakes.
Smart investors know their time is better spent on strategy, not punching numbers into a spreadsheet for every single property that crosses their desk. This is exactly why we built Property Scout 360. It’s the tool that does the heavy lifting for you.
Our platform runs all these critical calculations in the background, instantly. Forget building your own financial models from scratch. Just plug in a property, and you’ll get a clear, unbiased picture of its financial viability in seconds. It’s about making confident decisions, faster.
Instantly Model "What-If" Scenarios
Beyond just giving you the numbers, Property Scout 360 lets you play with them. Real estate is never static, so your analysis shouldn't be either. You can tweak the key assumptions to see how a deal holds up under pressure.
- Play with Vacancy: What happens to your bottom line if vacancy is 5% instead of the optimistic 2% the seller is quoting? Now you know.
- Adjust Expenses: Think property management will cost more than estimated? Bump up the percentage and see the immediate impact on your NOI.
- Stress-Test Your Financing: Cap rate is just one piece of the puzzle. See how different down payments or interest rates will affect your actual cash-on-cash return.
The dashboard gives you a single command center where all these moving parts come together, giving you a crystal-clear view of an investment's potential.

Having all your data in one spot like this is a game-changer, letting you compare properties side-by-side with ease. To see how it all works, check out our getting started guide for Property Scout 360.
Answering Your Top Questions About Cap Rate and NOI
Even when you’ve got the formulas down, some questions always pop up when you start applying cap rate and NOI to real-world deals. Let's walk through some of the most common ones I hear from investors. Getting these straight will give you a ton of confidence when you’re analyzing your next opportunity.
What’s Actually a “Good” Cap Rate?
This is the million-dollar question, and the honest answer is: it depends. There's no universal number that works everywhere. What’s considered a "good" cap rate is completely tied to the market, the type of property, and how much risk you’re comfortable with.
For example, in a hot, stable market like San Francisco, you might see cap rates around 4-5%. That might sound low, but it reflects the area's low risk and strong potential for property value to climb. On the other hand, in a smaller, up-and-coming market, you should be looking for a higher return—maybe 8-10% or more—to make up for the added uncertainty.
The best way to think about it is as a benchmark. A good cap rate is one that’s in line with, or better than, the average for similar properties in that specific neighborhood. It tells you you're getting a solid return for the level of risk you're taking on.
Is It Possible to Have a Negative NOI?
You bet, and it's a massive red flag. A negative Net Operating Income simply means the property's operating expenses are higher than all the income it brings in.
Think about that for a second. The property isn't even making enough money to pay for its own upkeep, let alone the mortgage. If you see a negative NOI, you'd need a rock-solid, immediate plan to either boost the income or drastically cut costs. Otherwise, you're looking at an asset that's bleeding cash every single month.
Why Isn’t the Mortgage Payment Part of NOI?
This is a really important point that trips up a lot of new investors. The mortgage is a financing expense, not an operating expense.
NOI is designed to measure how profitable the property itself is, completely separate from how the owner chose to buy it. By leaving the mortgage out, you get a clean number that lets you compare properties on a level playing field. It lets you see the raw potential of a deal, whether it was bought with all cash or with a big loan. Once you want to see how financing impacts your personal returns, you'd look at a different metric, like Cash-on-Cash Return.
Stop drowning in spreadsheets and start making smarter, faster investment decisions. Property Scout 360 automates your cap rate, NOI, and cash flow analysis in seconds. Find your next profitable investment today.
About the Author
Related Articles
2026 Investor's Guide: Cost of Installing a Sewer Clean Out
Understand the cost of installing a sewer clean out for investment properties in 2026. Get expert advice on prices, ROI, & budgeting for flips. Plan smart!
15 Year vs 30 Year Mortgage: The Investor's Choice
Deciding between a 15 year vs 30 year mortgage for a rental property? Our guide analyzes cash flow, ROI, and equity to help you pick the best loan.
Real Estate Appraisal Software: Features & Limits
Discover what real estate appraisal software is, its core features, and limits. See how it differs from investment tools for profitable deals.