How to Calculate IRR in Real Estate The Definitive Guide
Unlock the true return of your investments. Learn how to calculate IRR for real estate using practical examples, Excel functions like XIRR, and expert tips.
At its core, calculating the IRR means finding the specific discount rate that brings the Net Present Value (NPV) of your investment's cash flows down to zero. You could find this through painstaking trial and error with a formula, but let's be realistic. The most practical and time-efficient methods are using Excel’s IRR or XIRR functions or a dedicated financial calculator.
These tools are built to instantly process your initial investment (the cash out), all the rental income you collect, and your final profit from the sale to pinpoint the exact annualized rate of return.
What IRR Reveals About Your Real Estate Investment

Before we jump into spreadsheets and formulas, it’s critical to get a gut-level feel for what the Internal Rate of Return (IRR) is actually telling you. Think of it as your investment’s true, all-in, annualized return. It accounts for every single dollar that goes in and every dollar that comes out over the entire hold period.
What makes IRR so powerful is that it understands that timing is everything. This is based on a fundamental financial principle: the time value of money. A dollar in your pocket today is worth more than a dollar you expect to receive a year from now.
Unlike simpler metrics like Cap Rate, which just give you a one-year snapshot, IRR tells the property's complete financial story from the day you buy it to the day you sell it.
Why IRR Matters More Than Other Metrics
IRR is the great equalizer. It gives you a standardized way to compare wildly different investment opportunities on a level playing field, boiling down years of complex cash flows into a single, intuitive percentage.
Suddenly, an IRR of 10% on a Phoenix duplex isn't just a number; it's a yardstick you can use to directly compare against a projected 10% return from the stock market or a different business venture. This is absolutely essential for making smart decisions about where to put your capital.
For any real estate investor, IRR helps answer the big questions:
- Is this long-term rental really the best use of my capital for the next ten years?
- Should I go for a quick "fix-and-flip" or a slower, more stable rental property?
- Does this deal clear my personal "hurdle rate," or the minimum return I'm willing to accept?
A deep-dive analysis of real estate from 2000 to 2025 revealed that a typical Phoenix rental property delivered an inflation-adjusted IRR of about 5.0% per year. For context, that nearly matched the S&P 500's real return of 5.1% during the same 25-year stretch. It’s a powerful testament to how a properly leveraged real estate investment can build serious wealth. You can see the full 25-year return analysis on buyaztoday.com for the complete breakdown.
The core idea behind IRR is simple but profound: It’s the rate at which your investment is compounding internally over time. By factoring in all cash flows, it gives you the truest measure of a project’s profitability.
Getting Your Numbers Straight for a Reliable IRR
Your IRR calculation is only as good as the numbers you put into it. Garbage in, garbage out, as they say. A seemingly small oversight at this stage can throw off your entire projection, making a bad deal look great or a great deal look mediocre. To get a result you can actually trust, you need to dig in and map out every single dollar that will flow in and out of your pocket over the life of the investment.
Think of it as building the financial story of the property, from the day you buy it to the day you sell. Precision here isn't just a nice-to-have; it's essential.
The Three Key Phases of Investment Cash Flow
To build a complete and accurate timeline, you need to break down the investment into its three core financial phases.
Initial Investment (Year 0): This is the big number—your total cash out-of-pocket to get the deal done. It’s far more than just the down payment. You have to include closing costs, inspection and appraisal fees, and, crucially, any upfront repair or renovation money needed to get the property rent-ready. This is your first, and largest, negative cash flow.
Ongoing Operational Cash Flows: These are the annual net profits (or sometimes, losses) you'll see while you hold the property. To nail this down, you start with your gross rental income and then subtract all your operating expenses. We're talking property taxes, insurance, maintenance, property management fees, and a realistic vacancy allowance. For a deeper dive, our guide on how to calculate cash flow on a rental property breaks it down completely.
Final Exit Cash Flow: This is the lump sum you get back when you sell. Start with your projected sale price, then subtract the costs of selling (like realtor commissions and closing costs), any capital gains taxes you'll owe, and of course, the remaining mortgage balance. This will be your final, large positive cash flow.
It’s also wise to consider costs that can directly influence that final sale price. For example, knowing the real cost to stage a house can help you budget for a potentially higher and faster sale, directly impacting your exit cash flow.
Expert Insight: The single biggest mistake I see investors make is underestimating expenses. Always, always build in a buffer. A vacancy allowance of 5-8% of gross rent is a good starting point, and don't forget to budget for big-ticket capital expenditures like a new roof or HVAC system down the line. Ignoring these will sink your projections.
Phoenix Rental 10-Year Cash Flow Projection
To see how this works in practice, let's lay out the full 10-year cash flow projection for our Phoenix rental example. This table maps out every anticipated cash movement, from the initial purchase to the final sale, and will be the foundation for our IRR calculations.
| Year | Description | Cash Flow Type | Amount |
|---|---|---|---|
| 0 | Down Payment, Closing Costs, & Repairs | Initial Investment | -$65,000 |
| 1 | Annual Net Operating Income | Operational | $3,600 |
| 2 | Annual Net Operating Income | Operational | $3,600 |
| 3 | Annual Net Operating Income | Operational | $3,600 |
| 4 | Annual Net Operating Income | Operational | $3,600 |
| 5 | Annual Net Operating Income | Operational | $3,600 |
| 6 | Annual Net Operating Income | Operational | $3,600 |
| 7 | Annual Net Operating Income | Operational | $3,600 |
| 8 | Annual Net Operating Income | Operational | $3,600 |
| 9 | Annual Net Operating Income | Operational | $3,600 |
| 10 | Sale Proceeds (Net of Loan & Costs) | Final Sale | $145,000 |
With these specific, year-by-year numbers in place, we now have the raw data we need to move on and calculate the actual IRR.
Getting Your Hands Dirty: Calculating IRR with Excel and Formulas
With your numbers laid out, it's time to actually calculate the IRR. While you could try to do this by hand with a formula, in practice, nobody does. We all use spreadsheets or financial calculators. They’re faster, more accurate, and let you focus on what the number means, not how to get it.
Still, it’s worth taking a quick peek under the hood at the manual formula. Understanding the logic helps you appreciate what Excel is doing for you.
The Theory Behind the Manual Formula
At its core, calculating IRR is really just a sophisticated game of trial and error. The entire goal is to find the one special discount rate that makes the Net Present Value (NPV) of all your future cash—both income and your final sale proceeds—exactly equal to your initial investment.
Put another way, you're solving for the interest rate that makes the whole project break even in today's dollars. You’d have to keep plugging different rates into the NPV formula until you hit zero. As you can imagine, for a real estate deal spanning several years, that's a nightmare. Thank goodness for technology.
Let Excel Do the Heavy Lifting
This is where a simple spreadsheet becomes an investor's most valuable tool. Excel has two powerful functions built just for this: IRR and XIRR.
The standard IRR function is fine if your cash flows are perfectly regular, like clockwork on the same day every year. But let’s be honest, real estate is never that tidy.
This is where XIRR is the real MVP. It’s built for the messy reality of property investing—cash flows hitting your account on irregular dates. You have a big outflow on the closing date, monthly or annual income trickling in, and then a final lump sum when you sell, all on different days of the month or year.
To set this up, you need a clean spreadsheet. If you want a great template for organizing your numbers, our guide on building a rental property Excel sheet is a fantastic starting point.
No matter how you track it, there are always three core components you need to nail down for a solid IRR calculation.
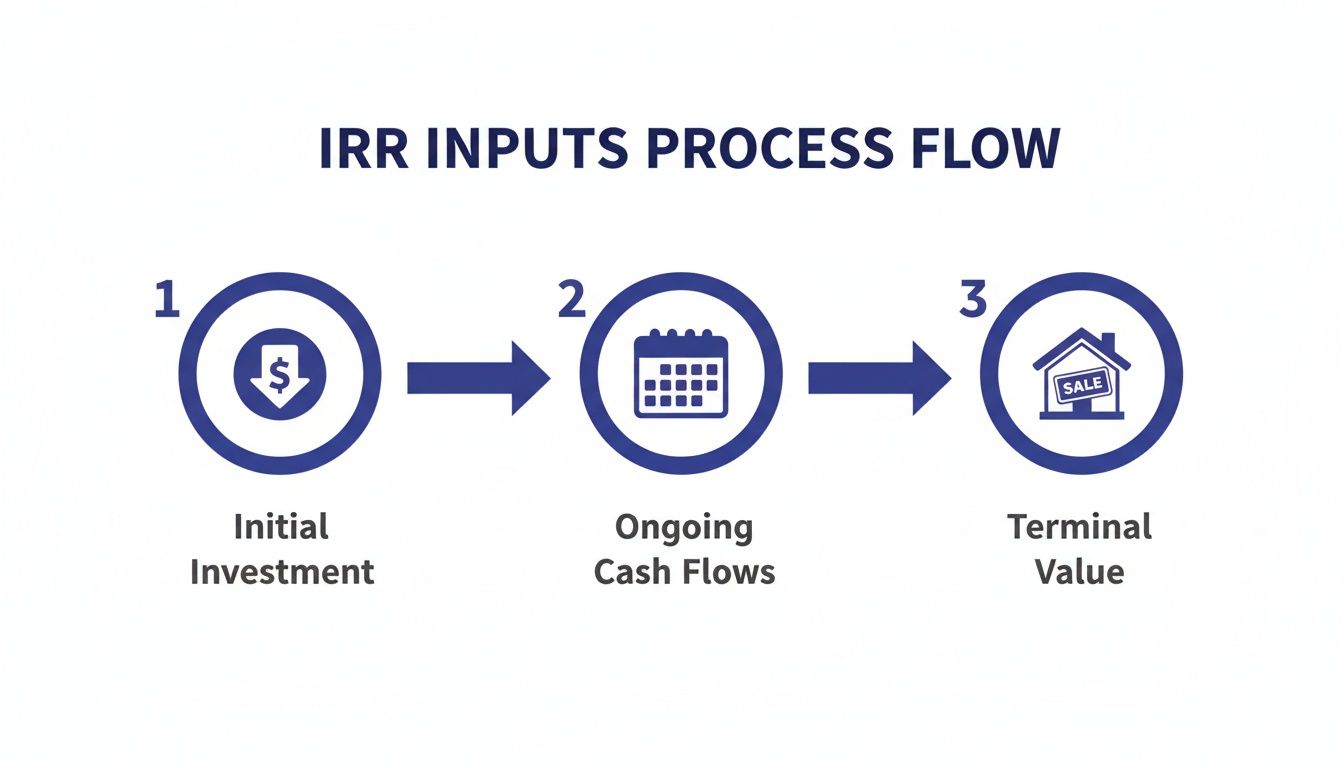
This process visualizes how your initial down payment, the cash flow from operations, and your final payout from the sale are the essential ingredients.
Using the XIRR function itself is surprisingly simple. Just set up two columns:
- Column A: The exact date of every transaction.
- Column B: The cash amount for that date (remember to make outflows negative numbers!).
The formula looks like this: =XIRR(values, dates, [guess]). You just highlight your column of cash flows, then your column of dates. The "guess" part is optional; Excel is smart enough to figure it out without it.
Pro Tip: The XIRR function is a game-changer because it automatically factors in the exact timing of every dollar. This gives you a true, annualized rate of return without needing any complex manual adjustments. It’s the most accurate way to measure performance for a real-world real estate investment.
Navigating Common IRR Pitfalls and Assumptions
The Internal Rate of Return is an incredibly insightful metric, but it isn't foolproof. Viewing it as some kind of crystal ball for future profits is a fast track to making flawed investment decisions. To really use IRR effectively, you have to get to know its built-in assumptions and the common missteps that can trip up even seasoned investors.
The Reinvestment Rate Myth
One of the most persistent myths surrounds the reinvestment rate assumption. The common wisdom says that IRR assumes you can reinvest all your positive cash flows at the exact same rate as the IRR itself. So, if your deal shows a fantastic 18% IRR, the formula supposedly assumes you can find other 18% deals to park your cash in, year after year. Let's be honest—that's rarely going to happen in the real world.
Key Takeaway: The truth is a bit more nuanced. IRR is technically a discounting function that measures the return on capital while it's still tied up in the investment. It doesn't actually make a forward-looking assumption about what you do with cash after you receive it. Still, the "reinvestment myth" highlights a very real problem: a high IRR can be misleading if the market makes it impossible to reinvest your profits at a similar rate.
When Cash Flows Get Complicated
Another tricky situation pops up when you have non-conventional cash flows. A typical deal is simple: one big negative cash flow at the start (the purchase), followed by a string of positive ones. But real estate is rarely that clean.
What if you're planning a major, costly renovation in year five of a ten-year hold? That introduces a second large negative cash flow well after your initial purchase.
- Year 0: -$65,000 (Purchase)
- Years 1-4: +$3,600 (Positive annual cash flow)
- Year 5: -$40,000 (Major renovation)
- Years 6-10: +$5,000 (Increased cash flow post-renovation)
This kind of pattern, where the cash flow sign flips from positive back to negative, can mathematically generate multiple IRRs. Your spreadsheet could spit out two totally different, yet valid, answers. Suddenly, you're left guessing the project's true return. It’s not an everyday problem, but it’s a critical flaw to be aware of.
The Danger of Garbage In, Garbage Out
At the end of the day, the most common mistake is the simplest: feeding the IRR calculation overly optimistic numbers. Your analysis is only as good as the assumptions you make about future rent growth, appreciation, and expenses.
If you project 5% annual rent growth in a market that has historically only managed 2%, you'll get a beautiful IRR that has absolutely no basis in reality. It's a classic case of "garbage in, garbage out."
This is where sensitivity analysis becomes your best friend. Don't just run the numbers once. Build out a few scenarios: best-case, worst-case, and a realistic middle ground. See how your IRR survives if appreciation goes flat for five years or if a surprise capital expense wipes out a year's cash flow. Stress-testing your assumptions is what turns IRR from a simple number into a powerful tool for truly understanding risk.
Putting Your IRR Analysis on Autopilot with Modern Real Estate Tools
Look, knowing how to crunch the numbers on an IRR calculation is a fundamental skill. But let's be honest—building spreadsheets for every single deal you look at is a huge time-sink, and it's dangerously easy to make a costly mistake. One fat-fingered formula or a bad assumption can make a dog of a property look like a winner. This is exactly why savvy investors lean on modern real estate analysis platforms.
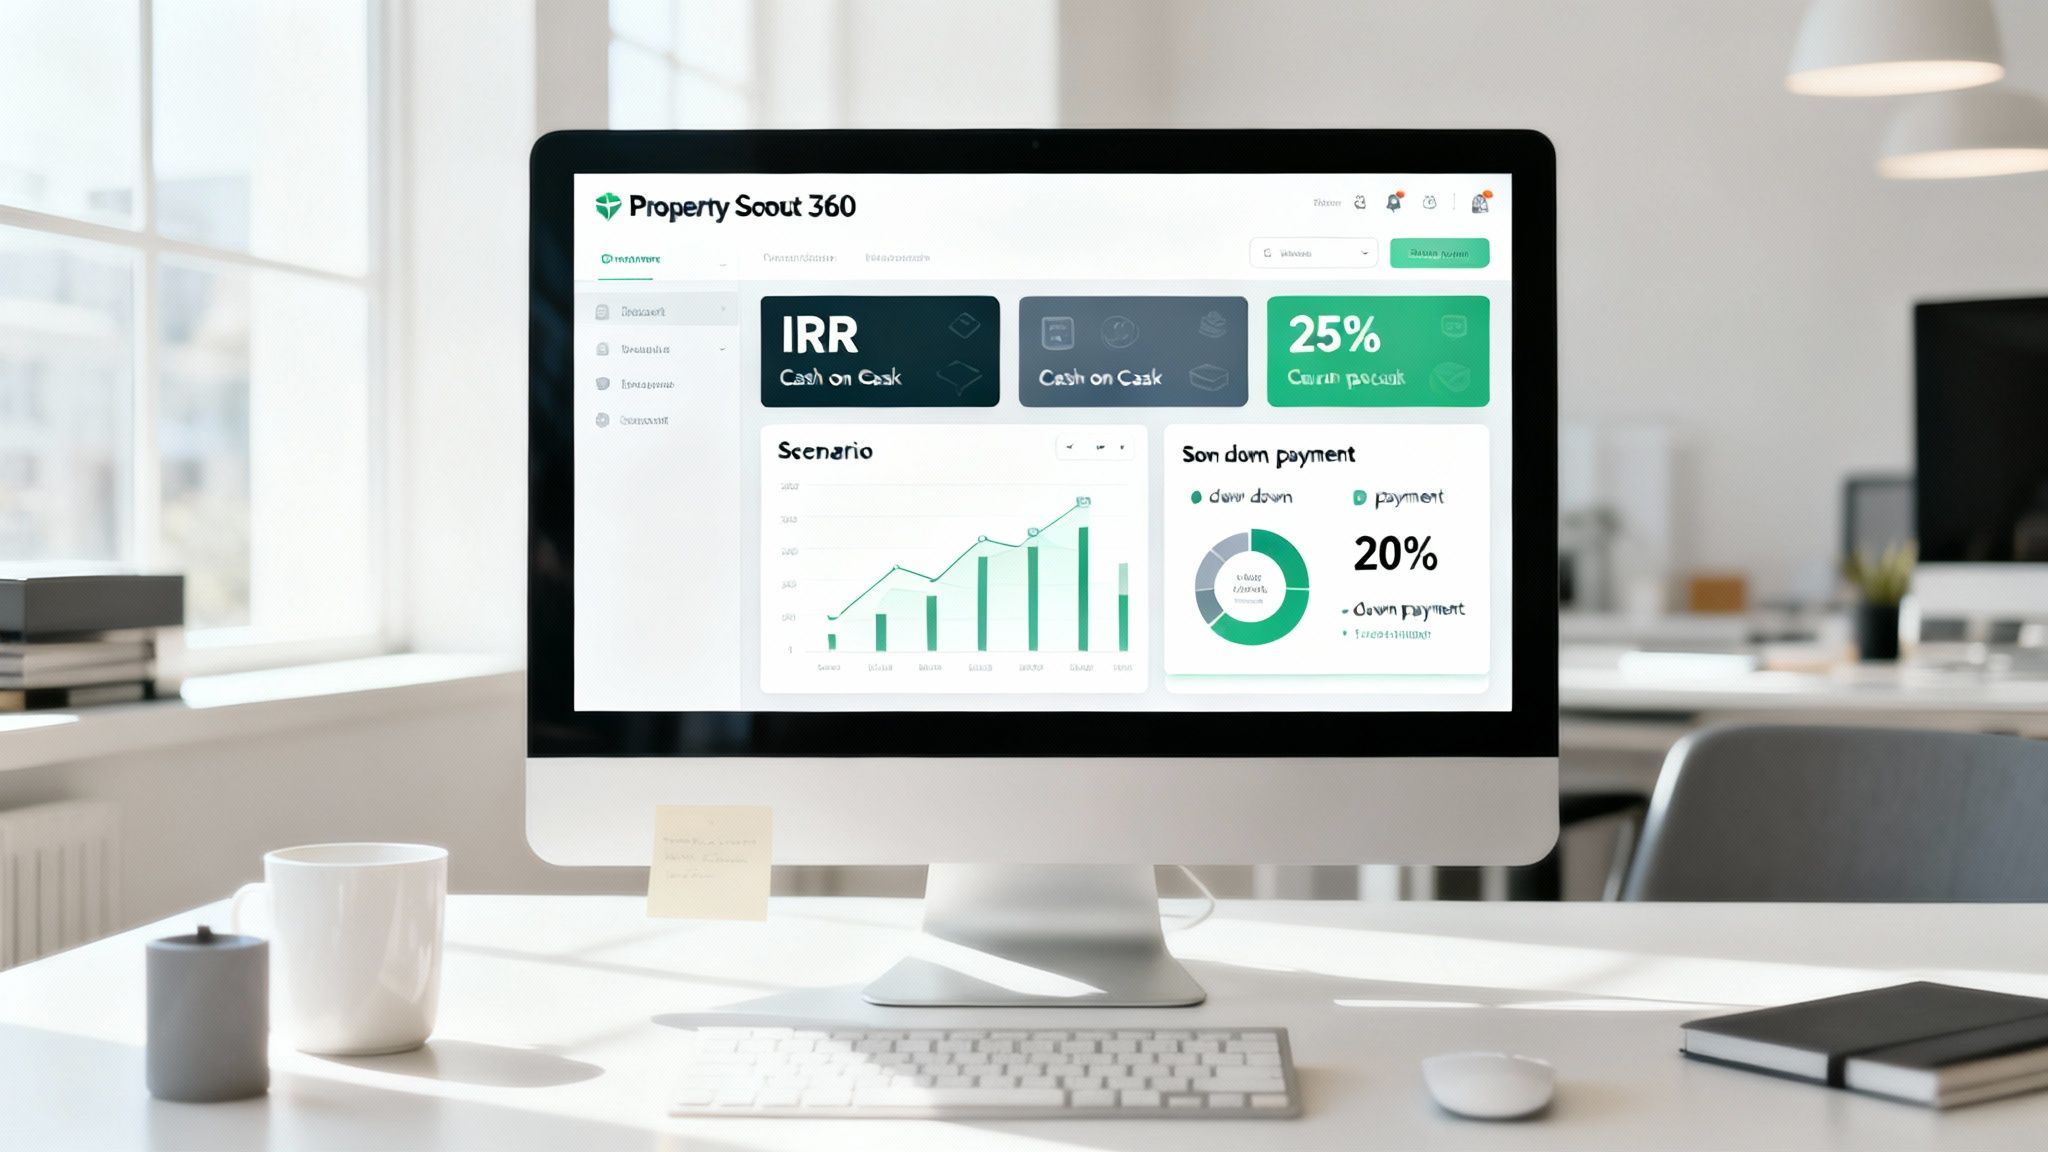
Software like Property Scout 360 does the heavy lifting for you. It can take what would have been hours of spreadsheet gymnastics and turn it into instant, clear-headed insights. You can pull up virtually any property in the U.S. and immediately see its projected IRR, cash-on-cash return, and cap rate. It's about working smarter, not harder.
Running Scenarios in Real-Time
This is where these tools really shine. Their speed and flexibility are game-changers. Imagine you're vetting a duplex and wondering about the best way to finance it. Instead of building out multiple spreadsheet tabs, you can model different scenarios in seconds.
- Financing Comparison: How does a 15-year mortgage stack up against a 30-year loan in terms of long-term IRR? Just click a button and see.
- Down Payment Impact: What happens if you put 20% down versus 25%? You can instantly see how that affects not just your IRR but also your immediate cash-on-cash return.
- Rent Sensitivity: Think you can get an extra $100 in rent per month? Tweak that number and watch all your key metrics update on the spot.
Being able to test your assumptions on the fly is what separates static analysis from dynamic, intelligent decision-making. You can quickly figure out the absolute best way to structure a deal for a specific property without getting lost in the weeds of manual calculations. If you're exploring the landscape, our guide on the best real estate investment software gives a great overview of what's out there.
From Complex Data to Clear Decisions
At the end of the day, knowing how to calculate IRR is only half the battle. The other half—the more important half—is using that information to make good decisions. This is where modern platforms excel, taking complex financial models and presenting them in simple, intuitive dashboards.
By automating the tedious parts of due diligence, you free up your mental energy to focus on what truly matters—making a confident, data-backed investment decision that aligns with your financial goals.
Historical data shows just how critical precise analysis is. A fascinating 145-year study revealed that rental properties produced an average real return of 7.05% per year, just beating out stocks. Using tools that instantly calculate IRR gives you a powerful benchmark to see how your potential deal stacks up against long-term historical performance.
For a deeper dive into the tools available, check out this list of the Top 12 Real Estate Investment Analysis Tools. Platforms like Property Scout 360 are built to eliminate the guesswork, giving you confidence that your numbers are right and your decisions are sound.
Common Questions I Hear About Real Estate IRR
Even after you get the hang of calculating IRR, some questions always seem to come up. I've heard them from new investors and seasoned pros alike. Let's tackle a few of the most common ones so you can feel completely confident using this metric.
We'll get into what a "good" IRR actually looks like, how it's different from other popular metrics, and a practical tip for getting it right in Excel.
What’s a Good IRR for a Rental Property?
This is the million-dollar question, and the honest answer is: it depends. A good IRR is entirely relative to your own goals, how much risk you're willing to take, and what the market is doing.
That said, as a general rule of thumb, many long-term investors I know look for an IRR between 8% and 12% on a stable rental property in a decent area. That range usually signals a solid return for the risk and work you're putting in.
But if you're taking on a more intensive project, like a BRRRR (Buy, Rehab, Rent, Refinance, Repeat) deal, you should be aiming higher. For that kind of hands-on effort and added risk, a target IRR of 15% or more makes a lot more sense. The real trick is to weigh a deal's projected IRR against your other options—including just putting that money into an S&P 500 index fund.
How Is IRR Different from Cash-on-Cash Return?
This is a really important one to get straight.
Cash-on-Cash (CoC) Return is basically a quick, one-year snapshot. It’s simple: it just tells you what percentage of your initial cash investment you got back in a single year. If you put $50,000 down and the property generated $5,000 in positive cash flow for the year, your CoC return is 10%. Simple and useful, but limited.
IRR, on the other hand, tells the entire story. It looks at every single dollar that moves in or out over the whole life of the investment. This includes your down payment, every month of rent, all your expenses, and the final payout when you sell the property.
The Bottom Line: IRR accounts for the time value of money, which is a core principle of finance. It understands that a dollar in your pocket today is worth more than a dollar you'll get five years from now. Cash-on-cash return completely ignores this.
Can I Use Excel’s IRR Function for Monthly Cash Flows?
Technically, yes, but it’s a classic rookie mistake. If you plug a series of 12 monthly cash flows into Excel's standard =IRR() function, it will spit out a monthly IRR.
To get the annual number, you can't just multiply by 12. That's a common error that will throw off your numbers. You have to use this formula: Annual IRR = (1 + monthly_IRR)^12 - 1. It's clunky and easy to forget.
Honestly, there's a much better way. Just use the XIRR function. It's designed for exactly this situation. You just need two columns: one for the cash flow amounts and one for the exact date of each cash flow. XIRR does the rest, automatically giving you a precise, annualized IRR. It's simpler, more accurate, and built for real-world real estate investing.
Ready to stop wrestling with spreadsheets and get instant, accurate IRR projections for any U.S. property? Property Scout 360 eliminates the guesswork, helping you analyze deals, compare financing scenarios, and make confident, data-backed investment decisions in minutes. Discover how Property Scout 360 can transform your real estate analysis today.
About the Author
Related Articles
2026 Investor's Guide: Cost of Installing a Sewer Clean Out
Understand the cost of installing a sewer clean out for investment properties in 2026. Get expert advice on prices, ROI, & budgeting for flips. Plan smart!
15 Year vs 30 Year Mortgage: The Investor's Choice
Deciding between a 15 year vs 30 year mortgage for a rental property? Our guide analyzes cash flow, ROI, and equity to help you pick the best loan.
Real Estate Appraisal Software: Features & Limits
Discover what real estate appraisal software is, its core features, and limits. See how it differs from investment tools for profitable deals.