How to Determine Cap Rate on Rental Property A Practical Guide
Learn how to determine cap rate on rental property with our guide. We cover NOI calculations, real-world examples, and common mistakes to avoid.
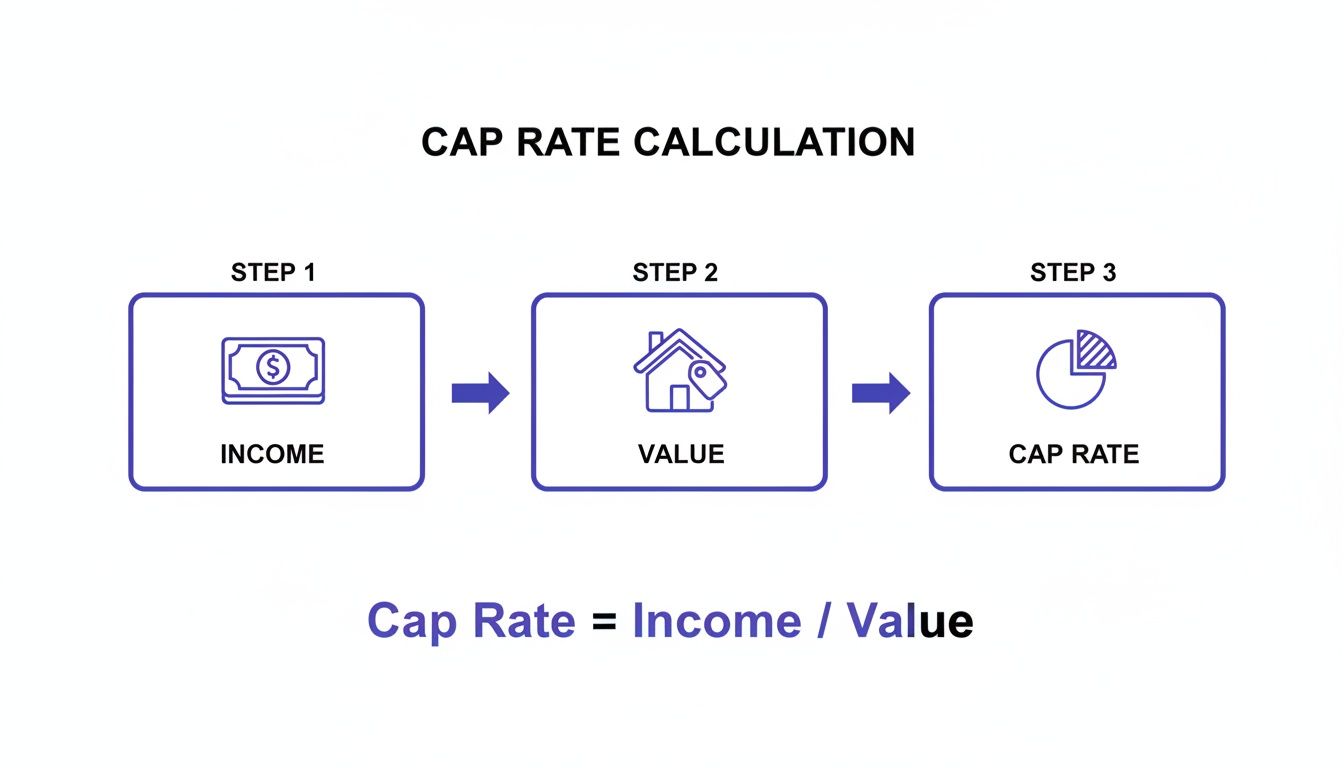
So, you're ready to calculate the cap rate for a rental property. The formula itself is simple: divide the Net Operating Income (NOI) by the property's current market value. This calculation gives you the unlevered rate of return as a percentage, offering a clean, straightforward way to compare different investment opportunities.
Understanding Cap Rate and Why It Matters for Investors
Before you can confidently analyze a deal, you need to speak the language of real estate investors. The capitalization rate—or cap rate—is a fundamental piece of that vocabulary.
Think of it as a quick snapshot of a property's earning potential, completely stripped of any financing details. It measures the raw return an investment property could generate, which is incredibly useful for comparing a duplex in one neighborhood to a single-family home across town on a true apples-to-apples basis.
This metric is so powerful because it boils a complex asset down to a single, comparable figure. A single-family rental that brings in $24,000 in annual NOI and is valued at $400,000 has a cap rate of 6% ($24,000 / $400,000 = 0.06). For more on this core calculation, it's always worth seeing what real estate financing experts have to say.
Cap Rate Formula at a Glance
The formula might seem basic, but each component tells an important part of the story. Here's a quick breakdown to keep on hand.
| Component | Definition | Example Value |
|---|---|---|
| Net Operating Income (NOI) | The property's total income minus all operating expenses (before mortgage payments). | $24,000/year |
| Current Market Value | The price the property could realistically sell for in the current market. | $400,000 |
| Capitalization Rate (Cap Rate) | The resulting percentage that represents the unlevered rate of return. | 6.0% |
This table neatly lays out how NOI and market value come together to give you that essential cap rate figure.
Interpreting the Numbers
A cap rate is more than just a number; it tells a story about risk and return. A higher cap rate might look great on paper, suggesting better cash flow, but it often comes with higher perceived risk.
What could that risk look like?
- A less desirable or transitioning neighborhood.
- An older property that needs a lot more maintenance.
- A history of high tenant turnover and vacancy.
On the other hand, a lower cap rate usually points to a safer, more stable asset in a high-demand area. Investors are often willing to pay a premium for properties in prime locations with a solid tenant base, which pushes the property's value up and, consequently, the cap rate down.
A low cap rate isn’t automatically bad, and a high one isn’t always good. The "right" cap rate depends entirely on the market, the property type, and your personal investment strategy. A 5% cap rate in a rapidly appreciating coastal city could be a fantastic deal, while an 8% cap rate in a stagnant market might be a red flag.
Why It's an Essential First Step
Ultimately, knowing how to find the cap rate on a rental property gives you a crucial first-pass filter for any potential investment. It's the tool you use to quickly weed out deals that don't meet your criteria and flag the ones that deserve a much deeper look.
While it doesn’t tell you anything about your loan, potential appreciation, or tax benefits, it sets a solid foundation for every bit of analysis that follows. It’s the starting point for moving from a casual house-hunter to a serious, data-driven real estate investor.
Calculating Net Operating Income: The Engine of Your Analysis
Before you can even think about cap rate, you have to get a handle on the single most important number in the equation: Net Operating Income (NOI). I like to think of NOI as the engine of the whole analysis. If you get this number wrong, your final cap rate will be worthless, and you could end up making a terrible investment decision based on bad math.
So, where do we start? With the money coming in—the Gross Rental Income. But it's not as simple as taking the monthly rent and multiplying by twelve. Any seasoned investor will tell you that you need to account for how a property actually performs in the real world.
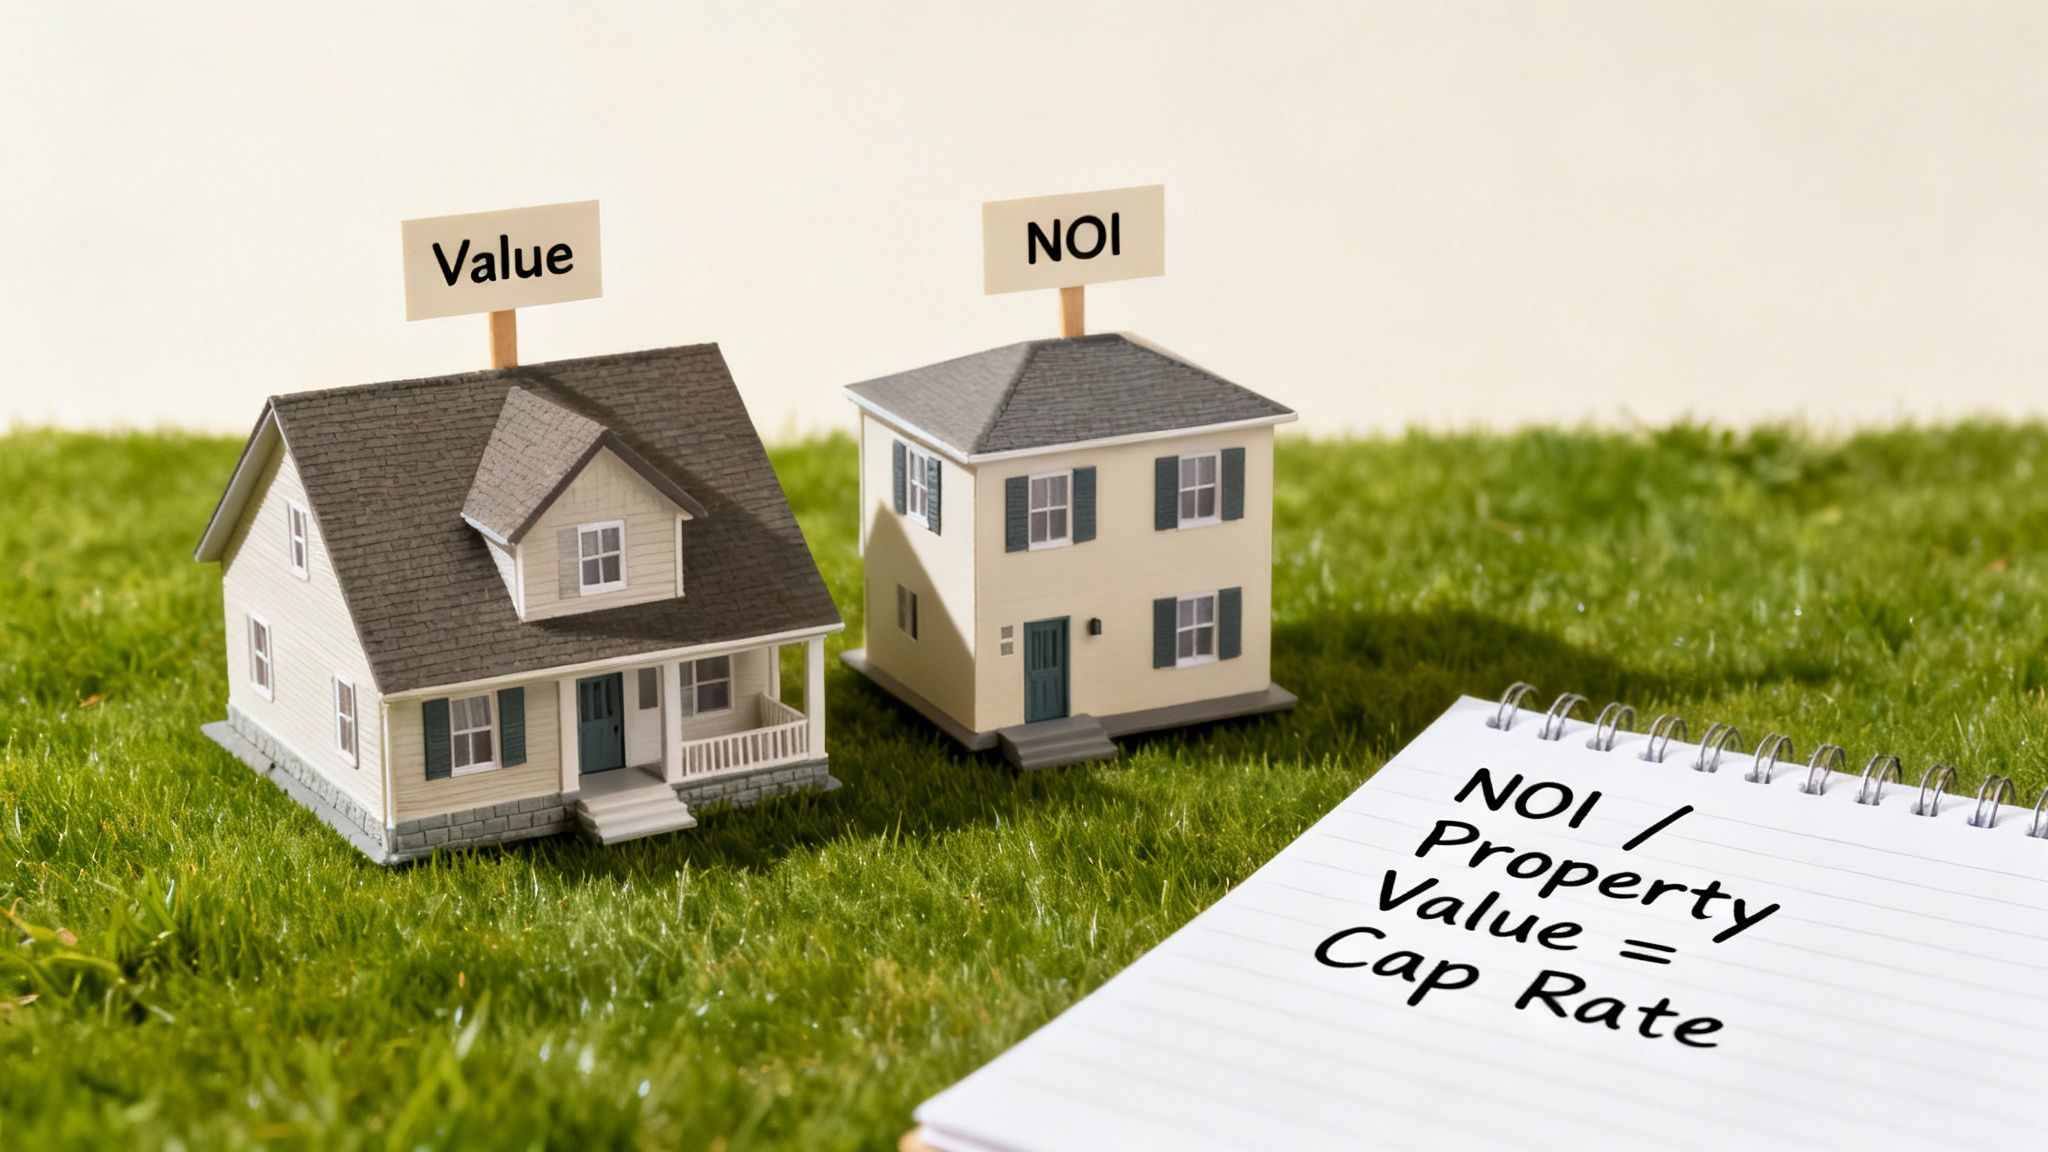
The whole process is about connecting the property's income potential to its market value to arrive at that all-important cap rate.
As you can see, getting the income part right is the foundational first step. Let's dig into that.
Starting with Realistic Gross Income
To paint an honest picture of your income, you absolutely must factor in vacancy. No property—I repeat, no property—stays rented 100% of the time. Tenants move out, and it takes time to find new ones.
A conservative vacancy rate, usually somewhere between 5% and 10% of gross rents, is a smart, standard adjustment. It grounds your numbers in reality.
For instance, say a property could theoretically bring in $30,000 a year in rent. If you apply a realistic 8% vacancy rate, you subtract $2,400. That leaves you with an Effective Gross Income of $27,600. This is your real starting point, not the pie-in-the-sky number.
Itemizing Your Operating Expenses
With your realistic income figured out, it's time to subtract all the costs of keeping the lights on and the property running. These recurring operating expenses are what it takes to maintain the investment day-to-day. When you're running the numbers, it's also worth noting the specifics of short-term leasing apartments, since their expense profiles can look quite different from a traditional annual lease.
Here are the usual suspects you'll need to account for:
- Property Taxes: The annual bill you can't avoid.
- Insurance: Your landlord or hazard policy.
- Property Management Fees: Typically runs 8-12% of whatever rent is collected.
- Repairs & Maintenance: Your budget for leaky faucets, running toilets, and other routine fixes.
- Utilities: Any services you, the landlord, are on the hook for (e.g., water, sewer, trash).
- Landscaping & Snow Removal: Keeping the property looking good and safe.
Crucial Tip: Your mortgage payment—principal and interest—is NOT an operating expense. This is the #1 mistake I see new investors make. Cap rate is designed to measure a property's performance independent of financing, so you always, always leave debt service out of the NOI calculation.
What to Exclude From Your Expense List
Knowing what not to include is just as important as knowing what to include. Throwing the wrong costs into the mix will completely skew your NOI and give you a garbage cap rate. Besides the mortgage, the other big category to exclude is capital expenditures.
A capital expenditure (CapEx) is a big-ticket, non-recurring expense for a major improvement. Think replacing a roof, putting in a new HVAC system, or repaving the driveway.
While you absolutely need to budget for these things (usually by setting aside reserves each month), they don't belong in the annual operating expenses for the NOI formula. Including a $10,000 roof replacement would make your NOI for that one year look terrible and misrepresent the property's typical performance. Mastering these distinctions is a fundamental part of conducting a proper rental property cash flow analysis.
Putting the Cap Rate Formula to Work: Real-World Scenarios
Alright, you've got the Net Operating Income (NOI) down. Now it’s time to stop talking theory and start running some actual numbers. The best way to get a feel for how to determine cap rate on rental property is to see it in action.
Let's walk through two common investment types: a classic single-family home and a small multi-family property. This will show you exactly how the math changes and what it can tell you about a deal.
The Suburban Single-Family Home
Let's start with a bread-and-butter rental: a three-bedroom, two-bathroom house in a decent suburb. Let's say the asking price is $400,000. After checking local comps, you figure you can realistically get $2,800 a month in rent.
First, let's figure out the income side, accounting for potential downtime.
- Gross Potential Rent: $2,800/month x 12 = $33,600
- Vacancy (5%): $33,600 x 0.05 = $1,680
- Effective Gross Income (EGI): $33,600 - $1,680 = $31,920
Next up are the operating expenses. These are the bills you have to pay to keep the property running, year in and year out. You’ll pull these numbers from tax records, insurance quotes, and your own experience.
- Property Taxes: $4,800
- Insurance: $1,200
- Repairs & Maintenance (8% of EGI): $2,554
- Property Management (10% of EGI): $3,192
- Total Operating Expenses: $11,746
Now, we can find our Net Operating Income.
NOI: $31,920 (EGI) - $11,746 (Expenses) = $20,174
With the NOI in hand, the final step is simple.
Cap Rate: $20,174 (NOI) / $400,000 (Value) = 5.04%
A 5.04% cap rate. This number is your baseline, a clean, debt-free measure of the property’s earning potential that you can now stack up against other deals.
The Urban Duplex
Now for something a little different: a duplex priced at $550,000. Each of the two units brings in $1,800 per month. The game changes a bit with multi-family. You have more income streams, but also more potential headaches and higher costs.
Let's run the income numbers.
- Gross Potential Rent: ($1,800/unit x 2 units) x 12 = $43,200
- Vacancy (7%): $43,200 x 0.07 = $3,024
- Effective Gross Income (EGI): $43,200 - $3,024 = $40,176
A duplex means two kitchens, two sets of plumbing, and possibly common areas. Your expenses will reflect that. For a deeper dive into projecting these kinds of numbers, doing a pro forma cap rate analysis can be incredibly helpful.
- Property Taxes: $6,200
- Insurance: $1,800
- Repairs & Maintenance (10% of EGI): $4,018
- Property Management (10% of EGI): $4,018
- Utilities (Landlord-paid water/sewer): $1,200
- Total Operating Expenses: $17,236
Time to calculate the NOI for the duplex.
NOI: $40,176 (EGI) - $17,236 (Expenses) = $22,940
And finally, the moment of truth.
Cap Rate: $22,940 (NOI) / $550,000 (Value) = 4.17%
So, the duplex has a cap rate of 4.17%. That’s lower than the single-family home, even with higher gross rent. What does that tell us? It might mean the duplex is in a more desirable, high-demand area, causing its price to be higher relative to its income—a common trade-off for what many investors see as a safer, more stable asset.
Cap Rate Showdown: Single-Family vs. Multi-Family
Seeing the numbers side-by-side really clarifies how property type influences the calculation.
| Metric | Single-Family Home Example | Duplex Example |
|---|---|---|
| Purchase Price | $400,000 | $550,000 |
| Gross Potential Rent | $33,600 | $43,200 |
| Effective Gross Income | $31,920 | $40,176 |
| Total Operating Expenses | $11,746 | $17,236 |
| Net Operating Income (NOI) | $20,174 | $22,940 |
| Cap Rate | 5.04% | 4.17% |
This comparison highlights a critical lesson: a higher income doesn't automatically mean a better cap rate. The relationship between income, expenses, and purchase price is what truly defines the deal.
Avoiding the Most Common Cap Rate Calculation Mistakes
Calculating a cap rate seems straightforward, but a few dangerous traps are hiding in that simple formula. I’ve seen many investors—new and experienced—get tripped up by the same costly errors that can make a great deal on paper turn into a real-world nightmare. Knowing what to watch out for is what separates a quick back-of-the-napkin guess from a truly professional analysis.
The first and most frequent mistake? Blindly trusting the seller's pro-forma statement. A pro-forma is just a projection, and it’s almost always painted with a very optimistic brush. You'll often see a listing touting a 0% vacancy rate or conveniently leaving out any mention of property management fees.
Never take a seller's numbers at face value. Always perform your own due diligence. Your analysis is only as good as the data you put into it, and using inflated income or deflated expenses will give you a dangerously misleading cap rate.
Underestimating Realistic Operating Expenses
Another major blunder is getting too lean with your expense projections. It’s easy for new investors to forget just how many little things add up. Two of the biggest costs people underestimate are vacancy and routine maintenance.
No property stays occupied 100% of the time. It just doesn't happen. Even in a red-hot rental market, you'll have turnover between tenants. Forgetting to factor this in will make your Net Operating Income look much better than it actually is. A conservative estimate is your best friend here:
- Vacancy Rate: I always budget at least 5-8% of Gross Rental Income for vacancy. If the market feels a bit shaky, I might even bump that up to 10% to be safe.
- Maintenance & Repairs: Things break. Faucets leak, appliances die, and tenants call. A good rule of thumb is to set aside 8-12% of your gross rents specifically for this kind of general upkeep.
Ignoring these realities is just asking for a cash flow crunch down the road. It’s far better to be pleasantly surprised when your costs come in lower than to be financially crippled by expenses you never saw coming.
Forgetting About Capital Expenditures
This is the big one. The most damaging oversight I see is completely forgetting to account for Capital Expenditures (CapEx). These are the large, infrequent expenses that don’t appear on your monthly P&L but can absolutely wipe out your profits when they hit.
We're talking about major replacements like:
- A new roof ($10,000+)
- An HVAC system replacement ($7,000+)
- Repaving a driveway ($5,000+)
While CapEx isn't technically part of the standard NOI calculation, you must budget for it by setting aside reserves. A common and prudent method is to allocate an additional 5-10% of your gross rental income into a separate savings account just for these future projects.
Ignoring CapEx is like pretending your roof will last forever. It’s a fantasy that will eventually, and expensively, come crashing down. By building these reserves into your overall financial plan, you ensure the property can actually sustain itself for the long haul.
How to Interpret Cap Rates for Smarter Investing
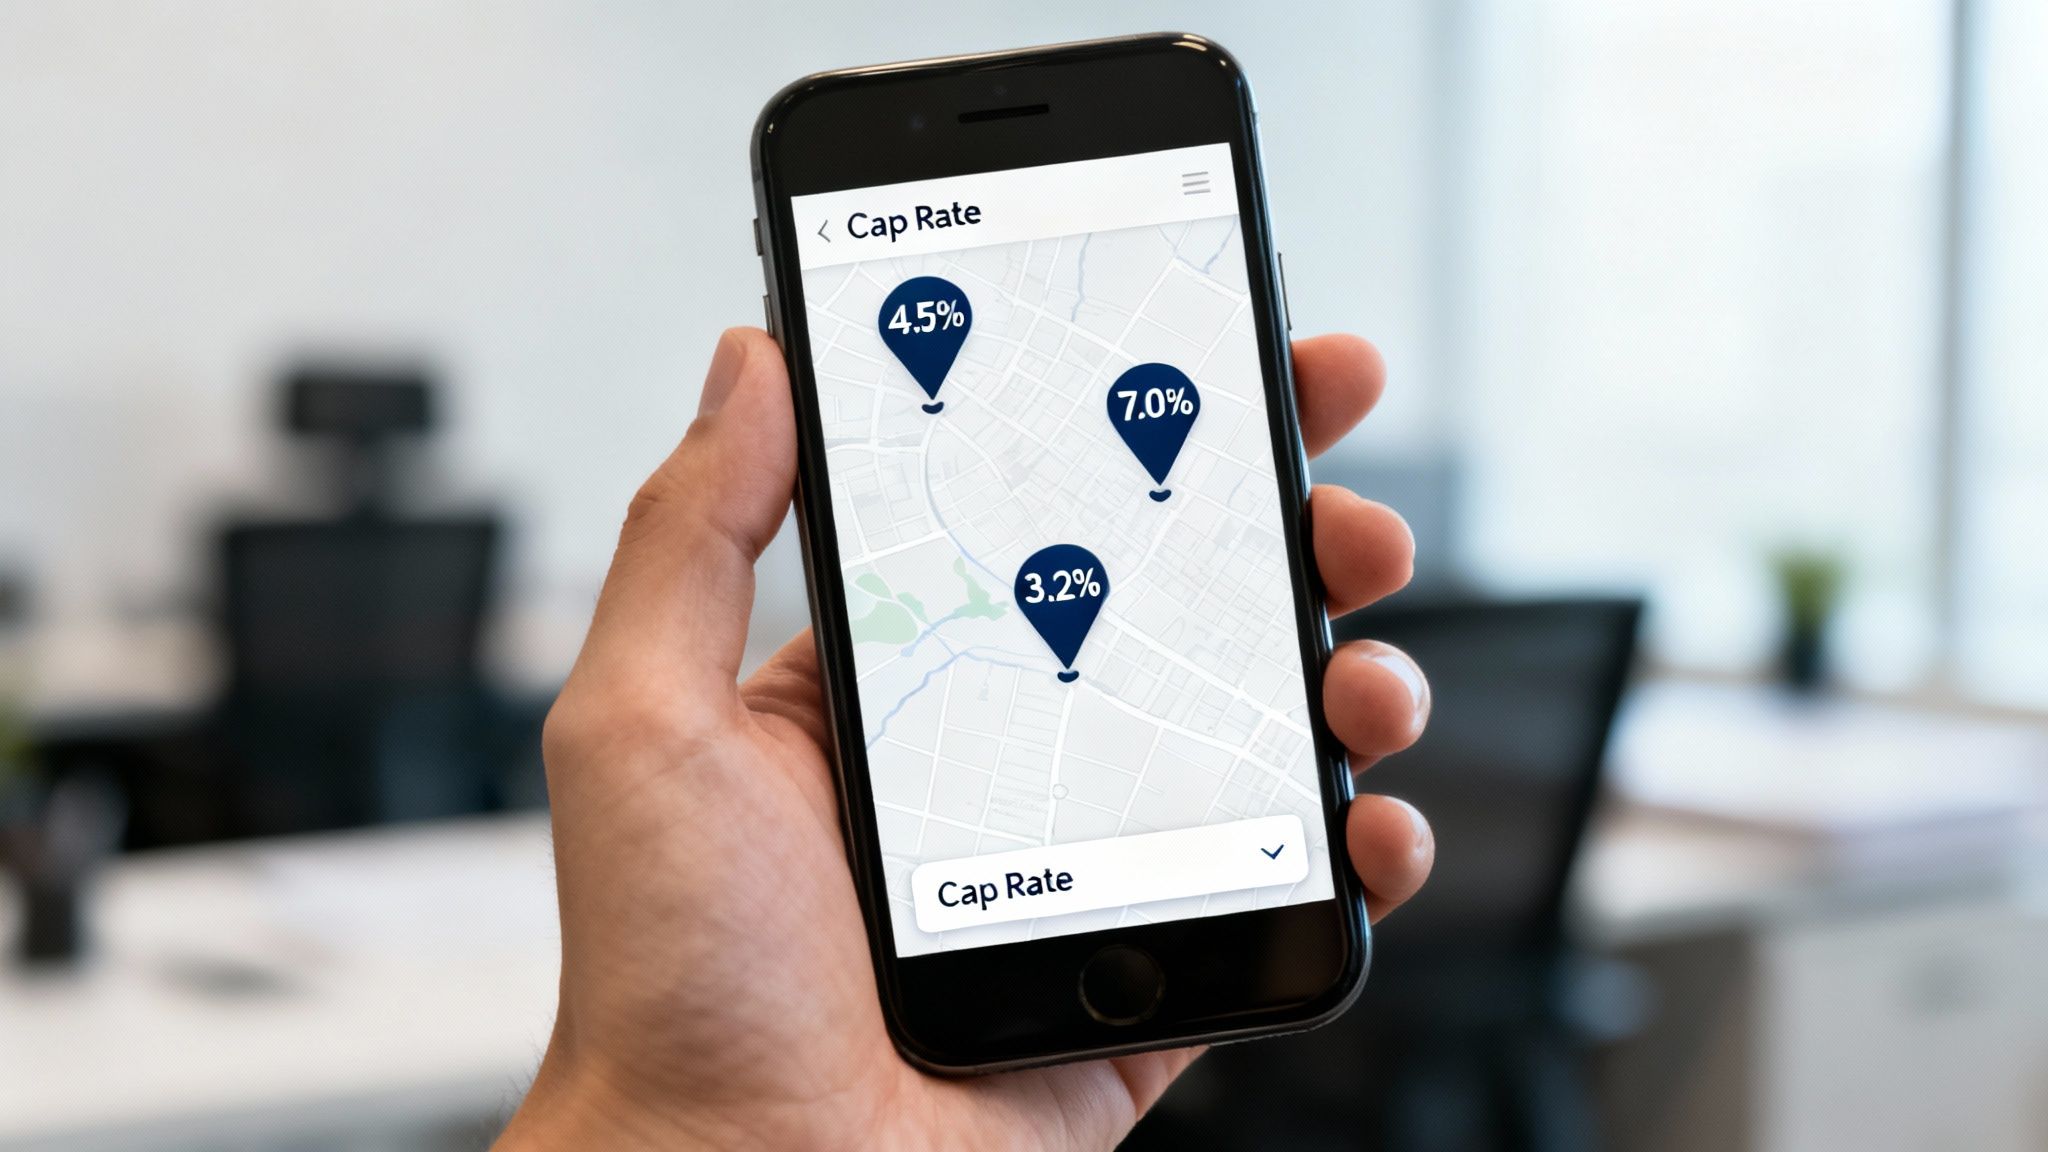
Calculating a cap rate is one thing, but knowing what that number actually means is where you start making real money. A 7% cap rate might be a grand slam in a hot market like Los Angeles, but it could be a complete dud somewhere like Cleveland. You have to learn to read the story the percentage is telling you.
This isn't just a number on a spreadsheet—it’s a snapshot of risk, potential return, and what the market is thinking, all rolled into one. The goal is to move beyond just plugging in numbers and start thinking like a seasoned analyst.
Reading the Market Signals
A property’s cap rate is almost always driven by three big things: its location, its asset class (A, B, or C), and the overall economic climate. Grasping how these forces interact is absolutely essential for making sense of any cap rate you come across.
As a general rule, there's an inverse relationship between a property's quality and its cap rate.
- Lower Cap Rates (say, 4-6%): You'll usually see these with Class A properties in prime, high-demand urban centers. Investors are willing to pay more for stability and the potential for appreciation, which pushes property values up and, in turn, drives the cap rate down.
- Higher Cap Rates (think 8-10% or more): These are often tied to Class C properties in less desirable areas or markets that carry more risk. The higher potential return is your compensation for dealing with things like older buildings, tougher tenant profiles, and more hands-on management.
A simple way to think about it: a low cap rate often signals safety and stability, while a high cap rate signals opportunity mixed with higher risk. Neither one is automatically good or bad—it all comes down to your personal investment strategy and how much risk you're comfortable with. For a deeper look, check out our guide on what is a good cap rate.
How Economic Trends Shape Your Returns
The bigger picture matters, a lot. Broader economic conditions, especially interest rates, have a massive impact on property values and returns. When interest rates are low, money is cheap, and that tends to push property prices higher, "compressing" cap rates downward. When rates go up, the opposite happens; cap rates tend to expand as investors demand higher returns to offset their increased cost of borrowing.
We saw this play out perfectly after the Global Financial Crisis. U.S. commercial real estate cap rates jumped to around 8% in 2009-2010 as property values tanked. Fast forward to the late 2010s, and a combination of low interest rates and strong investor demand squeezed those cap rates to historic lows, with multifamily properties hitting just 4.1% in 2021.
Cap Rate Is Only Part of the Picture
While the cap rate is a fantastic tool, it's just one piece of the puzzle. It gives you a clean look at a property's unleveraged return, but it tells you nothing about your financing. That’s where a metric like Cash-on-Cash Return becomes so important.
Cash-on-cash return tells you what you're earning on the actual money you pulled out of your pocket—your down payment, closing costs, and initial repair budget.
For instance, a property with a modest 5% cap rate could actually deliver an incredible 12% cash-on-cash return if you lock in great financing. On the flip side, a high cap rate property might produce a dismal cash-on-cash return if your loan terms are terrible.
Ultimately, think of cap rate as your first-pass filter. It helps you quickly compare apples to apples. Once you've used it to narrow down your options, you can dive deeper into the full process of analyzing real estate deals and conducting due diligence. Using these metrics together is what gives you a complete, 360-degree view of an investment's true potential.
Digging Deeper: Your Cap Rate Questions Answered
Even after you've run the numbers, a few common questions always seem to pop up about cap rates. Getting these details straight is what separates a novice from a pro who can accurately size up a deal.
What’s a “Good” Cap Rate, Anyway?
This is the classic question every investor asks, and the only honest answer is: it depends. There's no magic number. A "good" cap rate is completely relative to the market, the property type, and your own goals.
In a stable, established neighborhood, you might see traditional rentals trade between 4% and 8%. But if you're looking at a short-term rental in a vacation hot spot, you'd want to see a much higher cap rate, maybe in the 8% to 12% range, to make the extra management and risk worthwhile. A 6% cap rate could be a home run in a high-demand city like San Diego, but you might pass on that same deal in a smaller town where higher returns are the norm.
Should I Chase High Cap Rates or Low Ones?
This really comes down to what you're trying to achieve as an investor. It's a classic risk vs. reward tradeoff.
- Higher Cap Rate (10% and up): These deals often promise stronger cash flow right out of the gate. But that higher return usually comes with a catch—more risk. The property might be in a rougher part of town, need a ton of work, or have a history of difficult tenants.
- Lower Cap Rate (4-6%): This usually points to a safer, more stable property in a great location. Think of it as a blue-chip stock. You're giving up some immediate cash flow in exchange for lower risk and a better chance at long-term appreciation.
Neither is inherently better. It all hinges on your personal strategy and how much risk you're comfortable taking on.
Key Insight: Remember that cap rates and property values move in opposite directions. When cap rates in an area rise, property values tend to fall. It's simple math: the same Net Operating Income divided by a lower property price equals a higher cap rate percentage.
How Is Cap Rate Different From Cash-on-Cash Return?
It’s crucial not to confuse these two. They measure completely different things.
Cap rate is the pure, unleveraged return of the property itself. It pretends you paid all cash, so it completely ignores your mortgage. This is why it’s so useful for comparing different properties on an apples-to-apples basis.
Cash-on-cash return, on the other hand, is all about your specific investment. It measures the return you get on the actual cash you put into the deal—your down payment, closing costs, and initial repairs. A property with a modest 5% cap rate could still deliver an awesome 12% cash-on-cash return if you secure a great loan.
Tired of crunching numbers in a spreadsheet? Property Scout 360 does the heavy lifting for you. It instantly calculates cap rate, cash-on-cash return, and a full financial forecast for any property in the U.S. Stop guessing and start finding your next deal with confidence.
About the Author
Related Articles
2026 Investor's Guide: Cost of Installing a Sewer Clean Out
Understand the cost of installing a sewer clean out for investment properties in 2026. Get expert advice on prices, ROI, & budgeting for flips. Plan smart!
15 Year vs 30 Year Mortgage: The Investor's Choice
Deciding between a 15 year vs 30 year mortgage for a rental property? Our guide analyzes cash flow, ROI, and equity to help you pick the best loan.
Real Estate Appraisal Software: Features & Limits
Discover what real estate appraisal software is, its core features, and limits. See how it differs from investment tools for profitable deals.