Build a Pro Real Estate Investment Analysis Spreadsheet
Build a powerful real estate investment analysis spreadsheet from scratch. This guide covers key formulas, scenario testing, and cash flow analysis.
When it comes to sniffing out a good real estate deal from a bad one, nothing beats a solid investment analysis spreadsheet. Think of it as your financial command center. It takes all the scattered data, market assumptions, and property details and translates them into clear, actionable numbers about profitability and risk.
This isn't just about crunching numbers for the sake of it; it's about building the confidence to make smart, data-driven decisions.
Why Your Spreadsheet Is Your Most Powerful Tool

It's tempting for new investors to go with their gut or use napkin math, but that's a quick way to get into trouble. A detailed spreadsheet forces you to look at the cold, hard numbers and confront the financial reality of an investment. It pushes you past the shiny listing price and helps you build a dynamic model of how the property will actually perform over its entire lifecycle.
A well-built spreadsheet provides the structure you need for disciplined analysis. You can systematically check off every financial component of a deal, making sure nothing important gets missed. This kind of detailed underwriting is more crucial than ever. As the market shifts, successful investing is less about riding broad trends and more about drilling down into the fundamentals of each individual asset to uncover real value. As highlighted in the 2025 real estate trends to watch report, this focus on asset-level performance is what separates the winners from the rest.
From Guesswork to Strategic Decisions
The real magic of a spreadsheet is its power to turn your "what-if" questions into concrete financial projections. Instead of just guessing, you can model different scenarios and get precise answers to critical questions.
What happens to my annual cash flow if maintenance costs come in 15% higher than I planned? How much does a 0.5% bump in my mortgage rate really hurt my cash-on-cash return over the next five years?
This level of detail is a game-changer for several reasons:
- Objective Deal Comparison: It lets you line up multiple properties side-by-side and compare them using the same consistent metrics. No more comparing apples to oranges.
- Risk Identification: You can immediately spot a deal's weak points. Is it the over-optimistic vacancy rate? The reliance on aggressive rent growth? The spreadsheet will show you.
- Negotiation Leverage: When you make an offer, you can back it up with data. You can walk a seller through your numbers and show them exactly how you arrived at your valuation based on realistic operating income and expenses.
A spreadsheet doesn't just calculate your potential returns—it tells the financial story of the property. It reveals the plot twists, like an unexpected roof replacement, and helps you write a much more profitable ending.
By building and using this tool, you're creating a repeatable system for success. It’s the foundation for making informed decisions, getting financing approved, and confidently growing your portfolio. For a deeper dive into the basics, check out our complete guide on how to analyze a rental property.
A good spreadsheet doesn't just hold data; it calculates the key performance indicators (KPIs) that tell you whether a deal is worth pursuing. These metrics are the language of real estate investing.
Key Metrics Your Analysis Spreadsheet Will Calculate
| Metric | What It Tells You | Where to Find It in Your Sheet |
|---|---|---|
| Cash-on-Cash Return | The annual pre-tax cash flow you receive relative to the total cash you invested. | Cash Flow Projections |
| Capitalization Rate (Cap Rate) | The property's unleveraged annual return, used to compare similar properties. | Purchase & Income Analysis |
| Net Operating Income (NOI) | The property's profitability before accounting for debt service and taxes. | Income & Expense Statement |
| Internal Rate of Return (IRR) | The total annualized return over the life of the investment, including the final sale. | Returns & Sale Projections |
| Debt Service Coverage Ratio (DSCR) | Whether the property generates enough income to cover its mortgage payments. | Financing & Cash Flow |
Understanding these numbers is what separates amateur investors from the pros. Your spreadsheet will put them all right at your fingertips.
Designing Your Spreadsheet's Control Panel
Think of your spreadsheet not just as a calculator, but as a flight simulator for your real estate deal. The "Inputs" tab is your cockpit—the single place where you control everything. I call it the Control Panel, and building one is absolutely essential if you want a flexible, reusable model.
Why is this so important? When every assumption—from the purchase price down to the annual landscaping budget—lives on this one sheet, you gain an incredible amount of power. If you want to see what a higher interest rate does to your cash flow in year five, you just change one cell. Wondering how a higher vacancy rate hits your overall return? Tweak one number and watch the entire model update instantly. This design saves you from the nightmare of digging through a dozen different formulas on multiple tabs just to test a single assumption.
This approach creates a clear "single source of truth." It cleanly separates what you think will happen (your inputs) from the math that proves it (the engine). This separation is the hallmark of a professional-grade financial model, making it transparent and a whole lot easier to fix if something looks off.
Structuring Your Core Assumptions
To keep things from getting messy, I always group my inputs into three logical categories. This structure isn't just for you; it makes the sheet intuitive for anyone you might share it with, like a lender or a potential partner. It basically tells the story of the deal, from the day you buy it to the day you're running it.
Here are the three main groups I use:
- Purchase & Closing Details: This covers everything related to actually acquiring the property.
- Financing Assumptions: This is where you'll map out the specifics of your loan.
- Operating Projections: This section models the property's financial life, day in and day out.
Let's dig into the essential numbers you'll need for each of these. Honestly, getting these inputs right is the most critical part of the whole process. The old saying "garbage in, garbage out" has never been more true.
Purchase and Financing Inputs
First up, let's detail the purchase itself. You'll start with the obvious one: the Purchase Price. Right below that, I plug in a line for Closing Costs. As a rule of thumb, I budget 2-4% of the purchase price, but this can really swing depending on your state. This line item is a catch-all for title insurance, attorney fees, loan origination, appraisals, and all those other little costs that add up.
Next, you need to outline how you're paying for it. List your Down Payment Percentage (a common figure is 25%), which your spreadsheet will then use to calculate the Loan Amount. Follow that with the loan's Interest Rate and the Loan Term in years (typically 30 for residential). These three numbers are the engine behind your debt service, which is almost always your biggest expense.
Remember, your inputs aren't just numbers in a cell. They are the foundational assumptions your entire investment thesis is built on. A tiny 0.25% difference in your interest rate assumption can be the deciding factor between a great deal and one you should walk away from.
Operating Income and Expense Assumptions
This is where you bring the property to life on paper. Start with the top line: Gross Potential Rent. This is simply your projected monthly rent multiplied by 12. But since no property stays 100% occupied, you immediately need to account for that with a Vacancy Rate assumption. I usually plug in 5-8% to start, which gives me a much more realistic rental income figure.
Then, it's time to list out your annual operating expenses. You have to be brutally honest and thorough here.
- Property Taxes: Don't guess. Look up the actual tax records for the property.
- Property Insurance: Call an agent and get a real quote. It takes ten minutes.
- Repairs & Maintenance: I budget 5-10% of gross rent for the small stuff—the leaky faucets and running toilets.
- Capital Expenditures (CapEx): Set aside another 5-10% for the big-ticket items that wear out over time, like the roof, water heater, or HVAC system.
- Property Management Fees: If you're not managing it yourself, this will typically run you 8-10% of the rent you actually collect.
With a well-structured inputs tab, you’re ready to analyze deals in any market. And the market is certainly active. Global real estate transaction volumes hit a staggering $739 billion over the last year, a 19% jump from the year prior, showing just how much capital is chasing deals. Having a precise model lets you confidently pick out the real opportunities in this busy landscape. You can see more on this in this global real estate trends report.
Building the Financial Projections Engine
Alright, with your assumptions plugged in, it's time to build the engine room of your spreadsheet. This is where the magic happens—where all those inputs from your "Control Panel" tab come to life as a multi-year financial forecast. A solid projection engine is what elevates a simple spreadsheet from a basic expense tracker to a serious analysis tool.
We’re essentially building a pro forma, which is just a fancy term for a forward-looking financial statement. The goal is to project the property's performance over your expected hold period, which is typically somewhere between five and ten years. Getting this right gives you the long-term view, showing you how the investment is likely to perform as it matures.
The whole process is a logical flow. Your initial inputs for the purchase, financing, and operations all feed into this projections engine.
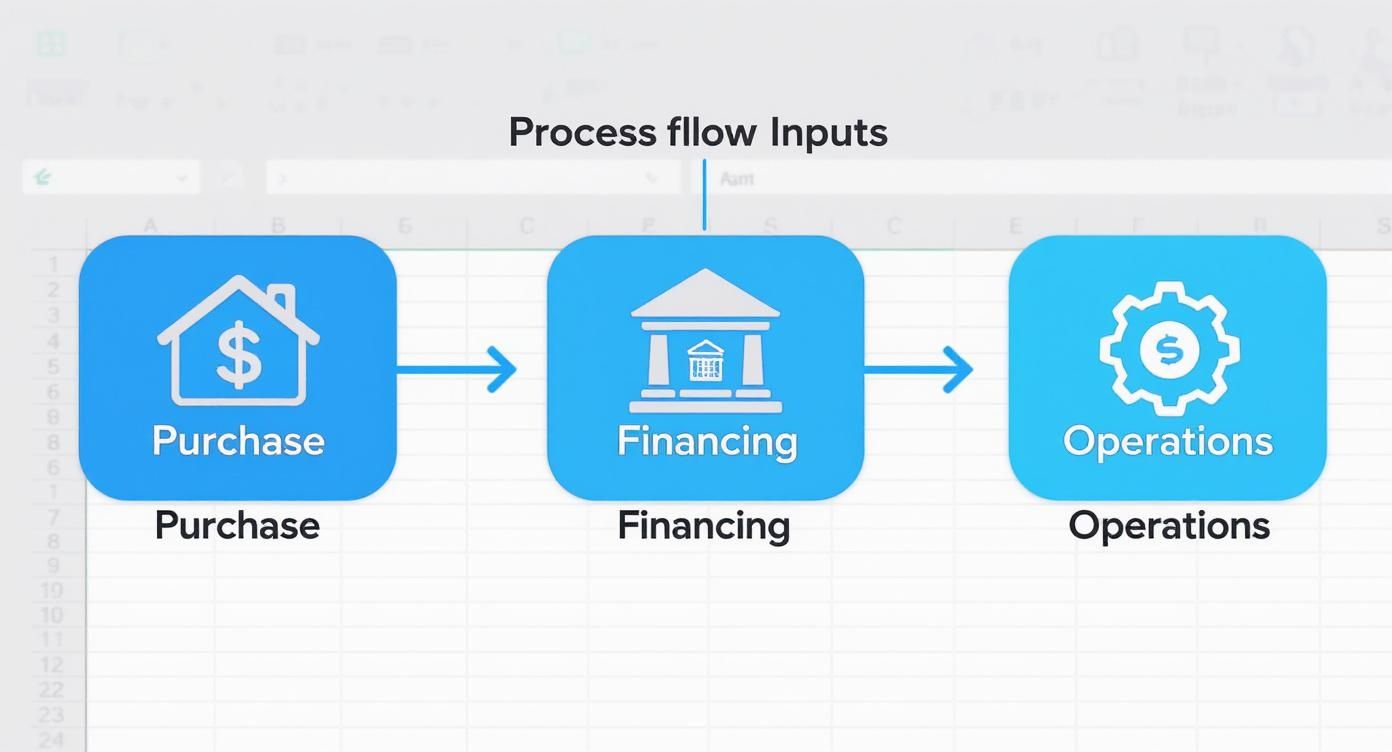
This diagram really drives home why that 'Inputs' tab is so critical. Garbage in, garbage out. Accurate projections absolutely depend on the quality of your initial data.
From Potential Rent to Net Operating Income
First things first, let's figure out your actual revenue. You'll start with the Gross Potential Rent (GPR) you entered on the inputs tab. But no property is 100% occupied 100% of the time, so you immediately subtract your vacancy loss assumption. What's left is your Effective Gross Income (EGI).
From there, you start deducting all your operating expenses (OpEx). It’s a good habit to break these down into clear categories—property taxes, insurance, repairs, management fees, etc.—to keep your pro forma clean and easy to follow. Once you subtract all OpEx from your EGI, you land on the single most important metric for an income property: Net Operating Income (NOI).
Net Operating Income (NOI) is the lifeblood of your investment analysis. It shows you the property's raw profitability, completely separate from your loan. Lenders live and breathe NOI because it tells them whether the asset itself is a winner or a loser, long before they even look at your personal finances.
Having a stable income stream is more critical than ever. The 2025 global real estate outlook highlights how much performance can vary by region. For example, by 2024, real estate yields in developed Asia Pacific markets hit a decade-high, driven by strong rental growth. This just reinforces the value of buying assets with dependable cash flow.
Calculating Your True Cash Flow
NOI is fantastic, but it's not the cash that ends up in your pocket. To get to that number, we have to account for the mortgage. Your projection engine will grab the loan details—amount, interest rate, and term—from your inputs to calculate your total annual debt service (all your principal and interest payments for the year).
Subtract that annual debt service from your NOI, and you've got your Before-Tax Cash Flow (BTCF). This is it. This is the number that tells you how much money you can expect to walk away with each year.
Your spreadsheet will crank out this calculation for every year of your hold period, giving you a clear picture of the investment’s cash-generating power. This annual cash flow is also a crucial ingredient for calculating more advanced return metrics down the road. If you want to get a jump on that, check out our guide on the Internal Rate of Return calculator for real estate.
Calculating the Returns That Actually Matter
So, your spreadsheet’s financial engine is running, and you have years of projected Net Operating Income (NOI) and Before-Tax Cash Flow (BTCF). Great. But what do those raw numbers actually tell you about whether this is a good deal?
This is where your real estate investment analysis spreadsheet really shines. It translates all those projections into the key metrics that every investor, partner, and lender understands. These are the numbers that let you compare different properties, make a compelling case for financing, and confidently decide when to pull the trigger.
The Quick Litmus Test: Capitalization Rate
The first metric almost every investor looks at is the Capitalization Rate, or Cap Rate. Think of it as a quick, back-of-the-napkin way to size up a property’s potential return without getting bogged down by financing details. It’s perfect for comparing similar properties in the same market.
The formula is dead simple:
- Cap Rate = Net Operating Income (NOI) / Purchase Price
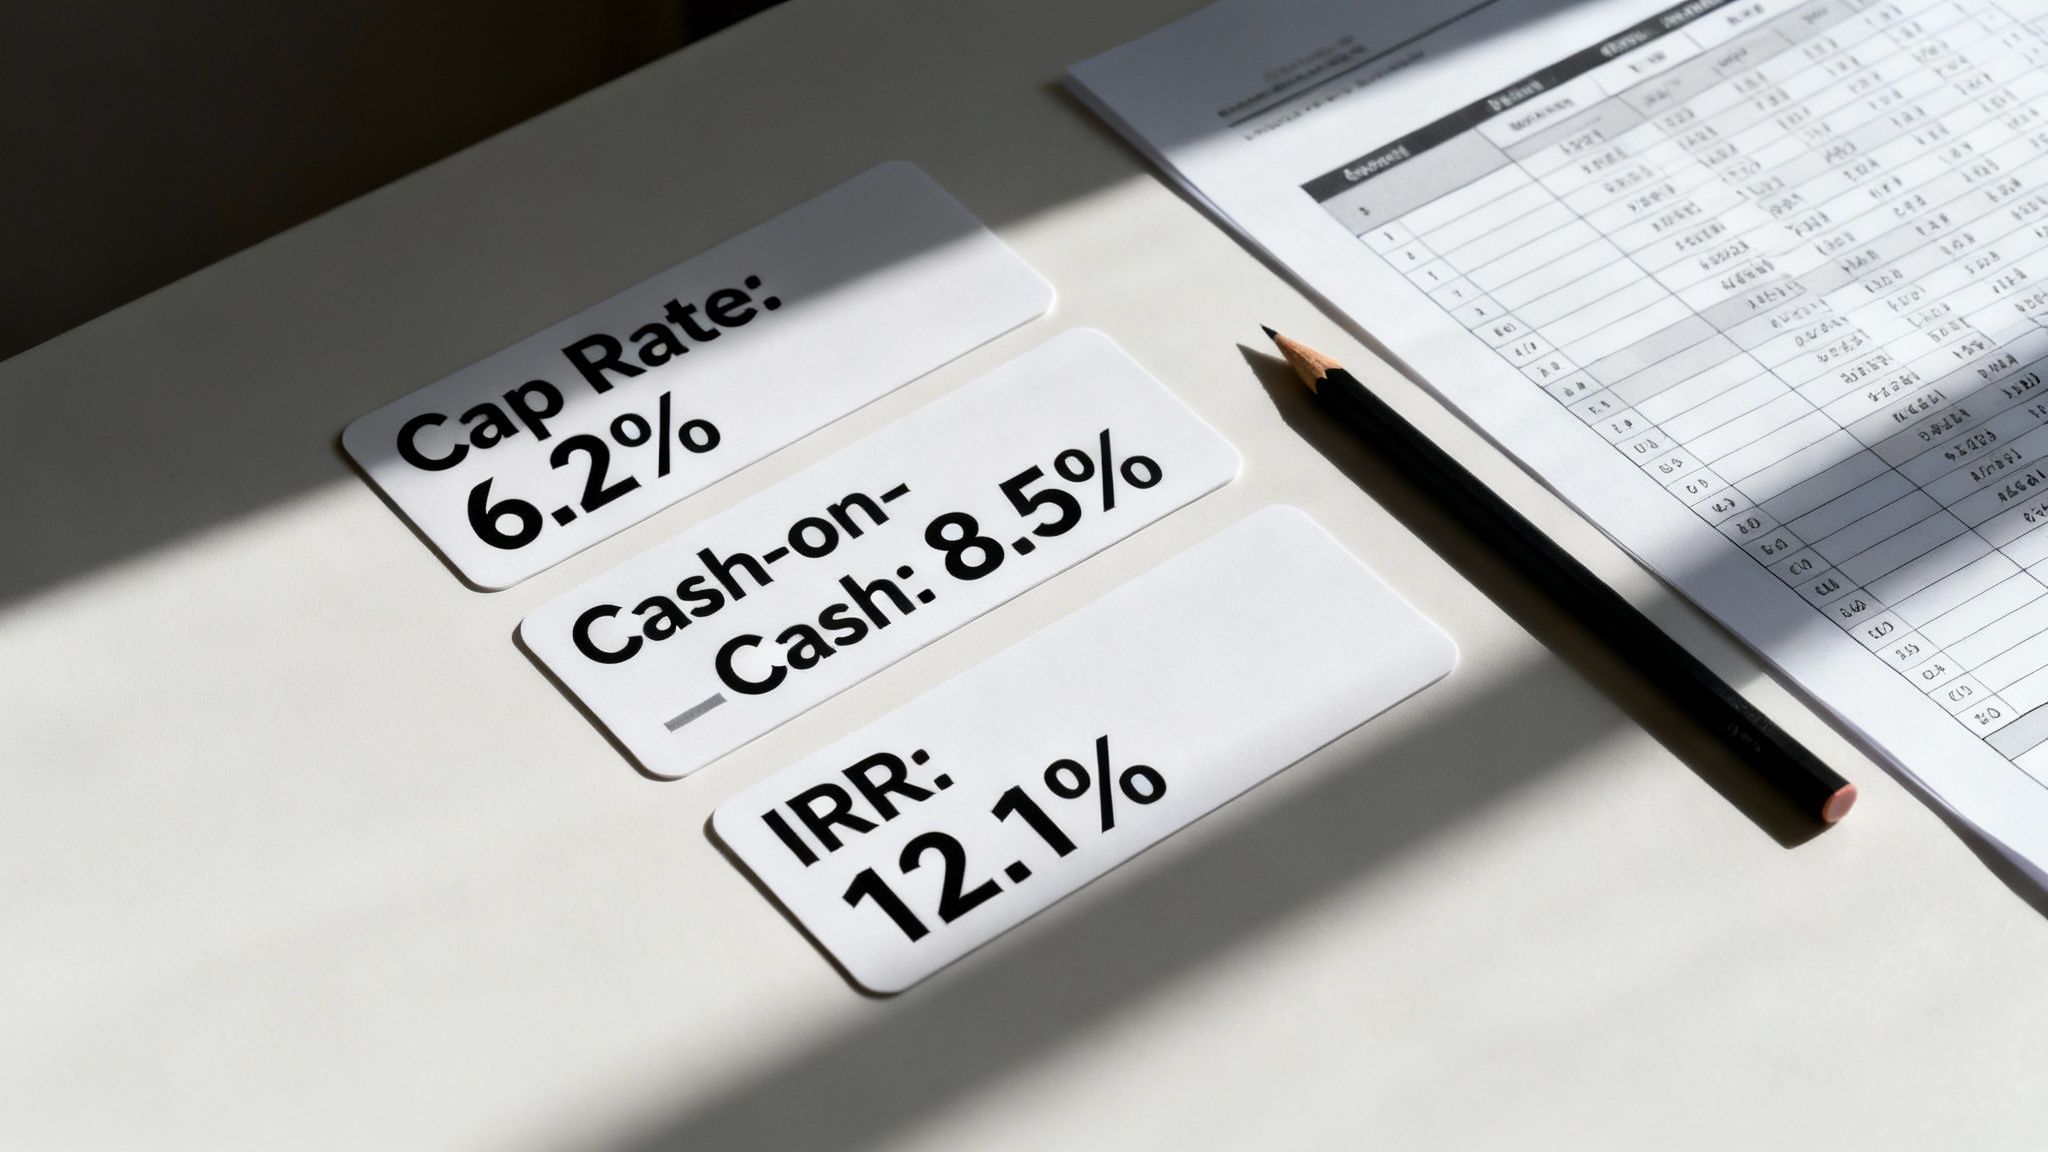
A 6% cap rate tells you the property is expected to generate an annual return equal to 6% of its purchase price, purely from its own operations. Because it ignores your loan, it gives you an apples-to-apples way to judge the asset itself.
Measuring Your Down Payment's Power: Cash-on-Cash Return
While Cap Rate is all about the property, Cash-on-Cash Return is all about your money. It tells you exactly how hard your initial investment—your down payment, closing costs, and any rehab funds—is working for you each year. For many investors focused on building passive income, this is the most important number on the sheet.
Here's the calculation:
- Cash-on-Cash Return = Before-Tax Cash Flow (BTCF) / Total Cash Invested
If you put $100,000 into a deal and it spits out $8,000 in cash flow after all expenses and mortgage payments, your Cash-on-Cash Return is 8%. This single percentage makes it incredibly easy to compare a real estate deal to putting that same money in the stock market. Knowing what is a good cash on cash return for your market is crucial for setting realistic goals.
Seeing the Full Picture: Internal Rate of Return
Cash-on-Cash gives you a snapshot of a single year, but the Internal Rate of Return (IRR) tells the story of the entire investment. It’s the metric that accounts for all your cash flows over the entire time you own the property, plus the profit you make when you eventually sell it.
Think of IRR as the deal's true annualized growth rate. It’s the most comprehensive metric because it factors in the time value of money—acknowledging that a dollar in your pocket today is worth more than a dollar you expect to get ten years from now.
You won't find a simple pen-and-paper formula for IRR. In your spreadsheet, you'll use the =IRR() function, plugging in your series of cash flows (the initial investment as a negative number, followed by all the annual cash flows, and finally the net proceeds from the sale).
The Banker's Favorite Metric: Debt Service Coverage Ratio
Before you get too excited about a deal, you need to know if a bank will even lend on it. That's where the Debt Service Coverage Ratio (DSCR) comes into play. This is the lender’s go-to metric to determine if the property generates enough income to safely cover the mortgage payments.
It’s calculated as:
- DSCR = Net Operating Income (NOI) / Annual Debt Service
Most commercial lenders want to see a DSCR of 1.25x or higher. A ratio of 1.25x means the property’s income is 25% greater than what's needed to pay the mortgage, giving the bank a comfortable safety buffer in case things don't go exactly as planned.
To make these concepts easier to reference, here’s a quick guide to the core metrics we just covered.
Return Metrics Formula and Interpretation Guide
| Metric | Formula | What a 'Good' Number Looks Like |
|---|---|---|
| Cap Rate | Net Operating Income / Purchase Price | Highly market-dependent. 5-8% is common, but can be lower in prime markets or higher in riskier ones. |
| Cash-on-Cash Return | Before-Tax Cash Flow / Total Cash Invested | Aim for 8-12% or higher. Anything above your target return for other investments is a good start. |
| IRR | Use Excel's =IRR() function |
Often targeted in the mid-teens (12-18%+) for stabilized properties, higher for value-add projects. |
| DSCR | Net Operating Income / Annual Debt Service | Lenders typically require a minimum of 1.20x to 1.25x. A higher ratio makes financing easier to secure. |
Having these four metrics calculated and displayed clearly in your spreadsheet will give you a powerful, at-a-glance dashboard to evaluate any potential investment. They tell the complete story, from initial profitability to long-term performance and bankability.
Stress-Testing Your Deal with Scenario Analysis
A static analysis is just a snapshot in time. It's a single prediction based on a perfect set of circumstances that, let's be honest, rarely exists in the real world. As any seasoned investor will tell you, things change.
This is precisely why that centralized 'Inputs' tab is the most powerful feature of your real estate investment analysis spreadsheet. It’s your control panel, allowing you to move beyond a single, hopeful outcome and truly prepare for what the future might throw at you.
https://www.youtube.com/embed/UsbVUOnBy3Y
This is where you run what’s called a sensitivity analysis—a fancy term for stress-testing your deal to see how it holds up under pressure. By tweaking just a few key variables on your Inputs tab, you can instantly model best-case, worst-case, and most-likely scenarios. Since all your calculations are linked back to this one sheet, you see the ripple effects across the entire model in real-time.
Running Practical What-If Scenarios
The goal here isn't to perfectly predict the future. It’s about understanding which variables have the biggest impact on your returns. This process helps you pinpoint what truly drives your profit and where your biggest risks lie, giving you the clarity to move forward, negotiate harder, or walk away.
Here are a few practical "what-if" scenarios I run for every single potential deal:
- Interest Rate Fluctuations: What happens to your cash flow and DSCR if your long-term interest rate ends up 0.75% higher than your initial quote? In a volatile rate environment, this isn't just a possibility; it's a critical test.
- Vacancy Rate Changes: You might have penciled in a 5% vacancy. But what if a major local employer relocates and your vacancy rate suddenly jumps to 10% for a year? Does the deal still work, or are you suddenly feeding the property?
- Unexpected Repair Costs: Let's model a scenario where your annual repairs budget needs to be 50% higher than you projected. This simulates a big-ticket surprise like a full HVAC replacement or a major plumbing headache.
By quantifying the impact of these risks, you transform vague worries into concrete numbers. Knowing that a 1% interest rate hike cuts your annual cash flow by exactly $1,200 is far more powerful than just "feeling nervous about rates."
Identifying Your Deal's Break-Even Points
Another incredibly powerful use of your spreadsheet is to find your break-even points. By playing with the numbers on your inputs tab, you can answer critical questions that define your margin for error.
For example, what's the absolute maximum you can pay for the property and still hit your target 8% cash-on-cash return? Or, what's the minimum occupancy rate you need to maintain a 1.25x DSCR to keep your lender happy?
This isn't just an academic exercise. It’s a strategic tool for setting your negotiation limits and building a truly resilient investment. This is the kind of forward-looking, scenario-based analysis that separates a hopeful gamble from a strategically sound investment.
Answering Your Top Questions About Investment Spreadsheets
Even with a perfectly dialed-in model, questions are going to pop up. Building a solid real estate spreadsheet is one part of the battle; using it with confidence to analyze actual deals is a whole different beast. Let's walk through some of the most common questions I hear from investors once they start putting their models to the test.
What’s the Most Common Mistake When Building an Investment Spreadsheet?
Hands down, the single biggest error is underestimating operating expenses. It's so easy to be optimistic about costs, but that optimism is exactly where deals fall apart on paper and in real life.
Newer investors almost always forget to properly budget for Capital Expenditures (CapEx). These are the big, lumpy, and infrequent costs like replacing a roof, a water heater, or an HVAC system. A solid rule of thumb is to set aside 5-10% of your gross rental income just for these future capital needs.
Another classic pitfall is plugging in unrealistic numbers for vacancy rates and rent growth. Don't just grab a generic national average. Your projections need to be rooted in hard data from the specific neighborhood and submarket you're actually investing in.
How Do I Model the Property Sale and Appreciation?
Calculating your final returns, especially metrics like IRR, absolutely requires you to model the sale at the end of your planned holding period. The first step here is to project a future sale price. A common and reliable way to do this is by using a terminal cap rate, often called an exit cap rate.
Here's how it works: You take the Net Operating Income (NOI) for the year after your planned sale (so, Year 6 NOI for a 5-year hold) and divide it by your assumed exit cap rate. Your exit cap rate is your best guess for what market conditions will look like when you sell. To be conservative, many investors pencil in an exit cap rate that's slightly higher than what they bought the property for.
Once you have that projected gross sale price, you have to subtract the costs of selling. I always budget around 6% for broker commissions and closing fees. After that, subtract the remaining mortgage balance. What's left over is your net sale proceeds—a critical cash inflow that anchors your final year's return calculation.
Should I Use a Template or Build My Own Spreadsheet from Scratch?
Ah, the classic question. Honestly, the best answer for most people is a bit of both—a hybrid approach.
Starting with a well-built, reputable template is a fantastic way for beginners to get going. It saves a ton of time and, more importantly, makes sure you don't accidentally leave out a critical formula or component.
But the real, deep learning comes when you build your own real estate investment analysis spreadsheet from the ground up. That process forces you to understand what every single formula is doing and why every assumption matters. That kind of intimate knowledge is what helps you spot risks and opportunities that a pre-made template might hide.
My advice? Start with a template to get familiar with the layout. Then, take it apart piece by piece and rebuild it to make it your own.
Ready to stop wrestling with complex formulas and start analyzing deals instantly? The Property Scout 360 platform automates everything we've discussed, from cash flow projections to scenario analysis. Find and evaluate profitable U.S. properties in minutes, not days. Explore the tool that eliminates weeks of manual spreadsheet work at https://propertyscout360.com.
About the Author
Related Articles
2026 Investor's Guide: Cost of Installing a Sewer Clean Out
Understand the cost of installing a sewer clean out for investment properties in 2026. Get expert advice on prices, ROI, & budgeting for flips. Plan smart!
15 Year vs 30 Year Mortgage: The Investor's Choice
Deciding between a 15 year vs 30 year mortgage for a rental property? Our guide analyzes cash flow, ROI, and equity to help you pick the best loan.
Real Estate Appraisal Software: Features & Limits
Discover what real estate appraisal software is, its core features, and limits. See how it differs from investment tools for profitable deals.