Build a Smarter Rental Property Analysis Spreadsheet
Go beyond basic calculators. This guide shows you how to build and use a rental property analysis spreadsheet to find profitable investment properties.
A good rental property analysis spreadsheet is more than just a calculator; it's a financial model that takes you from hopeful guesswork to data-driven decisions. It’s what lets you accurately forecast cash flow, size up potential risks, and compare different properties on a level playing field. At the end of the day, it ensures your choices are based on solid numbers, not just a promising first impression.
Why Gut Feelings Don't Work in Real Estate

It’s so easy to get swept up in the excitement of a potential rental property. You tour a house, see the new quartz countertops and fresh paint, and your gut screams, "This is the one!" But relying on intuition alone is one of the most common—and costly—mistakes any real estate investor can make.
Real estate is a numbers game. Emotions have no place in a sound financial decision.
A quick "back-of-the-napkin" calculation, where you just subtract the mortgage from the rent, is dangerously incomplete. This overly simplistic approach ignores a dozen other costs lurking below the surface that can quickly turn a profitable-looking deal into a money pit.
Moving Beyond Simple Math
To really get the full picture of a property's potential, you need a system. A process that forces you to account for every single variable. This is where a comprehensive rental property analysis spreadsheet becomes your most valuable tool. Think of it as your financial co-pilot, helping you navigate past emotional biases and toward objective clarity.
It’s the difference between guessing the weather by looking out the window and reading a detailed meteorological forecast. Your gut feeling might say it looks sunny, but the forecast—your spreadsheet—warns you about the thunderstorm rolling in later.
A proper analysis forces you to consider the things you’d rather ignore:
- Vacancy Rates: No property stays rented 100% of the time. People move. Factoring in a realistic vacancy rate, often 5-10%, gives you a much more honest income projection.
- Capital Expenditures (CapEx): That roof, the HVAC system, the water heater... they don't last forever. You absolutely must set aside funds for these big-ticket replacements to ensure long-term stability.
- Ongoing Maintenance: From a leaky faucet to touching up paint between tenants, the small repairs and upkeep costs add up. A smart analysis budgets for these routine expenses.
- Property Management Fees: Even if you plan to self-manage, your time isn't free. And if you hire a professional, that fee comes directly off your bottom line.
A well-structured spreadsheet doesn’t just organize numbers; it tells a story about the property's financial future. It reveals the true cash flow, potential return on investment, and the point at which the property becomes profitable.
The Power of Objective Comparison
Let's say you're looking at two different properties. Property A has higher rent but it's older and will likely need more repairs. Property B brings in less rent but it’s newly renovated. Your gut might lean toward the higher rent, but a spreadsheet lets you run an apples-to-apples comparison.
Once you plug in all the numbers—purchase price, financing details, taxes, insurance, and estimated maintenance for both—you can see which one actually delivers the better cash-on-cash return or a higher capitalization rate.
This data-driven approach removes the guesswork. It empowers you to confidently walk away from deals that look good on the surface but crumble under scrutiny, and to spot the true gems that other, less disciplined investors might overlook. Ultimately, a thorough analysis is the bedrock of a successful real estate portfolio, ensuring every investment is a calculated step toward your financial goals, not just a hopeful leap of faith.
Getting the Right Numbers for Your Analysis
Any good rental property spreadsheet is a powerful machine, but it has one critical weakness: it's only as smart as the numbers you put into it. The old "garbage in, garbage out" saying has never been truer than in real estate investing. One bad assumption or a single overlooked expense can completely wreck your projections, turning what looked like a home run into a financial headache.
If you want to build a financial model that reflects reality, not just wishful thinking, you have to do the legwork. This means digging for precise, local data that goes way beyond the purchase price and a ballpark rent estimate.
Before you can crunch any numbers, you need to collect all the essential data points. Think of this as gathering the ingredients for your recipe—miss one, and the whole thing will be off.
Below is a quick-reference table outlining the crucial information you'll need and where you can typically find it.
| Data Point | Description | Where to Find It |
|---|---|---|
| Purchase & Financing | The core numbers of the deal: price, down payment, loan terms. | Your offer letter, loan estimate from your lender. |
| Gross Scheduled Rent | The absolute maximum rent you could collect in a year. | Free real estate comps, Zillow, Rentometer, local property managers. |
| Vacancy Rate | The percentage of time you realistically expect the property to be empty. | Local property managers, real estate investor forums (like BiggerPockets). |
| Property Taxes | The annual taxes owed. Crucial: Use the post-sale estimate. | The county assessor's or tax collector's website. |
| Property Insurance | The cost for a landlord or dwelling fire policy. | Call an insurance agent for a direct quote. Don't guess. |
| Repairs & Maintenance | Budget for ongoing upkeep (leaky faucets, broken outlets). | Rule of thumb: 1% of property value annually or 5% of gross rent. |
| Capital Expenditures | Savings for big-ticket items (roof, HVAC, water heater). | Rule of thumb: Budget another 5-10% of gross rent. |
| Property Management | Cost to hire a pro to manage the property and tenants. | Get quotes from local property management companies. |
| HOA Fees | Dues if the property is in a homeowners' association. | The property listing or by contacting the HOA directly. |
| Utilities | Any services you, the landlord, will be responsible for paying. | The listing or by asking the seller/agent. |
Getting these details right from the start is what separates a confident, informed investment decision from a hopeful gamble.
Nailing Down Your Acquisition and Financing Costs
First things first, let's lock down the numbers tied directly to buying the property. These figures are the foundation of your entire analysis, so getting them right is non-negotiable.
Here are the essentials you need to track down:
- Purchase Price: This one's easy—it's the price you and the seller agree on.
- Down Payment: How much cash you're bringing to the table, both as a percentage and a final dollar amount.
- Loan Amount: The total mortgage you're taking out.
- Interest Rate: Your specific mortgage rate.
- Loan Term: The length of the loan, usually 15 or 30 years.
- Closing Costs: These are the silent killers of many deals. Budget 2-5% of the loan amount for things like appraisal fees, title insurance, and loan origination charges.
With these figures in hand, you can accurately calculate your monthly mortgage payment (principal and interest), which is almost always your largest single expense.
How to Realistically Estimate Your Income
Figuring out your income seems straightforward—it’s just the monthly rent, right? Not so fast. A truly realistic income projection has to account for the time your property sits empty. This is easily the most common mistake I see new investors make.
Your starting point is the Gross Scheduled Rent—the total potential rent you'd collect if your property was occupied 100% of the time. For a house renting at $2,000 per month, that's a $24,000 annual figure.
But no property stays occupied 100% of the time. You have to subtract a Vacancy Rate, which is the percentage of time you expect the unit to be empty between tenants. I always budget a conservative 5-10%, but this can vary wildly based on your local market. The best way to get a real number is to call a few local property managers and ask what they're seeing. To get a better feel for your market, you can learn more about finding free real estate comps to guide your rent estimates.
Never, ever assume 100% occupancy. Building a vacancy buffer into your rental property analysis spreadsheet is the single most important thing you can do for an accurate cash flow forecast. It’s your safety net.
Uncovering Every Single Operating Expense
This is where the real detective work begins, and it’s what separates the pros from the amateurs. Operating expenses are all the ongoing costs of keeping the property in service, and they add up fast. Forgetting just one or two can completely wipe out your profit margin.
Here’s a checklist of the usual suspects to hunt down:
- Property Taxes: Don't just use the seller's current tax bill. A sale almost always triggers a tax reassessment. Go directly to the county assessor’s website to find the correct tax rate.
- Property Insurance: Call an insurance agent and get a real quote for a landlord policy. Don't pull a number out of thin air.
- Repairs and Maintenance: Things break. For routine stuff, a good rule of thumb is to set aside 1% of the property’s value each year. Another common method is to budget 5-10% of the gross rent.
- Capital Expenditures (CapEx): This isn't the same as maintenance. This is your savings fund for the big-ticket items that wear out over time, like a roof ($10,000+), an HVAC system ($8,000+), or a water heater ($1,500+). I set aside another 5-10% of gross rent specifically for CapEx.
- Property Management Fees: Even if you plan to self-manage, your time isn't free. If you hire a pro, expect to pay 8-12% of the collected monthly rent.
- HOA Fees: If the property is in a community with an HOA, you need to know the exact monthly or annual dues. These can be a significant expense.
- Utilities: Are you, the landlord, paying for water, sewer, or trash? Find out which utilities are your responsibility.
By tracking down these specific, verified numbers, you turn your spreadsheet from a simple guess into a true financial forecasting tool. This is how you invest with clarity and confidence.
Building Your Core Financial Metrics And Formulas
Alright, you've done the legwork and gathered all your raw data. Now for the fun part—making those numbers talk. This is where your spreadsheet goes from a simple data list to a powerful analysis engine. By setting up the right formulas, you’ll be able to see the real story behind a property's potential.
The whole idea is to take your inputs—property details, financials, market data—and feed them into a model that spits out the metrics that matter.
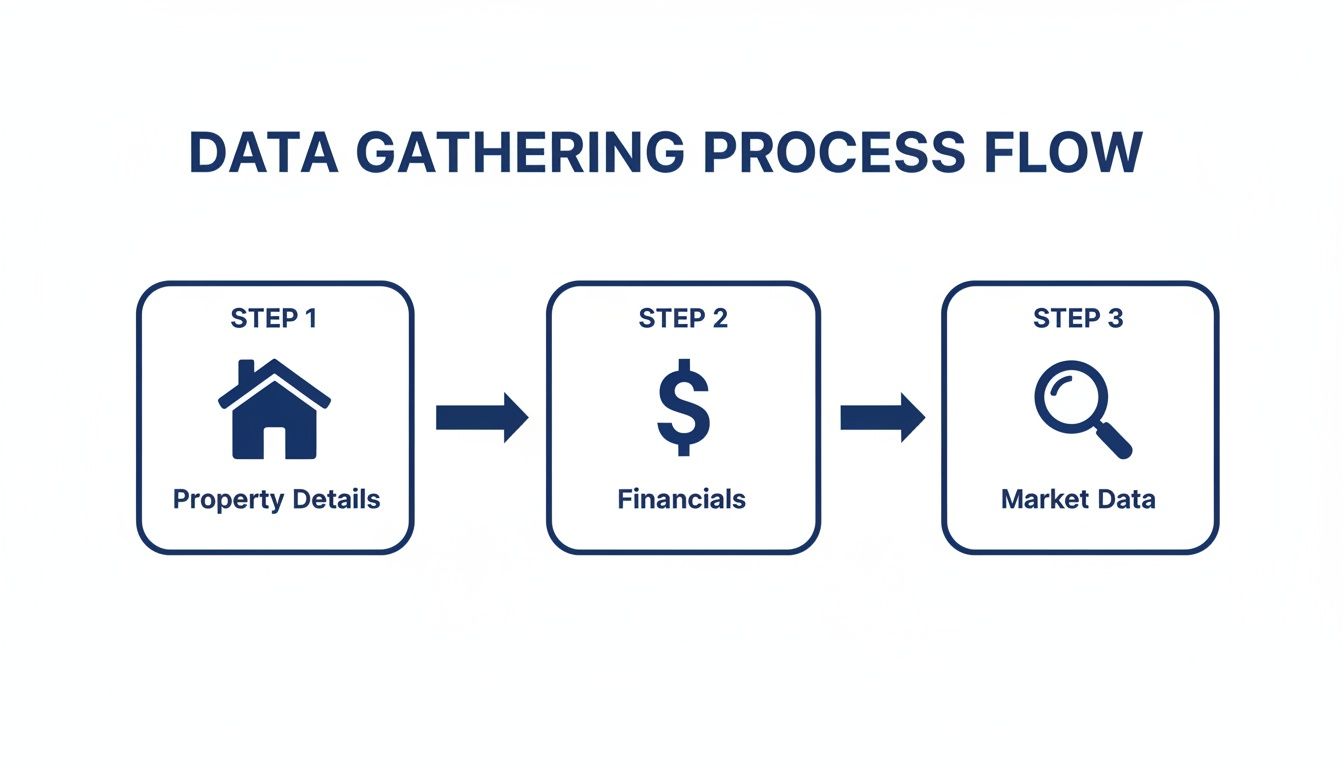
As you can see, you can't get to the good stuff without a solid foundation of data. Let's start building.
Calculating Net Operating Income (NOI)
First up, and arguably most important, is your Net Operating Income (NOI). I like to think of NOI as the property's pure, unlevered profit—what it earns before you even think about your mortgage or taxes. It's the bedrock of almost every other calculation we'll do.
To get to NOI, we first need to figure out the Effective Gross Income (EGI). This is simply the total potential rent, minus an allowance for when the property sits empty.
- EGI Formula:
Gross Scheduled Rent - (Gross Scheduled Rent * Vacancy Rate) - Real-World Example: Let's say a property could rent for $2,000/month ($24,000/year). If you assume an 8% vacancy rate for your area, your EGI is $22,080.
With your EGI in hand, you just subtract all your operating expenses. And remember, the mortgage payment isn't an operating expense.
- NOI Formula:
Effective Gross Income - Total Operating Expenses - Real-World Example: Using our EGI of $22,080, let's say annual expenses (taxes, insurance, repairs, etc.) add up to $9,500. Your NOI is $12,580.
That one number, $12,580, tells you exactly how much cash the asset itself produces each year.
Determining Your True Cash Flow
NOI is great, but it doesn't tell you what you'll actually put in your pocket at the end of the day. For that, we need to calculate Cash Flow. This is the metric that accounts for your financing costs—the mortgage you pay every month.
The formula couldn't be simpler.
- Cash Flow Formula:
Net Operating Income - Total Debt Service - What's Debt Service? It’s just your total mortgage payments (both principal and interest) for the year.
Continuing our example, if your annual mortgage payments come to $10,200:
- Example Calculation:
$12,580 (NOI) - $10,200 (Debt Service) = $2,380 Annual Cash Flow
This means after every single bill is paid, you're left with $2,380 in profit for the year. That breaks down to about $198 per month. This is the number that confirms whether the investment is actually paying you. To go deeper on this, check out this practical guide to rental property cash flow analysis.
Your cash flow is the lifeblood of your investment. Positive cash flow means the property is paying for itself and putting money in your account. Negative cash flow means you're feeding it from your own pocket every month.
Measuring Returns With Cap Rate And Cash-on-Cash
Now we can calculate the two metrics that investors obsess over: Capitalization Rate (Cap Rate) and Cash-on-Cash Return. These tell you how hard your money is really working for you.
Capitalization Rate (Cap Rate)
The Cap Rate is a quick-and-dirty way to measure a property's unleveraged rate of return. It’s perfect for comparing different properties on an apples-to-apples basis, without financing clouding the picture.
- Cap Rate Formula:
(Net Operating Income / Purchase Price) * 100 - Example Calculation: If you bought the property for $250,000, the Cap Rate would be
($12,580 / $250,000) * 100 = 5.03%.
A 5.03% cap rate gives you a benchmark. You can look at other deals on the market and immediately see if this one is in the same ballpark.
Cash-on-Cash Return
This is the big one for anyone using a loan. It answers the most important question: "What's the return on the actual money I pulled out of my bank account?" It measures your profit against your down payment, closing costs, and any initial rehab money.
- Cash-on-Cash Return Formula:
(Annual Cash Flow / Total Cash Invested) * 100 - Example Calculation: If your all-in cash was $55,000 (a 20% down payment plus closing costs), your return is
($2,380 / $55,000) * 100 = 4.33%.
Most investors I know look for a cash-on-cash return somewhere between 8% and 12%, though what’s considered "good" really depends on your specific market and strategy. You can learn more about this vital metric in our guide to calculating rental property ROI.
Once you build these formulas into your spreadsheet, it becomes a dynamic tool. You can now tweak any input—change the purchase price, adjust the vacancy rate, or play with the rent—and instantly see how it ripples through to your bottom line.
Using Advanced Analysis to Make Better Decisions
A basic analysis tells you if a property might be a good deal, but an advanced one reveals if it can actually withstand reality. Once you've got your core metrics locked in, it's time to transform your rental property analysis spreadsheet from a simple calculator into a serious decision-making tool. This is how you stress-test an investment and move forward with real confidence.

We're going to build out two features that separate the amateur spreadsheets from the pro-grade models: a loan amortization schedule and a sensitivity analysis table. These additions aren't just for show; they help you plan for much more than just the best-case scenario.
Mapping Your Loan with an Amortization Schedule
Ever wonder how much of your mortgage payment is actually paying down the loan versus just feeding the bank interest? That's what an amortization schedule shows you—month by month, for the entire life of the loan.
This isn't just a financial curiosity. It’s incredibly valuable for understanding how your equity builds over time. In the first few years of a 30-year mortgage, a shocking amount of your payment is pure interest. Seeing this breakdown can be a powerful motivator and a critical planning tool.
Building one is easier than you might think using your spreadsheet's built-in functions:
- Principal Payment: Use the
PPMTfunction. It calculates the principal portion of a payment for any given period. - Interest Payment: The
IPMTfunction does the same, but for the interest portion. - Ending Balance: This is just the beginning balance for the month minus that month's principal payment.
When you map this out for all 360 months of a 30-year loan, you can pinpoint the exact moment your payments start making a real dent in the principal. This data is also crucial for calculating your total return if you plan to sell the property down the road.
Stress-Testing Your Deal with Sensitivity Analysis
Here’s a hard truth I've learned over the years: your initial assumptions will probably be wrong. Not totally off, but a few percentage points here or there can make a huge difference. A sensitivity analysis is your way of asking, "What if?"
It’s a simple table that shows how your key returns—like cash flow and cash-on-cash return—swing when your core assumptions change. This is how you prepare for the unexpected and understand what your investment's true risk profile looks like.
A sensitivity analysis transforms your spreadsheet from a static snapshot into a dynamic risk-assessment tool. It prepares you for market shifts and helps you define your margin of safety before you ever sign the closing papers.
You can model tons of variables, but the ones that will have the biggest impact are almost always the vacancy rate, interest rate, and rental income.
Example Sensitivity Analysis on Vacancy Rate
Let's say your base assumption for vacancy is a comfortable 5%. That's great, but what happens if the local market softens and it jumps to 8% or even 10%? A sensitivity table shows you the financial impact instantly.
Here's a look at how those small changes can cascade through your returns.
| Vacancy Rate | Annual Gross Rent | Annual Cash Flow | Cash-on-Cash Return |
|---|---|---|---|
| 3% (Best Case) | $23,280 | $3,180 | 5.78% |
| 5% (Base Case) | $22,800 | $2,380 | 4.33% |
| 8% (Worse Case) | $22,080 | $1,580 | 2.87% |
| 10% (Worst Case) | $21,600 | $780 | 1.42% |
Looking at this, you know immediately that a jump to a 10% vacancy rate cuts your cash-on-cash return by nearly two-thirds. Maybe that's a risk you're willing to take, but now you're making an informed decision, not just crossing your fingers.
This level of detailed modeling is essential because real estate is so local. Historical performance is a useful guide, but yields vary wildly by location. For instance, cap rates for multifamily properties in major U.S. cities might hover around 3.5%–4.5%, while gross rental yields in parts of Spain could hit 6%–8%. Your spreadsheet's sensitivity matrix lets you model these scenarios, showing how a tiny shift of just 0.5% in cap rate or 2% in vacancy can dramatically alter your long-term returns. You can find more insights about how global property investment outlooks influence these models.
By building these advanced features into your rental property analysis spreadsheet, you get a much deeper understanding of the mechanics of your investment. You can see not just what you hope will happen, but what could happen—and that means you'll be prepared for it.
Integrating Real-World Market Data and Trends
Your rental property analysis spreadsheet is a powerful machine, but it’s operating in a vacuum until you feed it real-world context. The numbers inside your model—rent growth, vacancy rates, appreciation—aren't just abstract figures; they're direct reflections of a living, breathing market. To transform your spreadsheet from a simple math exercise into a true forecasting tool, you have to anchor your assumptions in solid, localized data.
Relying on generic, nationwide averages is one of the most common mistakes I see. A 3% annual rent increase might be a national talking point, but it's completely meaningless if your target neighborhood is seeing 7% growth from a local job boom. On the flip side, what if a massive new apartment complex is about to flood the market with supply? The key is to think micro, not macro. Your analysis needs to reflect the unique economic DNA of the specific city, and even the specific zip code, where you plan to invest.
Finding Reliable Local Data Sources
The good news is you don't need a PhD in economics to track down this information. It’s often publicly available if you just know where to look. Your mission is to find data that can either validate or challenge the assumptions you've plugged into your spreadsheet.
Here are some of my go-to sources for grounding an analysis in reality:
- Local Real Estate Agent Associations: These groups often publish quarterly or annual reports packed with hyper-local stats on median sale prices, days on market, and inventory levels. This is gold for projecting appreciation.
- Property Management Companies: This is my favorite trick. Call a few local property managers and just ask them about the market. What are the current vacancy rates for the type of property you're considering? What rent increases are they successfully getting on renewals? They're on the front lines and know what's really happening.
- U.S. Census Bureau Data: Tools like data.census.gov are incredible for getting deep insights into population growth, median household income, and employment trends for a specific city or county. A growing population and rising incomes are strong leading indicators of future rental demand.
This process is all about replacing guesswork with evidence. If you budgeted for a 5% vacancy rate but every property manager you talk to says the market is closer to 8%, you must update your spreadsheet. That single adjustment can completely change your cash flow projections and turn a "go" into a "no-go" decision.
Translating Macro Trends into Spreadsheet Inputs
While local data is king, you can't ignore the bigger picture. Broader economic trends provide the overarching context for your long-term forecasts. For example, macro-level statistics are vital for anchoring your assumptions about rent growth and overall market risk. The global real estate rental market was estimated at roughly USD 2.91 trillion and is projected to grow significantly, which gives investors long-term confidence. But the data also shows that real rent movements can diverge wildly by country—or even by city. An investor in the U.S. might use a very different rent forecast than one in the U.K., making any one-size-fits-all assumption a recipe for disaster. You can dive deeper into these global market dynamics and projections.
The art of a great rental property analysis is blending broad economic tailwinds with specific, on-the-ground data. One informs your long-term confidence, while the other dictates your immediate financial reality.
For instance, a global housing shortfall might support high occupancy rates over the long run, but local zoning laws and new construction projects are what determine the immediate supply in your target neighborhood. Finding that balance is what makes a financial model truly robust. And once you've found a great investment, knowing how to market rental properties effectively is the next critical step to hitting your projected returns.
This research directly feeds your inputs. If you're analyzing a property in a high-growth area, you can feel confident projecting a 4-5% annual rent increase. Conversely, in a stagnant market, a more conservative 1-2% is far more realistic. Making these informed adjustments is what separates a disciplined investor from a speculator. If you're looking for areas with strong fundamentals to begin with, check out our guide on the best cities to invest in rental property.
Answering Your Top Rental Property Spreadsheet Questions
Even with a perfect spreadsheet, the numbers can feel overwhelming. Real estate is full of nuance, and a good analysis always sparks more questions. Let's dig into some of the most common ones I hear from investors.
If You Could Only Pick One Metric, What Would It Be?
This is a tough one, but if I were stranded on a desert island and could only look at one number to evaluate a deal, it would be the Cash-on-Cash Return.
Why? Because it answers the single most important question every investor has: "For every dollar I pull out of my pocket, how much do I get back each year?"
Cap Rate is great for comparing properties on an even playing field (without financing), and NOI is the engine of the whole analysis. But Cash-on-Cash Return is the true test of your investment's performance against your actual cash outlay. A deal might have a respectable Cap Rate, but terrible financing can tank your Cash-on-Cash Return. It cuts right through the noise.
For many experienced investors, if a deal doesn't hit their minimum Cash-on-Cash threshold—often somewhere between 8% and 12%—they won't even give it a second look.
How Do You Actually Budget for Major Repairs?
Budgeting for big-ticket items—what we call Capital Expenditures (CapEx)—is absolutely non-negotiable. Getting hit with a surprise $10,000 bill for a new roof can wipe out your cash flow for an entire year if you haven't planned for it.
Here are the two most common ways to build this into your spreadsheet:
- The Percentage Method: This is the quick-and-dirty approach. You simply set aside 5-10% of the gross monthly rent specifically for future big repairs. It's simple and it works.
- The Itemized Method: This takes more effort but is far more accurate. You list out the major components (roof, HVAC, water heater, etc.), estimate their replacement cost and remaining lifespan, and calculate a monthly savings amount for each.
Whichever path you choose, the key is to treat that monthly CapEx savings like any other bill. It's not optional.
Never treat your CapEx fund like a bonus. It’s a real operating expense. Failing to fund it just means you're borrowing from your future self, and trust me, that bill always comes due.
How Often Should I Update My Analysis Spreadsheet?
Your rental property spreadsheet isn't a "set it and forget it" tool. For a property you own, you should be dusting it off and updating it at least once a year. Think of it as an annual financial physical for your investment.
You should also update it anytime a major financial event happens, like a big rent increase or a property tax reassessment.
During your annual review, make sure you're updating:
- Actual Rental Income: How did your real income stack up against your projections?
- Actual Expenses: Did maintenance, taxes, or insurance cost more or less than you budgeted?
- Current Market Rent: What are similar units renting for right now? This is critical for deciding on lease renewal increases.
This yearly check-up keeps your financial picture sharp and helps you see if the property is truly performing the way you expected.
Do I Really Need a Complex Spreadsheet for Just One House?
You definitely don't need a spreadsheet with 15 tabs and complex macros for a single-family rental. But you absolutely need something more robust than the back of a napkin.
The core principles we've covered here—calculating NOI, Cash Flow, Cash-on-Cash Return, and budgeting for CapEx—are just as critical for one house as they are for a hundred units.
A clean, well-organized, single-tab spreadsheet is more than enough. It's not about complexity; it's about having the financial discipline to make sure you haven't overlooked a critical expense that could turn a good deal into a bad one.
Building a great spreadsheet takes some upfront work, but it’s the bedrock of any smart investment strategy. For those who want to skip the manual setup, Property Scout 360 provides instant, deep analysis on any residential property in the U.S., saving you hours of time. You can find your next profitable investment in minutes.
About the Author
Related Articles
2026 Investor's Guide: Cost of Installing a Sewer Clean Out
Understand the cost of installing a sewer clean out for investment properties in 2026. Get expert advice on prices, ROI, & budgeting for flips. Plan smart!
15 Year vs 30 Year Mortgage: The Investor's Choice
Deciding between a 15 year vs 30 year mortgage for a rental property? Our guide analyzes cash flow, ROI, and equity to help you pick the best loan.
Real Estate Appraisal Software: Features & Limits
Discover what real estate appraisal software is, its core features, and limits. See how it differs from investment tools for profitable deals.