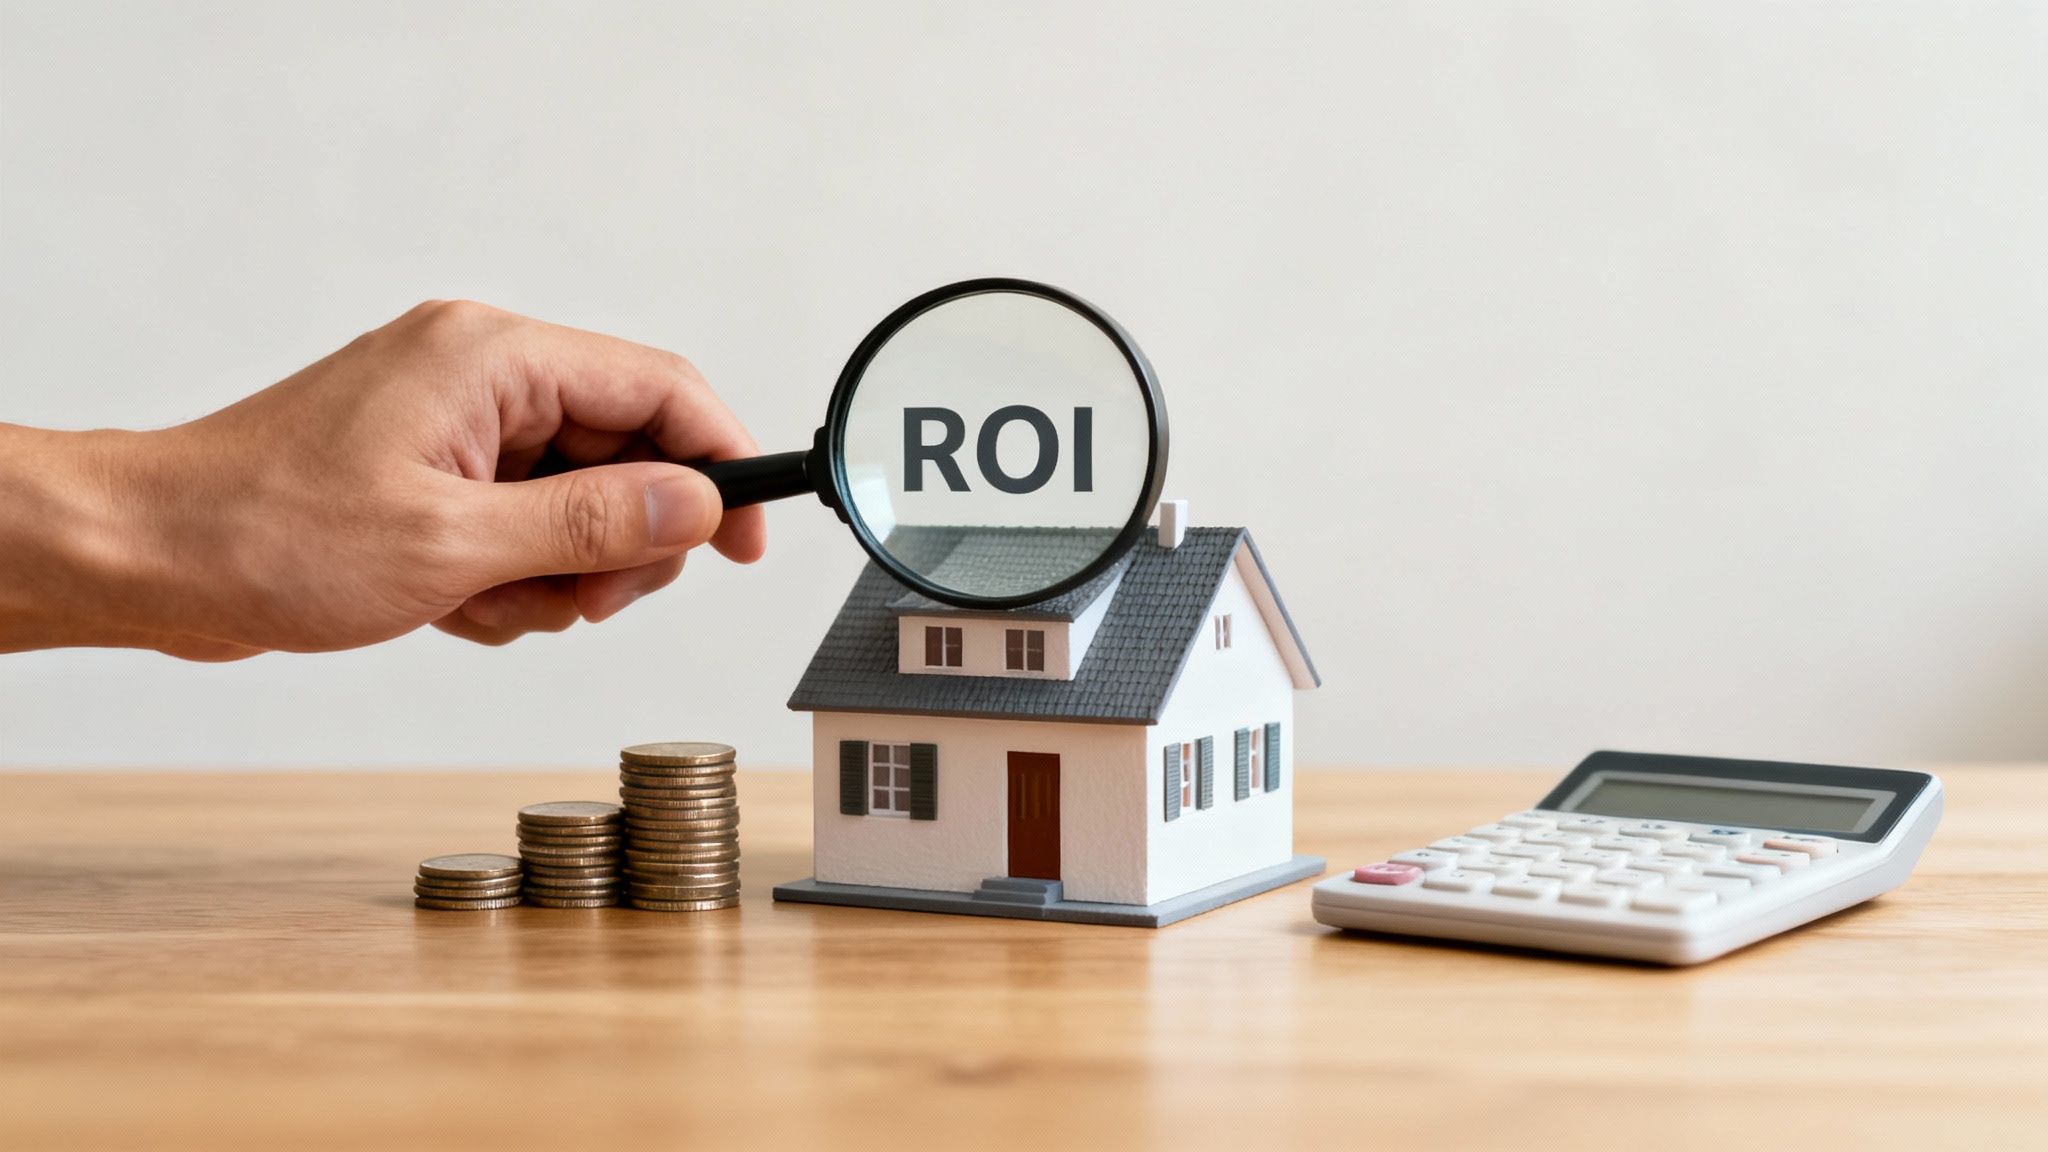
Calculating Rental Property ROI a Practical Guide for Investors
Learn how to master calculating rental property ROI with real-world examples. This guide breaks down cap rate, cash-on-cash return, and common pitfalls.
Figuring out the ROI on a rental property isn't just about subtracting your costs from the rent you collect. It's about getting a clear, honest look at the financial health of your investment. The two most important yardsticks you'll use are cash-on-cash return, which shows you how well the actual money you put in is performing, and the capitalization rate (cap rate), which gives you a snapshot of the property's profitability without any loans factored in. Getting these calculations right is the first real step toward making smart, data-driven decisions in real estate.
Why Mastering ROI Is Your Most Important Investment
Having just a vague idea of your return on investment is a massive gamble in this business. It's all too easy to get caught up in the excitement of those monthly rent checks, but if you don't have a firm grip on your actual ROI, you're essentially flying blind. Think of this metric as your financial compass—it should guide every single decision you make, from buying a property to eventually selling it.
Seasoned investors don't rely on gut feelings; they rely on analysis. They know that a property's true worth is proven by its performance, something you can only measure with accurate, repeatable calculations. This guide will break down the real metrics that separate the profitable investors from the ones who are just spinning their wheels. We're going to unpack the essential formulas and show you not just what they are, but what they really tell you about an investment's health.
Beyond a Simple Percentage
One of the biggest mistakes I see new investors make is treating ROI as a single, static number. It's not. It's more like a story told from a few different angles, with each one giving you a unique insight into how your property is doing.
Here are the key perspectives you need to understand:
- Cash-on-Cash Return: This is the big one, especially if you're using a mortgage. It tells you exactly how hard your down payment and closing costs are working for you.
- Cap Rate: This metric levels the playing field. It lets you compare the raw earning potential of different properties, stripping away the specifics of your financing.
- Total ROI: This is the long-term view. It pulls everything together—your cash flow, the equity you build as you pay down the loan, and any appreciation in the property's value over time.
A property with fantastic on-paper appreciation but negative cash flow every month isn't an asset; it's a liability draining your bank account. True financial success in rentals comes from understanding how all the numbers fit together.
The Real-World Impact of Miscalculation
It's amazing how quickly a good deal can turn sour. Imagine you overlook one hidden cost, like an aging roof that will need replacing in two years, or you underestimate how much property taxes will jump in a hot market. A deal that looked profitable on a spreadsheet can quickly become a financial headache.
This is exactly why having a precise, repeatable framework for calculating rental property ROI is non-negotiable.
Once you truly see its importance, you'll naturally want to find ways to improve it. For instance, you can discover 8 effective ways to boost your rental property ROI. My goal here is to demystify these calculations and give you a clear, actionable system for making decisions that build real wealth, whether you're eyeing your first duplex or analyzing deals in the best cities to invest in rental property.
Getting Your Numbers Straight for an Accurate Analysis
Before you can even begin to talk about ROI on a rental property, you have to get your numbers right. Any calculation is only as good as the data you feed it, and if your inputs are off, your results will be pure guesswork. It's a classic "garbage in, garbage out" scenario.
Let's break down exactly what you need to gather. We'll look at two main buckets: the cash you put in upfront to get the deal done and the ongoing costs to keep the property running smoothly. Think of it this way: you wouldn't build a house without knowing the cost of the foundation and the monthly utility bills. The same logic applies here. Overlooking a single expense can completely wreck your projections.
Nailing Down Your Total Cash Investment
So, what's your actual out-of-pocket cost to acquire the property? I see new investors make this mistake all the time—they think it’s just the down payment. That’s a surefire way to get a skewed view of your real returns. Your total cash investment is every single dollar that leaves your bank account to buy and prep the property for a tenant.
Here’s a breakdown of what that really includes:
- The Down Payment: This is the big one, the most obvious piece of the puzzle.
- Closing Costs: Don't forget these! They typically run between 2% to 5% of the purchase price and cover a whole slew of fees for appraisals, inspections, title insurance, and loan origination.
- Upfront Repairs & Renovations: Does it need a fresh coat of paint? New carpets? A full kitchen refresh? Every dollar you spend to make the place rent-ready counts as part of your initial investment.
A property might look like a home run on paper, but if you fail to account for the $5,000 in closing costs and another $8,000 in immediate repairs needed just to get a tenant in the door, that "great deal" can sour fast. These are real costs that directly hit your initial investment figure.
Getting the purchase price right is the first step in this entire process. To make sure you're starting on solid ground, it helps to be well-versed in valuation. Resources like this guide on Mastering Real Estate Property Valuation Methods can give you the context you need to make a smart offer.
Detailing Your Ongoing Operating Expenses
Once you’ve closed the deal and the property is yours, the expenses don't stop. These ongoing operating costs are what it takes to run your rental business day-to-day. Underestimating them is probably the single fastest way to turn a profitable investment into a financial headache.
Your list of operational costs needs to be brutally honest and thorough:
- Principal and Interest: Your monthly mortgage payment.
- Property Taxes: A major expense that can, and often does, change over time.
- Homeowners Insurance: Absolutely essential for protecting your asset.
- Property Management Fees: If you hire a pro, expect to pay 8-12% of the monthly rent.
- Maintenance and Repairs: Things break. A good rule of thumb is to set aside 1% of the property's value each year for this.
- Vacancy: No property stays occupied 100% of the time. Smart investors budget 5-10% of gross rent to cover the months it sits empty.
- Utilities: Any bills you're responsible for as the landlord (water, trash, etc.).
- HOA Fees: If your property is in a community with a homeowners association, don't forget these dues.
Meticulously tracking these expenses isn't optional—it's the only way to know your true ROI. To get organized, you can build a system using our guide and a rental income and expenses spreadsheet.
It's easy to get fixated on appreciation, but experienced investors know that consistent cash flow is the real engine of long-term wealth in rental properties. Over the long haul, pure housing price appreciation has often trailed other types of investments. But when you factor in the cash flow yields from rent—often adding another 5-8% cash-on-cash return annually—the total return becomes incredibly compelling. This is precisely why getting your expenses right is so critical to seeing the full, profitable picture.
The Three Core ROI Formulas Every Investor Should Know
Once you have your numbers in hand, it's time to make them talk. Calculating a rental property's ROI isn't about finding a single magic number. In my experience, the smartest investors look at a property from a few different angles, using key formulas that each tell a unique part of the financial story.
This is where abstract data turns into real-world insight, clearly showing you the relationship between your initial investment, the ongoing costs, and the income you can expect.
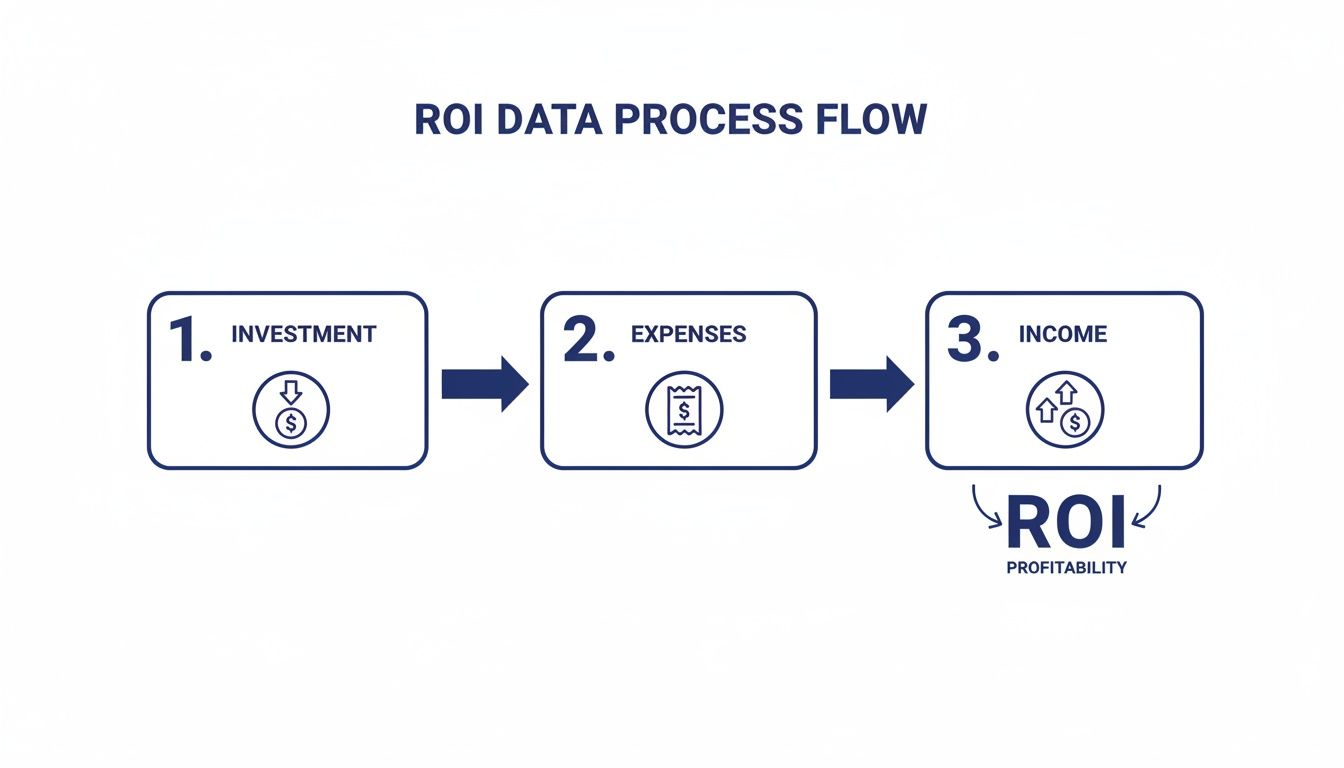
The diagram above gives you the basic flow: your investment is chipped away by expenses, and what’s left is measured against the income to find your return. Now, let’s get into the three crucial calculations that really bring this to life.
Uncovering Pure Profitability with Cap Rate
First on the list is the Capitalization Rate, or Cap Rate. Think of this as the purest look at a property's raw earning power. It completely strips away financing from the equation, focusing only on the income relative to the property's market value. This makes it a fantastic tool for comparing different properties on an even playing field.
The formula itself is pretty simple:
Cap Rate = Net Operating Income (NOI) / Property Purchase Price
Let's walk through a real-world scenario. Say you're looking at a $300,000 property and plan to buy it with cash.
- Gross Annual Rent: You figure it will rent for $2,500/month, which comes to $30,000 a year.
- Annual Operating Expenses: After tallying up property taxes, insurance, a maintenance fund, and a vacancy allowance, your total expenses come out to $12,000.
- Net Operating Income (NOI): This is simply your gross rent minus those operating expenses: $30,000 - $12,000 = $18,000.
Now, let's plug those numbers into the formula:
$18,000 (NOI) / $300,000 (Purchase Price) = 0.06 or 6%
So, this property has a 6% Cap Rate. This number tells you that, without a mortgage, the property generates an annual return of 6% on its total value.
Measuring Your Actual Cash Return
Next up is the Cash-on-Cash Return. For most investors using a loan, this is the metric that matters most. It measures the return specifically on the cash you personally invested. It answers the one question every investor has: "How hard is my money actually working for me?"
Here’s the formula:
Cash-on-Cash Return = Annual Pre-Tax Cash Flow / Total Cash Invested
Let's use that same $300,000 property, but this time we'll finance it.
- Down Payment (20%): $60,000
- Closing Costs (3%): $9,000
- Total Cash Invested: $60,000 + $9,000 = $69,000
To find our annual cash flow, we start with the $18,000 NOI from before, but now we have to subtract the mortgage payments. Let's assume a $240,000 loan at 6% interest over 30 years. That gives us an annual mortgage payment of about $17,268.
- Annual Pre-Tax Cash Flow: $18,000 (NOI) - $17,268 (Debt Service) = $732
Now we can calculate the Cash-on-Cash Return:
$732 (Annual Cash Flow) / $69,000 (Total Cash Invested) = 0.0106 or 1.06%
That 1.06% return might look alarmingly low, and it definitely highlights how tight the margins can be. But this metric is just one piece of a much larger puzzle. It doesn't factor in things like appreciation or equity build-up. It's also why you need to understand what is a good cash-on-cash return for your specific market before jumping to conclusions.
Capturing the Big Picture with Total ROI
Finally, we look at Total ROI. This metric zooms out to give you a more complete, long-term picture. It includes not just your cash flow, but also the equity you gain from the property appreciating in value and from paying down your loan. It helps you project your total profit when you eventually sell.
The formula looks like this:
Total ROI = (Total Gains - Total Costs) / Total Cash Invested
Let's stick with our $300,000 property and project a 5-year hold. We'll need to make a few educated guesses:
- Appreciation: Let's assume the property value goes up by a conservative 3% each year.
- Cash Flow: We'll keep our annual cash flow of $732 constant for simplicity.
- Principal Paydown: Over 5 years, you pay down roughly $15,000 of your loan balance, which is equity in your pocket.
First, we calculate all the ways we've gained value:
- Cash Flow Gain (5 years): $732 x 5 = $3,660
- Appreciation Gain: A $300,000 property appreciating at 3% annually will be worth around $347,782 in 5 years. That's a gain of $47,782.
- Equity from Loan Paydown: $15,000
Add it all up, and your Total Gain is $66,442.
Now, we compare that gain to your initial cash investment of $69,000:
$66,442 (Total Gain) / $69,000 (Total Cash Invested) = 0.963 or 96.3%
Over five years, your total return is 96.3%, which averages out to a very healthy 19.26% per year. This is where you see the real power of leverage at work. By running these three different calculations, you move beyond simple guesswork and start making truly informed decisions, understanding how your investment is performing from every critical angle.
Avoiding the Common Mistakes That Skew Your Numbers

Knowing the formulas is one thing, but your ROI calculation is only as reliable as the numbers you plug into it. In my experience, the biggest financial disasters in real estate investing don't come from complex market shifts. They almost always come from simple, avoidable errors made during the initial analysis.
These aren't just minor rounding errors. They're fundamental misjudgments that can make a losing property look like a grand slam on a spreadsheet. Getting this part right is what separates the consistently profitable investors from those who are always one unexpected repair bill away from a crisis.
The Number One Profit Killer: Underestimating Expenses
The most common and destructive mistake I see is being way too optimistic about expenses. It’s easy to get excited about the income side of the equation—the monthly rent—but the hidden costs are what truly decide whether you win or lose.
A classic oversight is forgetting to budget for Capital Expenditures (CapEx). These are the big-ticket items that don't hit every month but are absolutely inevitable over the life of a property. Think about a new roof, an HVAC system replacement, or new windows. These can cost thousands and instantly wipe out years of cash flow if you haven't been setting money aside.
I once saw an investor lose their entire first-year profit because they failed to account for a $10,000 HVAC replacement. Their initial ROI calculation looked amazing because they only budgeted for minor repairs, completely ignoring the 15-year-old unit that was clearly on its last legs.
To steer clear of this, a good rule of thumb is to set aside 5-10% of your gross rental income specifically for future CapEx. It might feel like it's eating into your monthly cash flow, but what you're really doing is protecting it.
The Vacancy Rate Fantasy
Another pitfall is assuming your property will be occupied 100% of the time. This almost never happens. Even in the hottest rental markets, tenants move out, and finding a new, qualified renter takes time.
Being too rosy about vacancy can seriously skew your numbers. If you project $2,000 in monthly rent but the property sits empty for just one month, you’ve lost $2,000 in income. That's over 8% of your gross annual rent gone, just like that.
For a more realistic figure, you need to look at local market data. Local property management companies are a great resource and can usually provide an average vacancy rate for the area. As a conservative standard, budgeting for a 5-10% vacancy rate is a much safer bet than banking on continuous occupancy.
Confusing Appreciation with Cash Flow
This is a critical distinction that trips up a lot of new investors. Appreciation is the increase in your property's value over time, and while it's a powerful way to build wealth, it is not the same as cash flow.
Cash flow is the actual money left in your bank account each month after all expenses, including the mortgage, have been paid. Appreciation, on the other hand, is unrealized—it’s just a number on paper until you either sell or refinance the property.
Relying on future appreciation to make a deal work isn't investing; it's speculating. A sound investment should stand on its own two feet with positive cash flow from day one.
- Focus on Cash Flow First: Make sure the property is profitable on a monthly basis. This is your financial safety net.
- Treat Appreciation as a Bonus: Think of it as the long-term reward for making a smart, cash-flowing investment.
An investor I know bought a property in a rapidly appreciating neighborhood. On paper, he was "making" tens of thousands of dollars a year. The reality? The rent didn't cover his high mortgage and taxes, and he was losing $300 out of pocket every single month. When the market flattened, he was forced to sell because he couldn't keep sustaining the losses. He learned the hard way that you can't pay your bills with on-paper equity.
Using Modern Tools to Validate Your Calculations
Running the numbers by hand is a fantastic way to learn the nuts and bolts of ROI. I highly recommend every investor do it. But let’s be honest—it’s slow, and it's easy to fat-finger a number in a spreadsheet, throwing your entire analysis off course.
This is where good real estate investment software becomes your co-pilot. Think of these platforms not as a crutch, but as a powerful second opinion that can stress-test your assumptions and save you from costly mistakes. They automate the tedious work so you can focus on the big picture.
Automation and Data-Driven Insights
Tools like our own Property Scout 360 are built specifically to do this heavy lifting. Instead of spending hours digging for rental comps, the software pulls in real-time market data to give you a solid rent estimate. It also automatically pulls local property tax rates and typical insurance costs—those pesky variables that can be a real pain to track down accurately.
This level of automation means you can model different scenarios in minutes, not hours.
- Wonder how bumping your down payment from 20% to 25% affects your return? Click, click, done.
- Want to compare a 15-year mortgage against a 30-year loan? Easy.
The dashboard from Property Scout 360 below gives you a glimpse of what this looks like.
It’s all right there—projected cash flow, cap rate, and cash-on-cash return. You get a clear financial snapshot without ever touching a calculator.
Advanced Metrics for a Sophisticated View
Beyond the basic metrics, these platforms can crunch more sophisticated numbers that give you a much deeper understanding of an investment's long-term potential. The most important one, in my opinion, is the Internal Rate of Return (IRR).
Unlike a simple one-year snapshot, IRR considers the time value of money, which is just a fancy way of saying a dollar today is worth more than a dollar next year. It paints a much more accurate picture of an investment’s true profitability over its entire life, right through to the day you sell.
This long-term view is critical. A massive 145-year study showed that rental properties delivered an average annual return of 7.05%, narrowly edging out stocks at 6.89%. To hit those kinds of numbers consistently, many investors I know shoot for a cash-on-cash return between 5-8%, though this can swing wildly depending on the market and deal. For example, putting $50,000 down on a property that kicks off $500 a month in cash flow gives you a killer 12% cash-on-cash return. If you want to dive deeper, you can read the full research about real estate returns and see how these benchmarks are set.
Using a tool to double-check your numbers isn't just about saving time—it's about reducing risk. It helps you catch overlooked expenses, confirm your rent estimates are realistic, and ultimately make a decision based on a complete financial picture, not just a gut feeling.
Common Questions About Rental Property ROI
When you're digging into the numbers on a potential deal, questions always pop up. It’s one thing to run the calculations, but it's another to know what they actually mean in the real world. Let's tackle some of the most common questions I hear from investors about what makes a good return.
Getting these concepts straight is what separates a savvy investor from someone just guessing.
What's a Good ROI for a Rental Property?
This is the million-dollar question, and the honest answer is: it depends. A fantastic return in a steady, slow-growing Midwest town might look mediocre in a booming coastal city. Your goals, your market, and your tolerance for risk all play a huge role.
That said, most seasoned investors have some benchmarks they look for to quickly vet a deal.
- Cash-on-Cash Return: I'm usually looking for something in the 8% to 12% range. If a property hits this mark, it tells me there’s enough cash flow to cover the mortgage and expenses with a healthy buffer left over.
- Cap Rate: This number is all about the market. In a hot, high-demand area like Austin or San Diego, a 4% to 6% cap rate can be a great find. But in a smaller market with more risk, I wouldn't touch a deal unless it was pushing 8% to 10% or even higher.
At the end of the day, a "good" ROI is one that fits your strategy. If you’re banking on long-term appreciation, you might be okay with a lower cash-on-cash return. If you need that monthly income to live on, you’ll want to hunt for deals on the higher end of that range.
How Does Using a Mortgage Affect My ROI?
Financing changes the game completely. Using a mortgage—what we call leverage—can seriously juice your returns, especially your cash-on-cash return. Think about it: you're putting down a fraction of the total price, so even a small amount of profit looks huge compared to your initial investment. That’s the magic of leverage.
But it’s a double-edged sword. That mortgage payment is due every single month, whether you have a tenant or not. It introduces risk and shrinks your margin for error. A leveraged property can be a cash-flow machine, but it demands you stay on top of your budget for vacancies and unexpected repairs.
Should I Factor in Appreciation When Calculating ROI?
My advice? Treat appreciation like the cherry on top, not the main course. When you’re first analyzing a deal, focus entirely on the numbers that you can control: the cash flow and the net operating income. A great investment is one that pays for itself month after month.
Relying on the market to go up to make your investment profitable isn't really investing—it's speculating. The market can be fickle, and banking on future price growth is a gamble I'm not willing to take.
When you look back at your Total ROI after five or ten years, that's when appreciation becomes part of the story. But for the initial decision to buy? The deal has to stand on its own two feet based on cash flow alone.
How Often Should I Recalculate My Property's ROI?
This is definitely not a "set it and forget it" calculation. I re-evaluate the performance of every property in my portfolio at least once a year. The numbers you used when you bought the place are almost certainly out of date within 12 months.
Rents go up, property taxes get reassessed, insurance costs creep higher, and a new water heater can throw your maintenance budget for a loop. An annual ROI check-up helps you see these trends, tells you when it's time to raise the rent, and helps you decide if you should hold, sell, or refinance. It's about managing your asset proactively instead of just putting out fires.
Stop wrestling with spreadsheets and start making smarter, faster investment decisions. Property Scout 360 gives you the power to analyze any U.S. property in minutes, providing instant ROI projections, cash flow analysis, and market-driven data to validate every deal. Try it free and see how confident you can be in your next investment. Find and Analyze Profitable Rental Properties with Property Scout 360
About the Author
Related Articles
2026 Investor's Guide: Cost of Installing a Sewer Clean Out
Understand the cost of installing a sewer clean out for investment properties in 2026. Get expert advice on prices, ROI, & budgeting for flips. Plan smart!
15 Year vs 30 Year Mortgage: The Investor's Choice
Deciding between a 15 year vs 30 year mortgage for a rental property? Our guide analyzes cash flow, ROI, and equity to help you pick the best loan.
Real Estate Appraisal Software: Features & Limits
Discover what real estate appraisal software is, its core features, and limits. See how it differs from investment tools for profitable deals.