Mastering Rental Property Spreadsheet Analysis
Unlock smarter real estate investing with our guide to rental property spreadsheet analysis. Learn to accurately model cash flow, ROI, and cap rate.
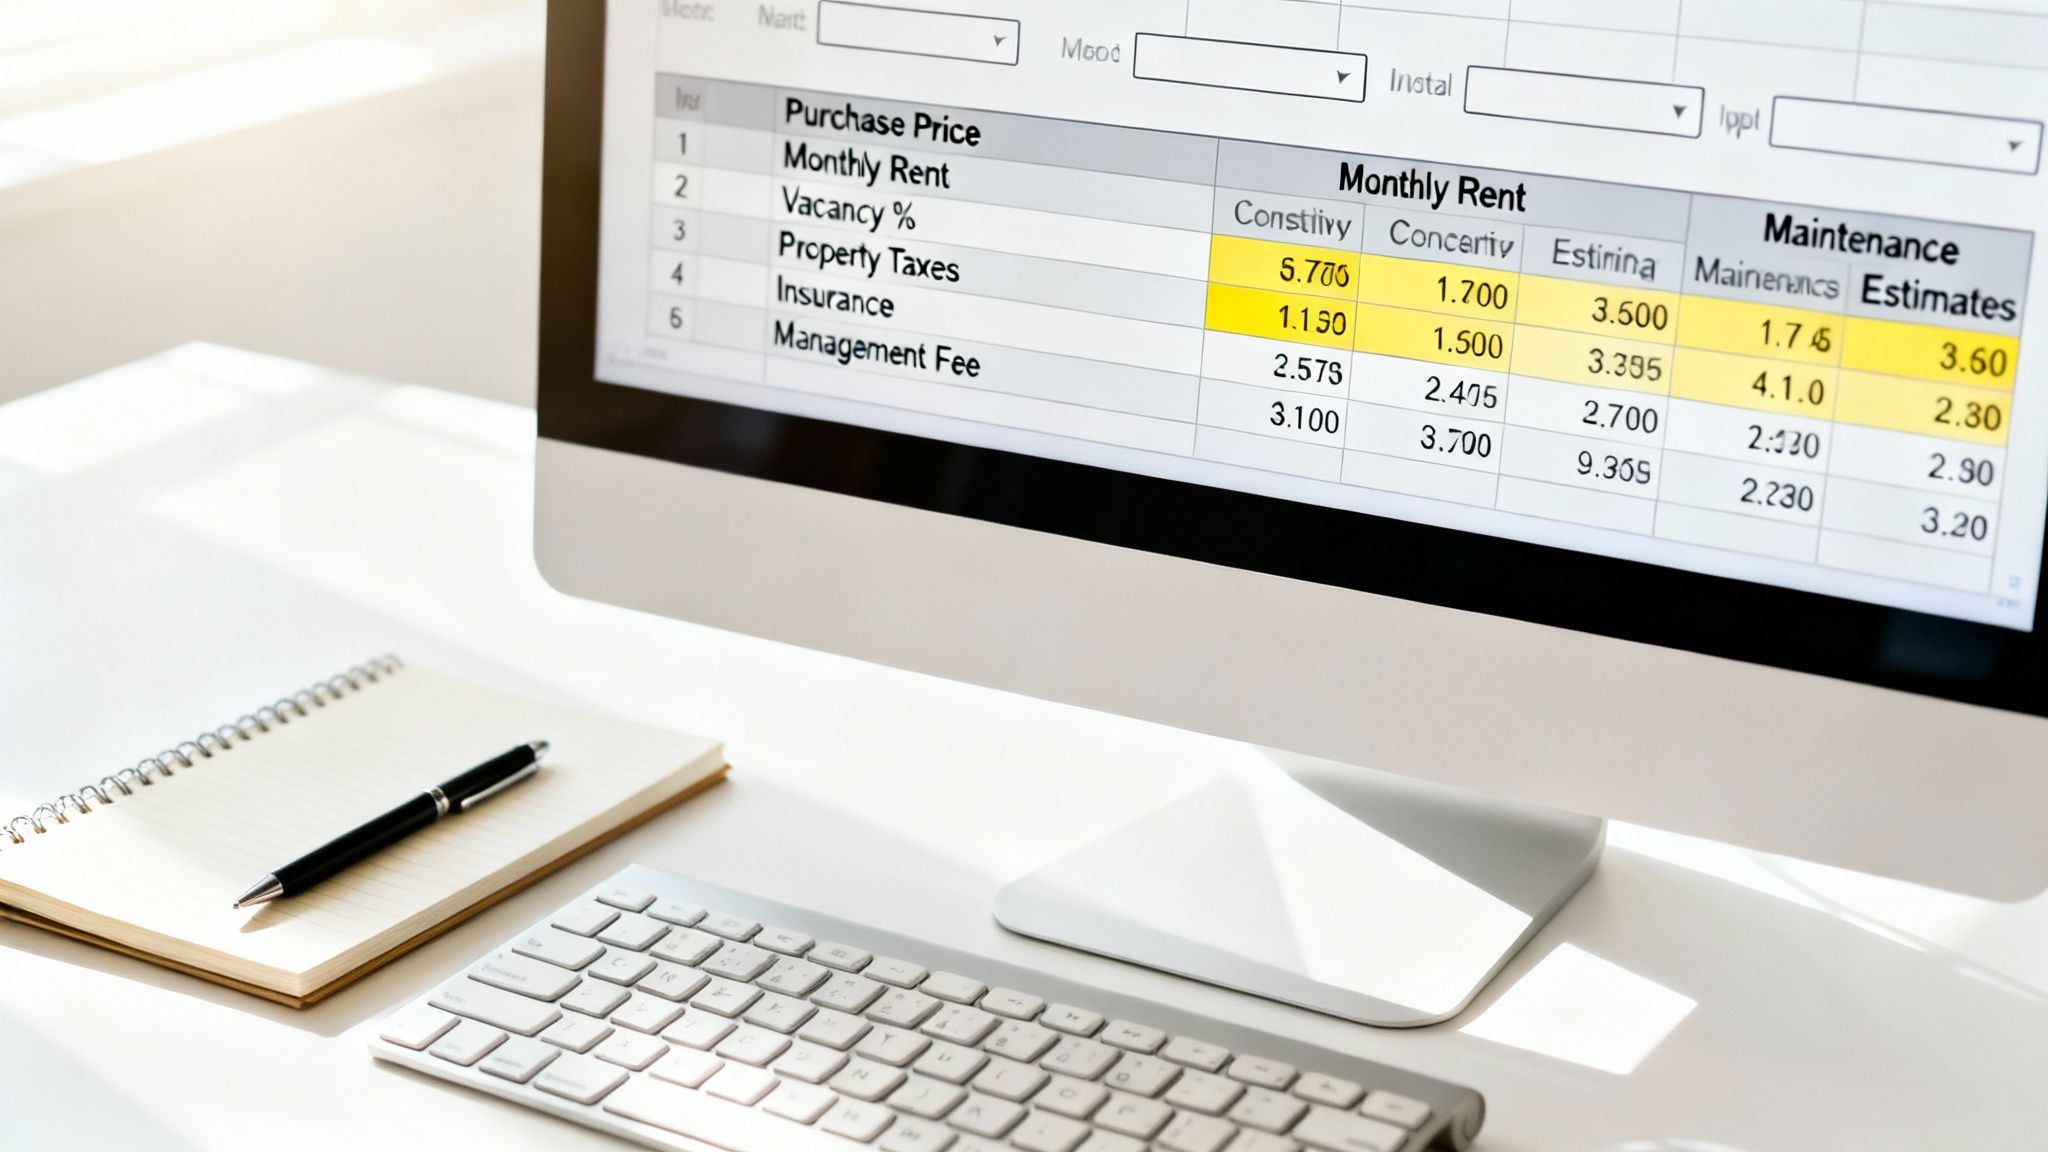
When you're analyzing a potential rental property, you're doing more than just crunching numbers—you're manually calculating key metrics like cash flow, ROI, and cap rate to see if a deal actually makes sense. This hands-on process is critical. It forces you to look closely at every single assumption, from the purchase price and closing costs right down to the nitty-gritty of operational expenses. It's how you build a real, deep understanding of a deal that automated calculators often gloss over.
This is the bedrock skill for making smart, data-driven investment decisions you can stand behind.
Why Spreadsheets Are Non-Negotiable For Serious Investors

In a world full of slick apps and one-click calculators, you might wonder why so many seasoned investors still lean on a trusty spreadsheet. The secret is in the process itself.
Building your own analysis from scratch forces a level of intimacy with the numbers that automated tools just can't match. It’s not just about getting an answer; it’s about truly understanding how you got there.
When you manually enter each figure—purchase price, loan terms, property taxes, insurance, and your best guess for maintenance—you're forced to question every assumption. This disciplined approach helps build an intuitive financial model in your head, sharpening your gut instinct for spotting red flags and uncovering opportunities that others might miss.
The Power of Foundational Knowledge
Think of your spreadsheet as your personal financial simulator. You can plug in different variables and immediately see how a slight increase in vacancy rates or one major, unexpected repair ripples through your entire financial picture. This kind of foundational knowledge is what builds the confidence to pull the trigger when a genuinely good deal comes along.
This hands-on approach is more important than ever. The global real estate rental market is enormous and getting bigger, projected to grow from $2.91 trillion in 2025 to $3.87 trillion by 2029. In a market that massive, even a small miscalculation in your pro-forma can have a huge impact. Getting granular with a line-item approach ensures your projections are based on reality, not just wishful thinking. You can dig into more insights on this growing market over at Research and Markets.
For a new investor, the spreadsheet is a classroom. For a veteran, it's a trusted gut check. It’s the tool that bridges the gap between a property's listing price and its actual long-term value.
To build a reliable analysis, your spreadsheet needs to cover several core components. It’s all about tracking what goes in (inputs) and what comes out (outputs) to give you a clear financial picture.
Core Components of a Rental Analysis Spreadsheet
| Category | Key Data Points | Purpose |
|---|---|---|
| Property & Purchase Info | Purchase Price, Closing Costs, Rehab Budget, After Repair Value (ARV) | Establishes the total initial investment required to acquire and prepare the property. |
| Financing Details | Down Payment, Loan Amount, Interest Rate, Loan Term (in years) | Calculates the monthly mortgage payment (P&I) and tracks the loan amortization over time. |
| Income Projections | Gross Monthly Rent, Other Income (e.g., parking, laundry) | Determines the total potential revenue the property can generate. |
| Operating Expenses | Property Taxes, Insurance, Vacancy Rate (%), Repairs & Maintenance, CapEx, Utilities | Accounts for all the ongoing costs of owning and operating the rental. |
| Key Performance Metrics | Cash Flow, Cash-on-Cash Return (CoC), Capitalization Rate (Cap Rate), ROI | Translates all the inputs into clear, measurable indicators of profitability and performance. |
With these elements in place, your spreadsheet becomes a powerful decision-making tool, giving you a comprehensive view of the investment's potential from day one.
A Stepping Stone to Advanced Tools
While a spreadsheet is powerful, it's the essential starting point, not the final destination. The skills you sharpen by building a manual rental property spreadsheet are directly transferable to more sophisticated platforms.
Once you’ve mastered the fundamentals, you're perfectly positioned to use advanced tools like Property Scout 360. These platforms can automate the tedious calculations without losing the detailed insights you’ve learned to value. It’s a natural evolution that lets you analyze more deals in less time, combining the depth of manual analysis with the speed of modern tech.
Building Your Spreadsheet With Realistic Inputs And Expenses
The single most critical part of analyzing a rental property is the data you feed your spreadsheet. There's an old saying, "garbage in, garbage out," and it couldn't be more true for real estate investing. If you plug in overly optimistic numbers, your analysis will show you a winner every time—right up until the bills start coming in.
This is where you need to roll up your sleeves and do the real work. It's about finding conservative, well-researched figures to build a financial model you can actually trust. Let's walk through the essential numbers you absolutely have to get right.
Nailing Down Purchase and Financing Details
First things first, we need to establish your total cash out of pocket. These are the one-time costs to get the keys in your hand. And trust me, it’s more than just the purchase price.
Your spreadsheet needs separate cells for these key figures:
- Purchase Price: The number on the contract. Simple enough.
- Closing Costs: This one trips up a lot of new investors. You should budget a solid 3-5% of the purchase price to cover all the extras like title insurance, appraisal fees, loan origination, and attorney costs.
- Rehab Budget: Does the place need a new kitchen or a fresh coat of paint before a tenant can move in? Get quotes if you can and plug in a realistic number here.
With the total acquisition cost figured out, you can move on to the financing side of the equation. How you structure your loan has a massive impact on your monthly numbers.
- Down Payment: How much of your own money are you bringing to the table?
- Loan Amount: This is simply the purchase price minus your down payment.
- Interest Rate: The rate your lender has quoted you.
- Loan Term: Are you going with a 15- or 30-year mortgage?
These inputs are the foundation for calculating your mortgage payment, which is usually your biggest single expense.
Projecting Income and Vacancy
Okay, you know what it costs to buy the place. Now, how much money will it bring in? The starting point is Gross Scheduled Income (GSI), which is the absolute maximum rent you could collect if the property was occupied 100% of the year.
To get this number, you have to research comparable rentals—"comps"—in the immediate neighborhood. Look for properties with similar square footage, bedroom count, and condition. But here’s the reality check: no property stays rented forever. Tenants move out. You have to plan for that.
A conservative vacancy rate is your best defense against overestimating your returns. A good rule of thumb is to budget 5-10% of your GSI for vacancy. So, if a property rents for $2,000 a month, that means you should assume you'll lose between $1,200 and $2,400 annually to an empty unit.
Factoring in vacancy turns your GSI into a much more realistic number called Effective Gross Income (EGI). This is the income you can actually count on.
Accounting for Every Single Operating Expense
This is where the rubber meets the road—and where most deals fall apart under scrutiny. Underestimating your operating expenses is the fastest way to turn a cash-flowing property into a money pit. For a more detailed look at tracking these costs, our guide on building a rental income and expenses spreadsheet is a great resource.
Think of your expenses in two buckets: fixed and variable.
Fixed Monthly Expenses
These are the predictable costs you'll pay every month, no matter what.
- Property Taxes: Don't guess. Look up the most recent tax bill from the county.
- Insurance: Call an agent and get a quote for a landlord policy. It's different (and usually more expensive) than a homeowner's policy.
- Property Management Fees: The industry standard is 8-12% of collected rent. Even if you plan to manage it yourself, you must include this. Your time isn't free, and this ensures your deal works even if you hire someone later.
- HOA Dues: If it's in a Homeowner's Association, find out the exact fee.
Variable and Long-Term Expenses
These are the costs that fluctuate and require you to build up cash reserves.
- Repairs & Maintenance: A good starting point is budgeting 1-2% of the property's value annually. For a $300,000 home, that's $250-$500 you should be setting aside every single month for leaky faucets and broken disposals.
- Capital Expenditures (CapEx): This is for the big-ticket items: the new roof in 10 years, the HVAC system in 15. It's not a matter of if these things will fail, but when. Budgeting another 1% of the property's value annually is a smart move.
- Utilities: Will you be covering water, sewer, or trash? Make sure you account for it.
By taking the time to nail down these realistic numbers, you’re setting yourself up for success. This detailed groundwork is what allows your spreadsheet to finally calculate the metrics that tell you whether you've found a great investment or one you should walk away from.
Crunching the Numbers That Actually Matter
Alright, you've done the legwork and plugged in your best estimates for income and expenses. Now for the fun part: making the spreadsheet actually think. This is where we turn those raw numbers into the core metrics that tell you whether a deal is a hidden gem or a financial landmine.
These aren't just fancy acronyms; they're the universal language of real estate investing. Mastering them allows you to look past the curb appeal and compare completely different properties on an apples-to-apples basis. It’s how you move from "gut feelings" to data-driven decisions that build real wealth.
Let's dive into the essential formulas that will bring your spreadsheet to life.
Start With Net Operating Income (NOI)
First up is the bedrock of all property analysis: Net Operating Income (NOI).
Think of NOI as the property's pure, raw profitability before you even consider the mortgage. It shows you how much money the asset itself generates on its own, which is a crucial first step.
The formula is beautifully simple:
NOI = Effective Gross Income (EGI) - Total Operating Expenses
Remember, your EGI is the total rent you could collect, minus a realistic vacancy buffer. Your operating expenses are all the costs to run the property—taxes, insurance, repairs, management—but it does not include your loan payments. That part comes later.
For example, if a duplex has an EGI of $28,500 and its operating expenses add up to $11,400, the NOI is $17,100. This single number is the foundation for almost everything else we're about to calculate.
Uncovering Your Real-World Cash Flow
NOI is great for comparing properties, but it doesn't tell you what you'll actually have left in your bank account each month. For that, we need to calculate Cash Flow. This is the money you can actually spend or reinvest after everyone gets paid, including the bank.
To get there, you just take your NOI and subtract your mortgage payments (also known as debt service).
Cash Flow = Net Operating Income (NOI) - Total Debt Service
Let's stick with our example. If the property with a $17,100 NOI has annual mortgage payments of $14,500, your annual cash flow is a neat $2,600. Broken down monthly, that’s about $217. This is the profit that hits your pocket, and for most buy-and-hold investors, a healthy positive number here is non-negotiable.
The All-Important Capitalization Rate
So, is an NOI of $17,100 any good? It’s impossible to say without context. That’s where the Capitalization Rate (Cap Rate) comes in. The cap rate is a quick-and-dirty way to gauge a property's profitability relative to its price.
Here's the formula:
Cap Rate = Net Operating Income (NOI) / Property Purchase Price
If you bought that duplex for $300,000, your cap rate would be 5.7% ($17,100 / $300,000). In general, a higher cap rate suggests a higher return (and often higher risk), while a lower one implies the opposite. It’s the perfect metric for quickly sizing up different deals in the same market.
Measuring How Hard Your Cash Is Working
Finally, we get to the metrics that show you the power of leverage. These numbers are all about the return you're getting on the actual cash you pulled out of your own pocket.
Cash-on-Cash Return
This might be the most telling metric for anyone using a loan. It answers the simple question: "For every dollar I invested, how much am I getting back each year in cash?"
- Formula: Annual Cash Flow / Total Cash Invested
- Example: If your annual cash flow is $2,600 and your down payment plus closing costs totaled $65,000, your cash-on-cash return is a solid 4%.
Return on Investment (ROI)
ROI is a much bigger-picture metric. It looks beyond simple cash flow to include things like the equity you build as the loan gets paid down and the potential appreciation of the property over time. For a deeper look, check out our guide on how to calculate the return on investment for a rental property.
Key Real Estate Metric Formulas
To keep things straight, here's a quick reference table with the core formulas we just covered. It's a great cheat sheet to have handy as you analyze deals.
| Metric | Formula | What It Tells You |
|---|---|---|
| Net Operating Income (NOI) | EGI - Total Operating Expenses | The property's unleveraged profitability. |
| Cash Flow | NOI - Total Debt Service | Your actual take-home profit after all bills are paid. |
| Capitalization Rate (Cap Rate) | NOI / Purchase Price | A quick measure of return, great for comparing properties. |
| Cash-on-Cash Return | Annual Cash Flow / Total Cash Invested | The return on your actual out-of-pocket investment. |
Having these metrics at your fingertips transforms your spreadsheet from a simple expense tracker into a powerful deal analysis machine.
It's also critical to use current, realistic assumptions in your spreadsheet. For example, Landlord Studio's 2025 report noted that while the national median rent was $1,373 in late 2024, single-family rent growth had slowed to a 15-year low of just 1.4%. Relying on old-school 3-5% annual rent growth assumptions can seriously inflate your long-term projections and lead to a very costly mistake.
By building these calculations directly into your spreadsheet, you create a dynamic tool that gives you the full financial picture, empowering you to evaluate any potential deal with confidence.
Stress-Testing Your Deal With Advanced Analysis
A good rental property spreadsheet tells you if a deal looks profitable today. A great one shows you how it might hold up when things inevitably go wrong tomorrow. This is where we move beyond basic calculations and start stress-testing our assumptions.
Think of it as transforming your spreadsheet from a simple calculator into a dynamic flight simulator for your investment. By modeling different financing structures and running "what-if" scenarios, you can see a deal’s true risk profile before you ever sign on the dotted line.
Modeling Different Financing Scenarios
How you finance a property dramatically changes its performance, especially your monthly cash flow. I never just plug in one loan option; I build my spreadsheets to compare several scenarios side-by-side. This helps me find the sweet spot for my financial goals.
For instance, I'll always run the numbers for a few common loan structures:
- A 15-year vs. a 30-year mortgage: Sure, the 15-year loan builds equity like crazy, but that higher monthly payment can easily turn a cash-flowing property into a money pit.
- Varying down payment amounts: It's amazing to see how putting 20% down versus 25% impacts everything—the monthly payment, your cash-on-cash return, and whether you're stuck paying for Private Mortgage Insurance (PMI).
To do this right, your spreadsheet absolutely needs an amortization schedule. This table breaks down every single mortgage payment into its principal and interest components. It's the only way to truly visualize how each check you write chips away at your debt and builds that all-important equity over time.
Running a Sensitivity Analysis
"Sensitivity analysis" might sound complex, but it's really just a simple—and crucial—exercise. You start tweaking your key assumptions to see how fragile your returns really are. Because let's be honest, real estate is never as predictable as we'd like. This is how you find an investment's breaking point.
Your spreadsheet should have a dedicated section where you can easily change a few variables and instantly see the impact on your cash flow and ROI.
I always test these key variables:
- Vacancy Rate: What if that comfortable 5% vacancy rate you assumed jumps to 10% or even 15% because a local employer shuts down? Does the property still break even?
- Rent Growth: Your whole model might hinge on 3% annual rent bumps. What happens if rents stay flat for the next two years?
- Interest Rates: If you're considering a variable-rate loan or plan to refinance down the road, you have to model how a 1% or 2% rate hike would crush your numbers.
- Major Expenses: How does an unexpected $8,000 HVAC replacement in year three affect your total return? For this, you can dig into more advanced metrics like the Internal Rate of Return. If you're unfamiliar, we have a detailed guide on how to use an Internal Rate of Return calculator for real estate.
This flowchart really brings home how these variables directly hit your bottom line.
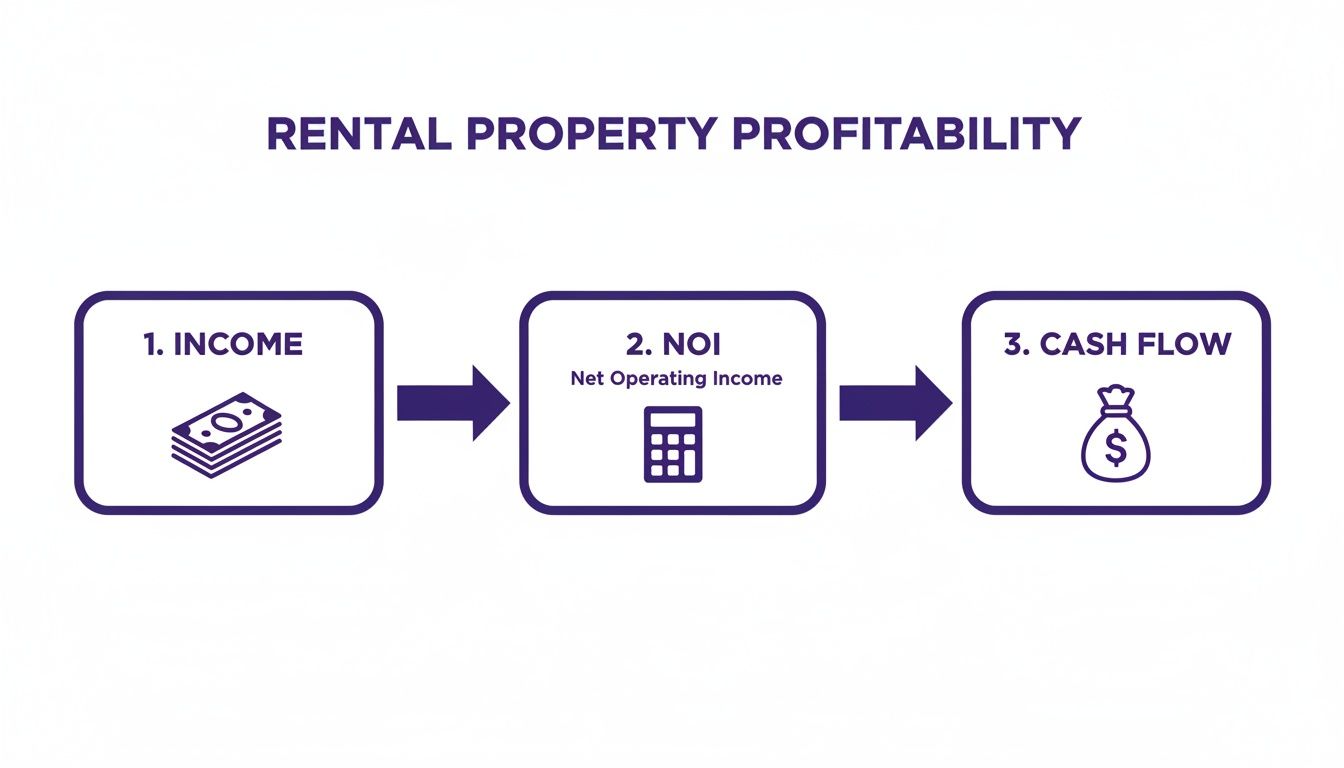
As you can see, every dollar of income has to fight its way through operating expenses just to get to Net Operating Income (NOI). Only then can it cover your mortgage and finally become cash in your pocket.
A spreadsheet that allows for sensitivity analysis is your early warning system. It tells you which assumptions carry the most risk and helps you build in a margin of safety. If a deal only works in a perfect-world scenario, it’s probably a deal to avoid.
Before you go all-in, it's smart to run through a comprehensive real estate due diligence checklist to spot any potential red flags. Your spreadsheet handles the financial "what-ifs," while a good checklist covers the crucial operational and legal details. This two-pronged approach gives you the confidence to make a sound, well-researched investment decision.
Common Spreadsheet Mistakes And When To Automate
A well-crafted spreadsheet is a real estate investor's best friend. But its greatest strength—total flexibility—can also be its biggest weakness. Every manual entry is a chance for a tiny error, and those little mistakes have a nasty habit of compounding over a 30-year projection. What looked like a great deal on paper can quickly turn into a costly lesson.
Even seasoned investors can fall into a few common traps. I'm not just talking about typos. The real danger lies in what you leave out or where you get a little too optimistic, which can completely warp your financial projections. Knowing what these pitfalls are is the first step to building an analysis process you can actually trust.
Overlooking The Small But Mighty Expenses
One of the easiest mistakes to make is forgetting all the little "hidden" costs that don't fit neatly into big buckets like PITI (principal, interest, taxes, and insurance). But trust me, these small expenses can bleed your cash flow dry over time.
A truly bulletproof analysis has to account for these easy-to-miss items:
- Leasing Fees: If you use a property manager, they'll likely charge a fee to place a new tenant—often half a month's rent, sometimes a full month.
- Pest Control: Depending on where the property is, quarterly or annual pest control is just a standard cost of doing business.
- Landscaping & Snow Removal: These can be surprisingly significant, especially for homes with big yards or in snowy climates.
- Professional Services: Don't forget to budget for the occasional chat with your lawyer or accountant. It happens.
Forgetting just $100 a month in these miscellaneous costs adds up to $1,200 in lost cash flow every year. On a tight deal, that could be your entire profit margin.
The Danger of Optimistic Assumptions
Another classic pitfall is plugging in best-case-scenario numbers. It's incredibly tempting to assume your property will have a 100% occupancy rate and that you can bump rents by 5% like clockwork every single year. Reality just doesn't work that way.
Using an unrealistically low vacancy rate is a big one. A 2% assumption might make the numbers pop, but a single tenant turnover can instantly spike your actual vacancy for the year to over 8%. It's just as dangerous to ignore future Capital Expenditures (CapEx). That roof will need to be replaced in 15 years, and if you haven't been setting money aside for it, your cash flow will get absolutely crushed when the bill comes due.
The goal of your spreadsheet isn't to make every deal look good. It's to tell you the truth about a deal, even if it's a truth you don't want to hear. Conservative estimates are your best friend.
As your portfolio grows, keeping all these details straight manually becomes a real headache. While a spreadsheet is perfect for getting started, you might eventually want to compare the best accounting software for rental property to sidestep these common errors and get your financial management on lock.
Knowing When To Upgrade Your Toolkit
So, when is it time to graduate from your trusty spreadsheet? For most investors, the tipping point comes when the time spent building, updating, and triple-checking your analysis starts to outweigh the benefits.
It might be time to look for a dedicated tool if:
- You find yourself analyzing multiple properties every week.
- You're constantly hunting down local market data like rent comps and tax rates.
- You want to run complex "what-if" scenarios without having to rebuild all your formulas.
This is where specialized platforms really come into their own. They're built to pull in real-time data and automate all the heavy lifting, which virtually eliminates the risk of manual error.
Tools like Property Scout 360 can pull live market data straight into your analysis, making sure your rent and expense estimates are grounded in what's actually happening on the ground today. By automating the calculations for cash flow, cap rate, and ROI, these platforms let you analyze more deals with more accuracy and confidence. That frees you up to focus on what really matters: finding that next great investment.
Got Questions? Let's Talk Rental Analysis
Building the spreadsheet is one thing; using it to make smart decisions in the real world is another. As you start running numbers on actual properties, questions will inevitably pop up. That’s a good thing—it means you’re thinking like an investor.
Let's walk through some of the most common sticking points I see with new and even experienced investors. Getting these details right is what separates a decent deal from a truly great one.
How Accurate Do My Expense Estimates Really Need to Be?
This is the big one, and it's a fantastic question. The goal isn't just accuracy; it's building a safety net into your numbers. I always tell people to aim for "directionally correct and conservatively biased." In simple terms, get as close to the real numbers as you can, and when you’re not sure, always guess high on expenses.
Some costs are non-negotiable. For things like property taxes, you should be 100% accurate—just pull the data directly from public records. For everything else, you start with a rule of thumb and then get specific.
- Repairs & Maintenance: The old 1-2% rule (based on the property's value each year) is a decent starting point. But let's be real: an older home with its original 1970s plumbing is going to need a lot more love than a new build. For that older property, I’d be budgeting closer to 3%, maybe even more.
- Capital Expenditures (CapEx): This is where investors get burned. Don't just slap a generic percentage on it. Find out the age of the big-ticket items—the roof, HVAC, and water heater. A 20-year-old roof means you need to be socking away a serious monthly reserve. If it was replaced last year, you can breathe a little easier.
The more you dig into the specifics of a property, the more you can trust your final cash flow numbers.
What's a "Good" Cash on Cash Return?
If only there were a single magic number! The truth is, "good" completely depends on your market, your personal risk tolerance, and what you're trying to achieve. But generally, you want your money to be working harder for you in a rental property than it would in a boring index fund.
Most seasoned investors I know are looking for a cash on cash (CoC) return somewhere in the 8-12% ballpark for a stable, cash-flowing rental. That range is often a sign that you've found a solid performer.
But here’s a crucial caveat: a lower CoC isn't always a red flag. A property in a hot, up-and-coming neighborhood might only cash flow at 4-6%. The trade-off? You could be sitting on a goldmine of appreciation in a few years. Your spreadsheet is the tool that helps you balance today's cash flow against tomorrow's potential wealth.
How Often Should I Bother Updating My Analysis Spreadsheet?
Think of your spreadsheet not as a one-time calculation, but as a living, breathing health report for your investment. It’s not a "set it and forget it" tool.
Here’s a simple rhythm I recommend:
- Annually: Do a deep dive. Check the current market rents for your area, update your numbers with the latest property tax bill, and plug in what you actually spent on repairs over the last 12 months. This is your chance to see how your initial projections held up to reality.
- During Tenant Turnover: This is the perfect opportunity. Before you even think about listing the unit, re-run your numbers to see if you can and should adjust the rent.
- Before a Refinance: You’ll absolutely need a fresh, up-to-the-minute analysis here. It's essential for figuring out if a refinance even makes sense and for giving your lender the current financial picture.
When you keep your spreadsheet updated, it becomes more than just a deal analyzer—it transforms into a powerful portfolio management tool that keeps you making smart decisions based on fresh data.
Ready to stop wrestling with formulas and start analyzing deals with speed and precision? Property Scout 360 lets you instantly calculate ROI, cash flow, and cap rate for any property in the U.S., using real-time MLS data. Ditch the weeks of manual analysis and start making confident, data-backed offers in minutes.
Find Your Next Profitable Rental Property with Property Scout 360
About the Author
Related Articles
2026 Investor's Guide: Cost of Installing a Sewer Clean Out
Understand the cost of installing a sewer clean out for investment properties in 2026. Get expert advice on prices, ROI, & budgeting for flips. Plan smart!
15 Year vs 30 Year Mortgage: The Investor's Choice
Deciding between a 15 year vs 30 year mortgage for a rental property? Our guide analyzes cash flow, ROI, and equity to help you pick the best loan.
Real Estate Appraisal Software: Features & Limits
Discover what real estate appraisal software is, its core features, and limits. See how it differs from investment tools for profitable deals.