Build a Smarter Rental Income Expenses Spreadsheet
Go beyond basic tracking. Learn to build a rental income expenses spreadsheet that reveals key financial metrics, simplifies tax prep, and boosts your ROI.
A simple spreadsheet for tracking rental income and expenses is a good start, but its real value comes from turning that basic data into actionable investment insights. It should be more than just a ledger; it should be your go-to tool for forecasting cash flow, analyzing profitability, and making smart decisions to protect your bottom line.
Why Your Old Spreadsheet Is Costing You Money
Let's be honest—that basic spreadsheet you're using to track rent checks and repair costs is probably leaking money from your portfolio. While it feels organized, a simple list of debits and credits is a reactive tool in a market that demands a proactive strategy. It tells you what you’ve already spent, but it doesn't really show you where your investment is headed.
The rental market is constantly shifting, and unforeseen costs or changes in a tenant's financial situation can eat into your profits faster than you think. A generic spreadsheet just can't keep up. It won't automatically calculate key performance indicators, help you forecast future capital expenditures, or flag expense categories that are quietly spiraling out of control. It’s a static record when what you really need is a dynamic command center.
Moving Beyond Simple Bookkeeping
A truly strategic rental spreadsheet does a lot more than just log transactions. It becomes the financial brain of your entire operation, helping you navigate the tricky parts of property ownership. Think of it as the difference between a paper map and a GPS with live traffic updates.
For instance, a basic expense list might just show you spent $800 on maintenance last month. A smarter, more detailed spreadsheet breaks that down:
- $550 for an emergency water heater replacement in Unit A.
- $150 for routine landscaping across the property.
- $100 for a non-urgent faucet repair in Unit B.
That level of detail gives you immediate clarity. You can instantly see which costs are one-time emergencies versus recurring operational expenses, which makes your budgeting and financial forecasting far more accurate. This detailed approach is the bedrock of understanding your asset's true performance. If you want to dive deeper, our guide on how to analyze a rental property offers a great framework for evaluating these very details.
The goal isn't just to record what happened; it's to use that data to predict what will happen next and make smarter decisions today. A well-structured spreadsheet gives you the foresight to plan for big-ticket items instead of just reacting to them.
To get the most out of your spreadsheet, you need to think beyond a simple income-and-outflow list. Building in the right components from the start is what separates a basic tracker from a powerful financial dashboard.
Here’s a quick-glance summary of the essential elements that transform a basic tracker into a powerful financial tool for any landlord.
Core Components of a High-Performance Rental Spreadsheet
| Component | Primary Function | Strategic Benefit |
|---|---|---|
| Income Tracker | Logs all sources of revenue per property, including rent, late fees, and other charges. | Provides a clear, real-time view of total revenue and helps identify payment trends or delinquencies quickly. |
| Expense Categorization | Breaks down all spending into specific categories like repairs, utilities, taxes, and management fees. | Pinpoints areas of overspending, simplifies tax preparation, and enables more accurate budgeting for the future. |
| Performance Dashboards | Calculates and displays key metrics like cash flow, cap rate, and cash-on-cash return. | Offers an at-a-glance health check of your portfolio, making it easy to compare property performance and spot red flags. |
| Amortization Schedule | Integrates loan payment data, separating principal from interest for each mortgage payment. | Ensures accurate accounting of equity buildup and interest deductions, which is critical for understanding your true ROI. |
Each of these pieces works together to give you a complete and dynamic picture of your investment's financial health.
Responding to Market and Tenant Realities
The rental market is anything but static, and your tracking system needs to reflect that. Landlords are constantly navigating affordability challenges. As of December 2024, the national median rent in the US was $1,373. While that’s a slight dip, it’s still a significant $225 increase since early 2021.
Even more telling is that an estimated 50% of renter households are now cost-burdened, meaning they spend over 30% of their income on rent. This affects 22.4 million households, a number that has grown by 2 million since 2019. For landlords, these figures underscore just how critical it is to have a meticulous rental spreadsheet. It helps you manage operational costs, anticipate potential rent collection issues, and find ways to optimize profitability when nearly half of your potential tenants are under financial pressure.
Ultimately, clinging to an outdated, simplistic spreadsheet isn't just about being disorganized—it's a financial liability. It masks hidden costs, prevents you from accurately analyzing performance, and leaves you unprepared for market shifts. By upgrading your approach, you turn a simple tracking tool into a powerful asset for protecting your investment and maximizing returns when every dollar counts.
Building Your Spreadsheet From the Ground Up
If you're still tracking your rental finances on a single, messy sheet (or worse, a shoebox full of receipts), it's time for an upgrade. We're going to build a proper financial tool from scratch, and you don't need to be an accountant to do it. The goal here is simple: create a system that's powerful enough to give you real insights but easy enough that you'll actually use it.
The secret I've learned over the years is to keep things separate but connected. Instead of one giant, intimidating worksheet, we’ll use a few dedicated tabs within a single workbook. I always start with three essentials: one for a master transaction list, one for individual property summaries, and a high-level dashboard to see the big picture.
This simple shift in organization turns a static list of numbers into a dynamic command center for your entire portfolio. It's the first real step toward running your rentals like a true business and boosting your profitability.

This evolution from scattered data to an integrated system is what gives you a crystal-clear view of your financial performance.
Designing Your Master Ledger
Your master ledger is the heart of the entire spreadsheet. Think of it as the single source of truth—every dollar that comes in and every dollar that goes out gets logged here. Each transaction gets its own row, packed with all the details we'll need to slice and dice the data later.
It's basically a supercharged bank statement, but with context that's actually useful for your rental business. To make it work, you'll need these essential columns:
- Date: When the transaction actually happened.
- Property: Which rental this income or expense belongs to.
- Category: A broad bucket, like "Repairs" or "Rental Income."
- Sub-Category: Something more specific, like "Plumbing" or "Tenant Rent."
- Item Description: A quick, clear note (e.g., "Leaky faucet repair, Unit 2 bathroom").
- Amount: The dollar value. I find it easiest to use positive numbers for income and negative numbers for expenses.
- Notes: Any extra details you might forget, like the vendor's name or a receipt number.
For instance, say you call a plumber for that leaky sink at your 123 Main St. property. The entry would show the property, "Maintenance & Repairs" as the category, and "Plumbing" as the sub-category. That level of detail is gold.
A well-structured ledger does more than just track spending; it tells the financial story of each property. When you can filter by "Plumbing" for "123 Main St," you might discover you're spending too much on recurring issues, signaling a deeper problem that needs a permanent fix.
Establishing Clear Categories and Sub-Categories
Your categories are what turn a long list of transactions into actionable intelligence. Without them, you just have a jumble of numbers. A solid categorization system—what accountants call a "chart of accounts"—needs to be detailed enough to be useful but not so granular that logging a simple expense becomes a 10-minute chore.
Getting this right is more critical than ever. We're all feeling the pinch from inflation and rising interest rates. In the United States, renters have seen costs jump by 18% since January 2023, and that’s a direct result of landlords facing higher material and labor costs. To stay profitable, you have to know exactly where your money is going. You can read more about these global rent trends on Nasdaq.com.
A practical chart of accounts helps you see those pressures clearly. It lets you track fluctuating expenses, from utilities to property management fees, so you can make smarter decisions on everything from maintenance to rent adjustments.
Here's a straightforward structure you can borrow and adapt for your own spreadsheet. Think of it as your financial filing cabinet.
A Landlord's Chart of Accounts You Can Actually Use
This is a comprehensive breakdown of income and expense categories every landlord needs for precise financial tracking and stress-free tax prep.
| Main Category | Sub-Category | Example Transactions |
|---|---|---|
| Rental Income | Tenant Rent | Monthly rent payment from Tenant A |
| Late Fees | $50 fee for late payment | |
| Pet Fees | One-time non-refundable pet fee | |
| Operating Expenses | Maintenance & Repairs | Leaky faucet repair, drywall patch |
| Utilities | Water, gas, electricity (if not paid by tenant) | |
| Property Management | Monthly fee paid to management company | |
| Property Taxes | Annual or semi-annual tax payment | |
| Insurance | Landlord's insurance premium | |
| Capital Expenditures | Property Improvements | New roof, HVAC system replacement |
| Appliances | New refrigerator for Unit 1 |
With this structure in place—separate tabs, a detailed master ledger, and a clear set of categories—you've built the foundation. Now, every transaction can be logged quickly and accurately, which is exactly what we need for the powerful formulas and dashboards we'll build next.
Getting Smart with Formulas and Key Metrics
Alright, you’ve got all your data logged and organized. This is where your spreadsheet goes from a simple digital ledger to a serious analytical powerhouse. The real value isn't just in tracking where money went; it's about making the spreadsheet tell you how your investment is actually performing. This is how you automate your insights and let the numbers do the talking.
Forget about pulling out a calculator at the end of the month. By building in a few core formulas, every transaction you enter—whether it's rent coming in or a plumber's bill going out—updates your entire financial picture instantly. This is the dynamic feedback loop that separates the pros from the hobbyists.
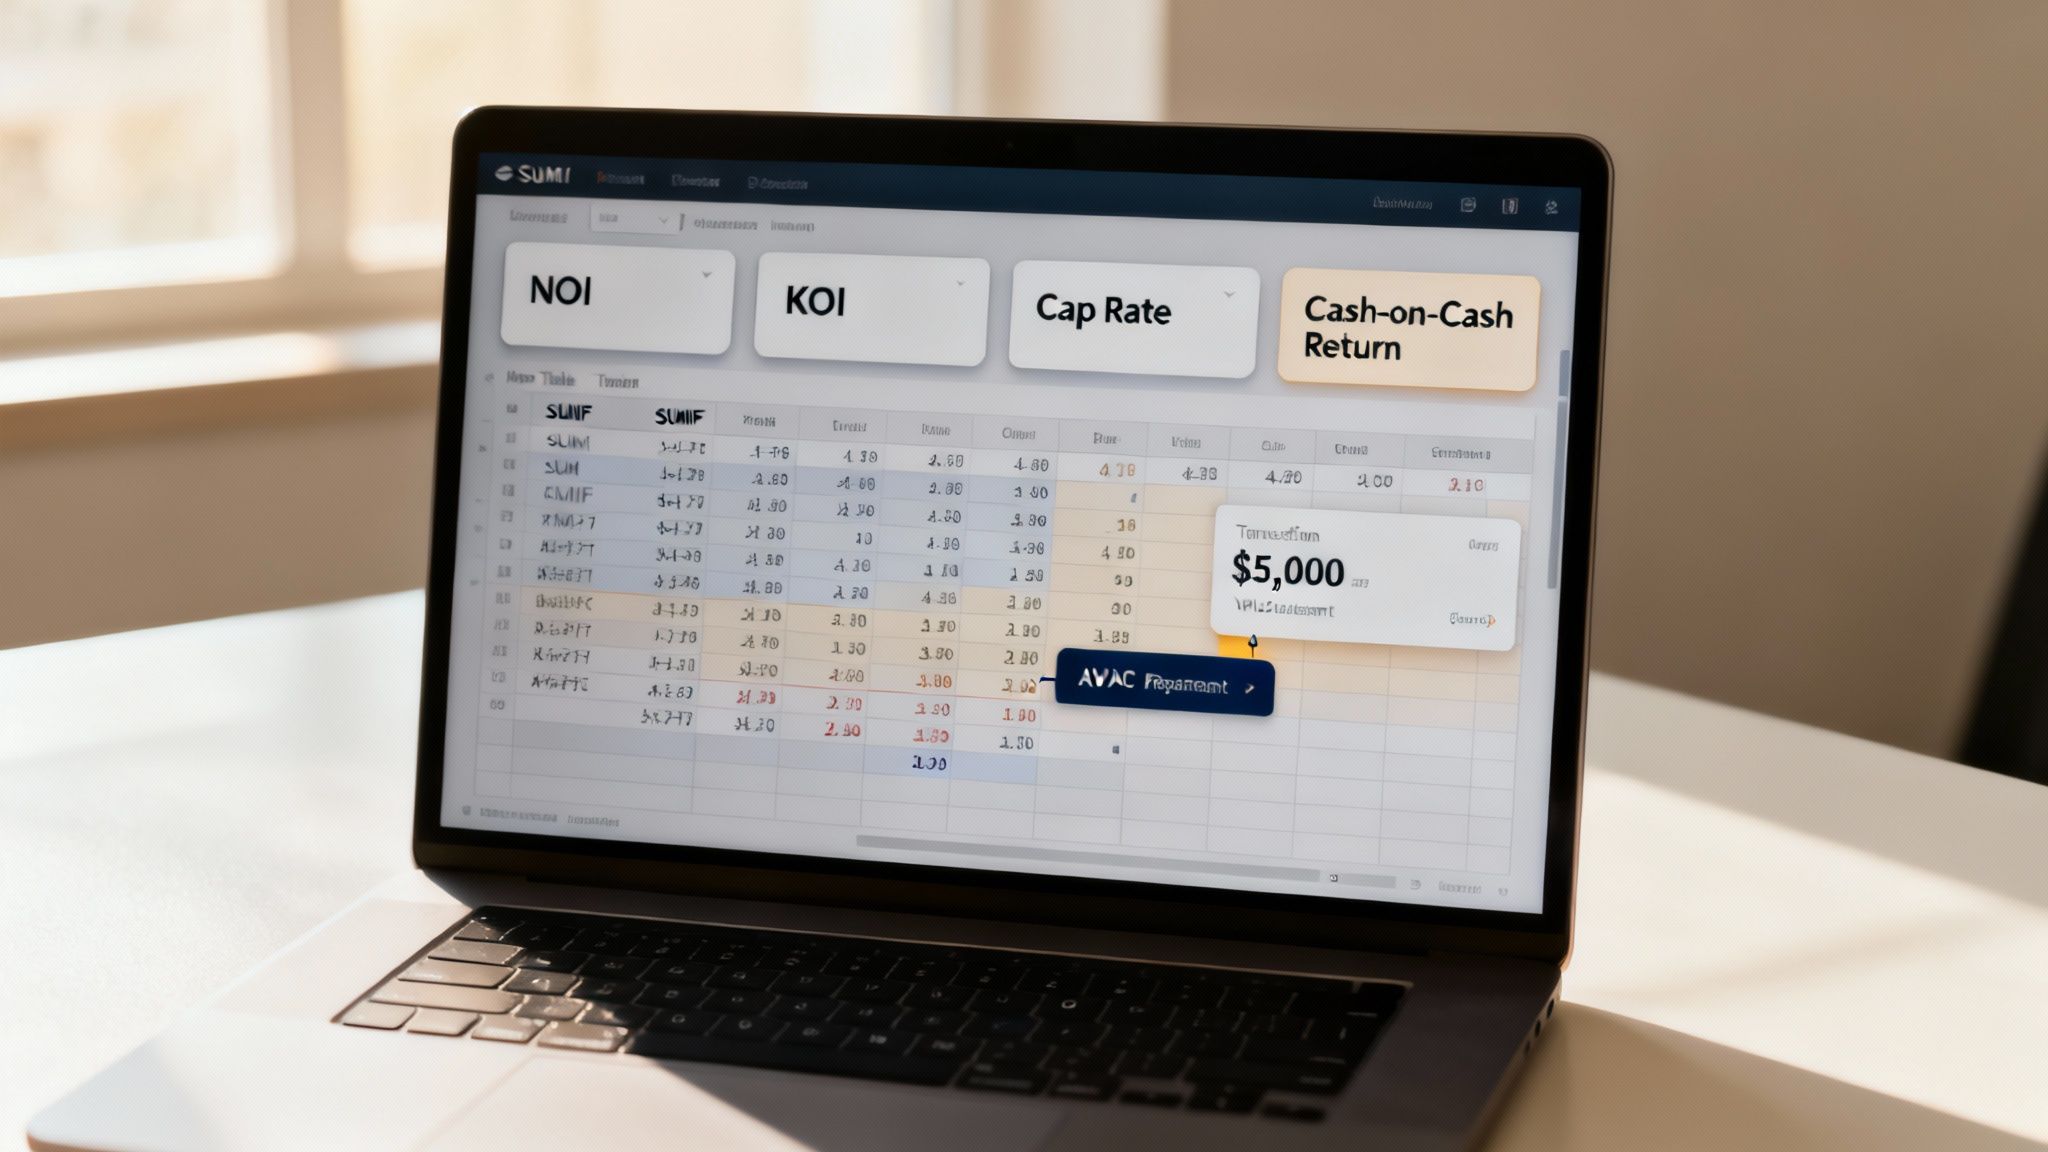
The two most useful tools for this are SUMIF functions and Pivot Tables. A basic SUMIF can instantly add up all expenses tied to "123 Main St" or total all income you’ve categorized as "Tenant Rent." Suddenly, you have a profit and loss statement for each property, updating in real time.
Calculating Your Monthly Cash Flow
Cash flow is the absolute lifeblood of your rental business. It’s what’s left in your pocket after every single bill is paid. Getting this to calculate automatically is your first and most critical move.
On a summary or dashboard tab, you can set up a small table that pulls data directly from your master transaction list. You'll just need one formula for total income and another for total expenses for each property.
Example Formula for Property-Specific Income:=SUMIF(Ledger!B:B, "123 Main St", Ledger!F:F)
This formula simply tells your spreadsheet to scan your "Ledger" tab (in Column B, where you list property names), find every entry matching "123 Main St," and then add up the corresponding numbers from your Amount column (Column F). You'd create a similar one for expenses, and the difference between the two is your cash flow. It’s that easy.
Now, let's say you log a $5,000 HVAC replacement for that property. The second you hit enter, the total expenses for "123 Main St" on your dashboard will update, and your cash flow for the month will drop. No extra math required on your part.
Decoding the KPIs Every Investor Needs to Know
Beyond basic cash flow, seasoned investors use a handful of key performance indicators (KPIs) to measure a property's health objectively. Building these into your spreadsheet gives you a much richer understanding of your portfolio. If you want to dive deeper into the numbers that drive property evaluation, check out our guide on real estate investment analysis spreadsheets.
Here are the three must-have metrics for your dashboard:
Net Operating Income (NOI): This is all your income minus your operating expenses. The key thing here is that NOI does not include your mortgage payment (debt service), major capital improvements, or income taxes. It’s a pure measure of the property's ability to make money from its day-to-day operations.
Capitalization Rate (Cap Rate): You calculate this as
(NOI / Property Purchase Price) * 100. The cap rate shows you the potential rate of return as if you'd paid for the property in all cash. It’s the single best metric for comparing the raw earning potential of different properties, stripping away the influence of financing.Cash-on-Cash Return (CoC): This might be the most important metric for you personally. Calculated as
(Annual Pre-Tax Cash Flow / Total Cash Invested) * 100, it reveals the return you’re getting on the actual money you pulled out of your pocket (your down payment, closing costs, and upfront rehab costs). It directly answers the question, "For every dollar I've put into this deal, how many cents am I getting back each year?"
These aren't just industry buzzwords; they're the language of real estate investing. A fantastic cash-on-cash return might make a lower cap rate perfectly acceptable. A high NOI shows you have a solid operational asset, even if your personal cash flow is thin because of your loan terms.
Understanding these metrics is crucial, no matter where you invest. For example, recent data shows some markets in Tamaulipas, Mexico, offer gross rental yields over 10%. A property there priced around $85,000 could bring in $8,660 in annual rent. Calculating these high yields accurately depends on meticulously tracking income against every property expense—a task your spreadsheet now makes effortless.
By setting aside cells on your dashboard for these formulas, you're no longer just doing bookkeeping. You’re building a live, responsive tool that gives you the clarity to make smart, data-driven decisions about the future of your portfolio.
Taking Your Spreadsheet to the Next Level: Portfolio Management
Once you’re consistently tracking every dollar in and out, your spreadsheet is ready for an upgrade. It’s time to transform it from a simple data log into a powerful portfolio dashboard. This is where you graduate from basic bookkeeping to building a tool that gives you a genuine bird's-eye view of your entire rental business.
The real magic happens when you automate the analysis, turning raw numbers into visual, easy-to-digest insights. When you get this right, your spreadsheet won’t just tell you what happened last month—it will help you make smarter decisions for the years ahead.
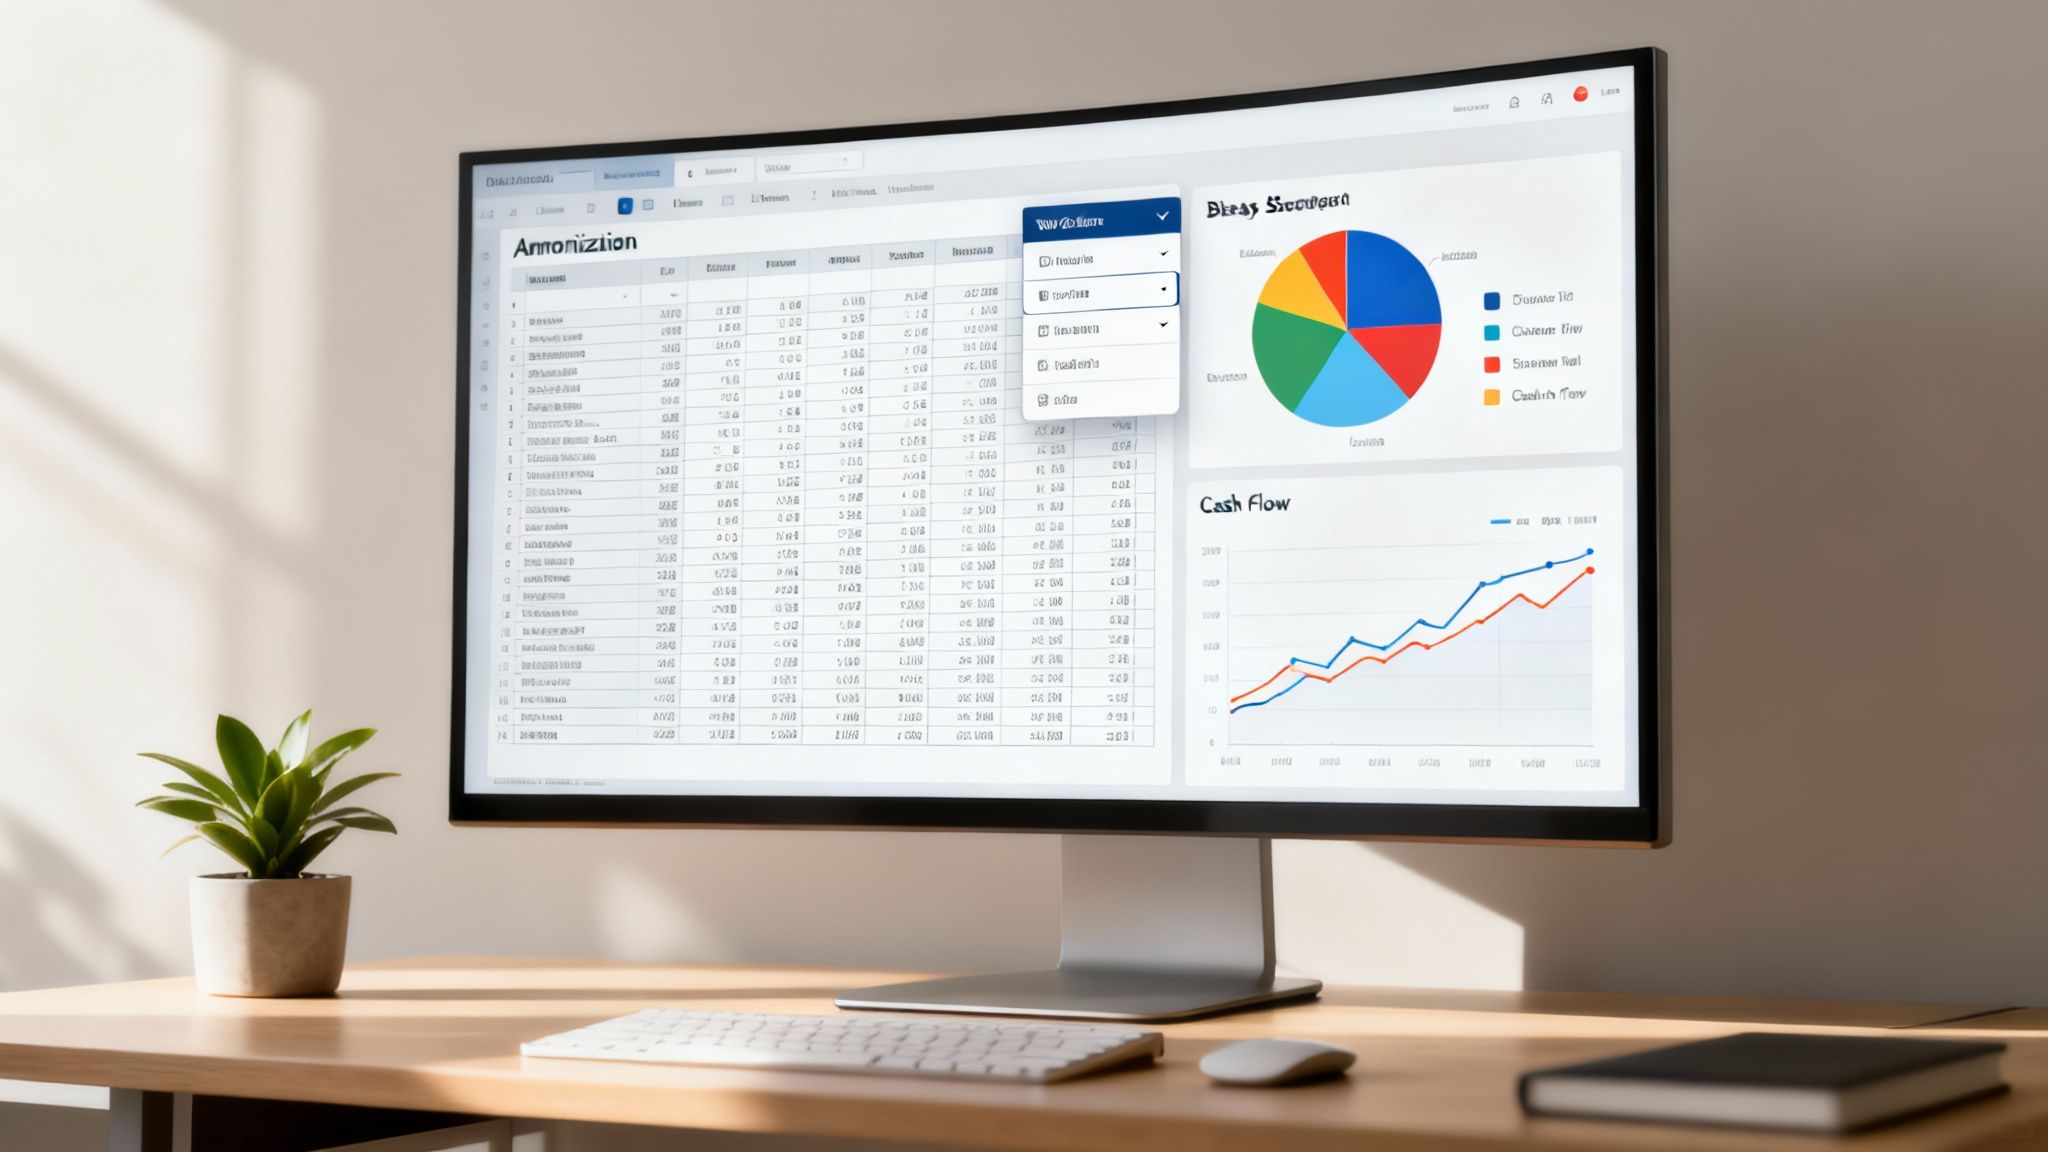
Weave in a Loan Amortization Schedule
One of the most impactful additions you can make to your rental income expenses spreadsheet is a dedicated loan amortization schedule. Sure, your main ledger tracks the monthly mortgage payment as a single expense, but that’s only half the story. A huge chunk of that payment is actually building your equity by paying down principal.
An amortization schedule unpacks each mortgage payment into its two crucial parts:
- Principal: The portion that chips away at your loan balance, directly increasing your equity.
- Interest: The cost of borrowing the money, which is a deductible expense.
By creating a separate tab for each loan, you can map out the entire life of the mortgage. This gives you a crystal-clear, forward-looking view of your equity growth month by month. More importantly, it ensures you’re correctly separating deductible interest from non-deductible principal—a critical distinction for accurate tax reporting and understanding your true financial position.
Integrating an amortization schedule is a game-changer for portfolio analysis. It clarifies exactly how much wealth you are building through debt paydown, a key component of your total return on investment that often gets overlooked in simple cash flow calculations.
This level of detail is essential for making strategic moves, like deciding the perfect time to refinance or sell a property.
Visualize Your Financial Health with Dynamic Charts
Let's be honest, staring at rows of numbers can be draining. Charts and graphs, on the other hand, tell a story at a glance. Visualizing your data makes it instantly obvious where your money is going and how your cash flow is trending over time.
I highly recommend creating a dedicated "Dashboard" tab with a few key charts. You'll get insights in seconds that would otherwise take ages to dig out of the data.
Start with these two essentials:
- Expense Breakdown (Pie Chart): A pie chart that pulls from your categorized expenses is a must. It will immediately show you what percentage of your spending goes toward property taxes, maintenance, management fees, and insurance. Seeing that "Repairs" suddenly account for 35% of your annual expenses is a powerful signal that it might be time to budget for a major capital improvement.
- Monthly Cash Flow (Bar Chart): Plotting your net cash flow each month in a bar chart is invaluable. It helps you see the seasonality of your business—maybe higher utility bills in the winter or a spike in landscaping costs in the summer. To get this right, you'll need to know exactly how to calculate cash flow on a rental property.
The key is to make these charts dynamic—they should update automatically as you add new transactions. This creates a live, evolving picture of your portfolio's financial health.
Lock Down Your Data Integrity with Validation Rules
As your spreadsheet grows, so does the risk of small data entry errors. A simple typo in a category name (like "Maintanance" instead of "Maintenance") can break your formulas and throw off your entire report. The best way I've found to prevent this is by using data validation.
Set up dropdown menus for your "Category" and "Property" columns. This little trick forces every entry to conform to a predefined list you create, completely eliminating typos and ensuring consistency. It’s a simple setup that will save you from major headaches down the road by keeping your data clean and your formulas working flawlessly.
Making Data Entry and Tax Prep Less of a Headache
Let's be honest: a perfect system for tracking your rental income and expenses doesn't do you any good if you never use it. The most sophisticated spreadsheet on the planet is just digital clutter if it’s a pain to keep up with. The secret is building simple, repeatable habits that make logging your numbers quick and painless, turning bookkeeping from a dreaded chore into a fast weekly check-in.
The whole point isn't to spend hours staring at numbers. It’s to create a simple workflow that keeps your financials up-to-date with the least amount of effort. A little bit of consistency now will save you a world of hurt when tax season rolls around.
Building a Data Entry Habit That Sticks
The number one reason landlords get buried in paperwork is that they let tiny tasks pile up until they're facing a mountain of crumpled receipts and unread bank statements. The fix is to break it down into manageable chunks. I’ve found that setting aside just 15 minutes every Friday morning to get my numbers in order is an absolute game-changer.
This quick, focused block of time is all you need for two things:
- Manual Entry: Jot down any cash payments or out-of-pocket expenses from the week. Did you buy a new lock or some paint? Get it in there.
- Bulk Imports: Most banks let you download your latest transactions as a CSV file. You can literally just copy and paste that data into your spreadsheet, then spend a few minutes assigning the right category to each expense.
This tiny habit means your books are never more than a week behind, which completely eliminates that frantic, year-end scramble that trips up so many investors.
You also need a dead-simple way to handle receipts. You don’t need fancy software—a dedicated folder in Google Drive or Dropbox is perfect. Just snap a photo of a receipt with your phone and pop it into a folder named for the property and year (e.g., "123 Main St - 2025 Receipts"). This gives you an instant, searchable, and IRS-friendly digital paper trail.
Think of your rental spreadsheet as a living document, not a once-a-year project. A small, consistent time investment each week prevents mistakes, cuts down on stress, and gives you a real-time view of your portfolio's financial health.
Lining Up Your Categories with Tax Forms
Here’s where all that diligent tracking really pays off. The single biggest win from a well-organized spreadsheet comes from setting up your expense categories to match common tax deductions. When your categories line up with the fields on a tax form like the Schedule E, tax time becomes a ridiculously simple process of running a quick report.
This means you have to be smart about how you classify things. For instance, there's a huge difference between routine repairs and major capital expenditures, and the IRS cares a lot about it.
- Repairs: Things like fixing a leaky pipe or patching a hole in the drywall are everyday expenses. You can typically deduct their full cost in the year you pay for them.
- Capital Expenditures: Putting on a new roof or replacing the entire HVAC system is a major improvement. These costs have to be depreciated over several years, not written off all at once.
Getting the tag right when you first enter the expense is crucial. Mistaking a $10,000 roof for a simple "repair" is a classic red flag that could get you audited.
You should be just as careful about tracking other key deductions. If you drive your personal car for property-related errands—like trips to the hardware store or to show a unit—that mileage is a valuable deduction. I use a simple app, but a dedicated section in your spreadsheet works just as well to log the date, purpose, and miles for each trip. With a system like this, you can hand your accountant a clean, accurate report in minutes, not days.
Answering Common Questions About Your Rental Spreadsheet
Once you start using your rental tracking spreadsheet, you're bound to run into a few real-world questions. Every property is different, and it’s completely normal to hit a few snags as you try to fit messy reality into clean spreadsheet columns. Let’s tackle some of the most common issues I see landlords grapple with.
Getting these little details right is what makes your spreadsheet a powerful tool instead of just a glorified notebook. It keeps your data accurate, makes tax time easier, and helps you make genuinely smart decisions.
How Should I Handle Shared Expenses for a Duplex or Multi-Unit Property?
This is a classic. You've got a duplex, and you get a single water bill. How do you split it up in your spreadsheet? The most important thing here isn't which method you choose, but that you choose one and stick with it. Consistency is key.
The most common approach is just to divide the cost by the number of units. If you get a $100 water bill for a duplex, you'd make two separate entries:
- Entry 1: Unit A, Utilities, -$50
- Entry 2: Unit B, Utilities, -$50
If your units vary a lot in size, you might get more precise by allocating based on square footage. For a property with a 1,200 sq ft unit and an 800 sq ft unit, you could do a 60/40 split of the bill.
My Advice: Whatever you decide, document your method in a "Notes" tab in your spreadsheet. A simple line like "Shared water/trash bills split 50/50" will save you a headache when you're looking back at your numbers a year from now.
What’s the Best Way to Track Security Deposits?
This one trips up a lot of new landlords. It's tempting to log a security deposit as income the moment it hits your bank account, but don't do it. That money isn't yours—it's a liability. You're just holding it. Logging it as income will seriously inflate your revenue and make your cash flow reports worthless.
The best practice is to keep security deposits completely off your main income and expense ledger. Create a separate tab in your workbook just for them.
| Property | Tenant Name | Deposit Amount | Date Received | Date Returned | Amount Withheld | Reason for Withholding |
|---|---|---|---|---|---|---|
| 123 Main St | Jane Doe | $1,500 | 01/15/2024 | 01/20/2025 | $200 | Carpet Cleaning Fee |
| 456 Oak Ave | John Smith | $2,000 | 03/01/2024 |
This simple table keeps everything clean. If you later need to withhold $200 for damages, that's when you record the $200 as income on your main tracking sheet.
Should I Use Excel or Google Sheets?
Ah, the great debate. Honestly, there's no wrong answer here; both Microsoft Excel and Google Sheets are fantastic. It really boils down to your personal workflow.
Excel is the original powerhouse. If you have a massive portfolio or love building complex macros and pivot tables, it's hard to beat its raw analytical muscle and offline capability.
Google Sheets is all about accessibility and collaboration. Being able to pull up your numbers on your phone while standing in a hardware store is a huge plus. It’s also free and makes sharing with a spouse or business partner incredibly simple.
For the vast majority of landlords, I find that Google Sheets hits the sweet spot. It has all the power you really need, and the cloud-based convenience is a game-changer for managing properties on the go.
Spreadsheets are a fantastic way to get started, but when you're ready to stop crunching numbers and start making faster, more confident investment decisions, a purpose-built platform is the natural next step. Property Scout 360 takes the manual work out of the equation, giving you instant ROI, cash flow, and cap rate calculations for any residential property in the U.S. You can find and analyze your next deal in minutes, not weeks.
See how it works at https://propertyscout360.com.
About the Author
Related Articles
2026 Investor's Guide: Cost of Installing a Sewer Clean Out
Understand the cost of installing a sewer clean out for investment properties in 2026. Get expert advice on prices, ROI, & budgeting for flips. Plan smart!
15 Year vs 30 Year Mortgage: The Investor's Choice
Deciding between a 15 year vs 30 year mortgage for a rental property? Our guide analyzes cash flow, ROI, and equity to help you pick the best loan.
Real Estate Appraisal Software: Features & Limits
Discover what real estate appraisal software is, its core features, and limits. See how it differs from investment tools for profitable deals.