Calculate Return on Investment for Rental Property Like a Pro
Learn how to calculate return on investment for rental property using key metrics. Our guide breaks down cap rate, cash-on-cash return, and total ROI.
Figuring out the return on investment for a rental property goes way beyond just subtracting your mortgage payment from the monthly rent. It’s a deep dive into cash flow, how much cash you're putting into the deal, and how your equity will grow over the long haul.
You'll hear experienced investors throw around terms like Cash-on-Cash Return, which is all about how your annual profit stacks up against your down payment. Then there's Cap Rate, a great tool for comparing different properties as if you were paying all cash. And for the long game, you need to understand the Total ROI, which accounts for appreciation and the magic of your loan being paid down over time.
Why Accurate ROI Is Your Most Important Number

Before we jump into the formulas, let's get one thing straight: mastering ROI is the single most important skill you can develop as a real estate investor. This isn't just about crunching numbers for fun. It's about making smart, data-driven decisions that separate the profitable investments from the money pits.
Hoping for market appreciation is a gamble. A solid ROI calculation? That's a repeatable strategy for success.
It's the steady cash flow and the smart use of leverage that truly fuel portfolio growth. Once you get a feel for the core metrics, you'll be able to analyze any deal with confidence and spot the properties that have real potential.
The Three Core Metrics of a Smart Investment
To give you a quick overview, here are the three core ROI metrics every investor needs to know before analyzing a deal. Each one tells you something different, and using them together gives you a complete picture of an investment's potential.
Key Rental ROI Metrics at a Glance
| Metric Name | What It Measures | When to Use It |
|---|---|---|
| Cash-on-Cash Return | The annual cash profit relative to the total cash you invested. | Perfect for comparing deals where you're using a mortgage. It shows the return on your actual out-of-pocket money. |
| Cap Rate | The property's net operating income relative to its market value. | Best for an "apples-to-apples" comparison of properties, as it ignores financing completely. |
| Total ROI | The overall return including cash flow, equity from loan paydown, and appreciation over time. | Essential for understanding the long-term wealth-building power of a property. |
These metrics work together to tell a story. A property might have a modest cash-on-cash return in year one, but if it's in a great area with strong appreciation potential, its Total ROI could be phenomenal over a decade.
It's not just theory, either. Over the last two decades, leveraged single-family rentals in the U.S. have generated an impressive 11.7% annual ROI on average. That kind of performance outpaces many traditional assets and shows exactly why rentals are a cornerstone of wealth creation.
From Manual Math to Automated Insight
Look, it’s crucial to understand how these numbers are calculated by hand. But in today's world, modern tools can do the heavy lifting for you, turning a complex spreadsheet into an actionable plan. This frees you up to focus on strategy instead of being buried in calculations.
If you want to go deeper, check out our complete guide to real estate investment property analysis.
Here’s a quick peek at how a platform like Property Scout 360 lays out this data. It takes all those moving parts and presents them in a clear, easy-to-digest dashboard. You can instantly see projected cash flow, cash-on-cash return, and cap rate, which takes all the guesswork out of your analysis.
Calculating Your Annual Profit with Cash on Cash Return

While long-term appreciation is the dream, cash flow is what pays the bills right now. That's where Cash-on-Cash (CoC) Return becomes your best friend. It cuts through the noise to answer one simple, vital question: "For every dollar I put into this deal, how many cents am I getting back each year?"
This metric is especially critical when you're using a loan because it zeroes in on the actual money coming out of your pocket. It's the purest way to see how hard your invested capital is working for you annually.
The formula itself looks simple enough on paper:
Cash-on-Cash Return = (Annual Pre-Tax Cash Flow / Total Cash Invested) x 100
But to get this right, you have to be brutally honest with the numbers you plug in. Let's walk through a realistic example and see how it all comes together.
Nailing Down Your Total Cash Invested
First things first, let's figure out how much cash you actually brought to the table. This is always more than just the down payment. Forgetting even one of these items will give you a dangerously inflated CoC return, and that’s a recipe for disaster.
Let's imagine we're buying a single-family rental for $350,000 and we've secured a loan with a 20% down payment.
Here’s a realistic breakdown of the cash you'd need:
- Down Payment: This is the big one. On our $350,000 property, 20% is $70,000.
- Closing Costs: These fees are notorious for catching new investors by surprise. They typically run 2-5% of the purchase price and cover loan origination, appraisals, title insurance, and more. Let's budget a conservative 3%, which adds $10,500.
- Initial Renovations: Almost every property needs some TLC before it's "rent-ready." Think fresh paint, new carpet, or minor repairs. We’ll set aside $4,500 for this.
When you add it all up, your true out-of-pocket cost isn't $70,000. It's:
$70,000 (Down Payment) + $10,500 (Closing Costs) + $4,500 (Renovations) = $85,000
This $85,000 is the real number for the bottom half of our formula. It’s the total capital you have tied up in this investment.
Calculating Your Annual Pre-Tax Cash Flow
Now for the top half of the equation: your annual net profit before taxes. This means tallying up all your income and then subtracting every single operating expense. Precision is everything here.
1. Start with Gross Rental Income
Let's say the property rents for $2,400 per month. Over a year, that gives you a gross income of $28,800 ($2,400 x 12).
2. Subtract Your Annual Operating Expenses
This is where optimism can kill a deal. You have to account for everything.
- Mortgage (Principal & Interest): Your loan is for $280,000 ($350k - $70k down). At a 7% interest rate over 30 years, your P+I payment is about $1,863/month, or $22,356/year.
- Property Taxes: Let's estimate these at $4,200 for the year.
- Homeowner's Insurance: A standard policy might run you $1,500 annually.
- Vacancy Allowance: No property stays occupied 100% of the time. A smart investor always budgets for downtime. A conservative 5% of gross rent is $1,440/year.
- Maintenance & Repairs: Things break. Budgeting another 5% of gross rent for unexpected repairs is a good rule of thumb. That’s another $1,440/year.
- Property Management: Even if you self-manage, your time has value. But if you hire a pro, they'll typically charge 8-10%. At 8%, that’s $2,304/year.
Let's total those annual expenses:
$22,356 + $4,200 + $1,500 + $1,440 + $1,440 + $2,304 = $33,240
Hang on a second. Our gross rent is $28,800, but our expenses are $33,240. This property is actually losing $4,440 a year! This is exactly the kind of critical insight that a quick, back-of-the-napkin calculation will miss.
Putting It All Together for the Final ROI
Now we have everything we need to calculate the real Cash-on-Cash Return.
- Annual Pre-Tax Cash Flow: $28,800 (Income) - $33,240 (Expenses) = -$4,440
- Total Cash Invested: $85,000
CoC Return = (-$4,440 / $85,000) x 100 = -5.22%
This example is the perfect illustration of why this detailed analysis is non-negotiable. What might have seemed like a decent deal on the surface turns out to be a money pit when you scrutinize the numbers.
To get a feel for how different variables can change the outcome, you can run your own numbers through our cash on cash return calculator. This metric forces you to be honest with yourself and make decisions based on financial reality, not just optimism.
Using Cap Rate to Compare Investment Properties
While Cash-on-Cash Return is a fantastic personal metric, it doesn't tell the whole story, especially when you're trying to compare different properties. For that, we turn to the Capitalization Rate, or Cap Rate.
Think of Cap Rate as the great equalizer. It measures a property's income potential as if you bought it with all cash, completely stripping away the specifics of your loan. This unleveraged approach gives you an apples-to-apples way to see which property is a better income-generator on its own merit, before your personal financing ever enters the picture. It's my go-to metric for quickly sizing up a deal.
First, You Need the Net Operating Income
The formula itself is pretty simple:
Cap Rate = (Net Operating Income / Property Purchase Price) x 100
The trickiest part is getting the Net Operating Income (NOI) right. NOI is just the property's total income minus all its operating expenses. But there's one critical exception: you must exclude the mortgage payment. We're only looking at the building's performance, not the loan's.
Let's stick with our example property to calculate its NOI.
- Gross Annual Rent: $28,800
- Total Operating Expenses (Excluding Mortgage): This covers everything from taxes and insurance to vacancy, maintenance, and management fees.
From our earlier breakdown, these expenses totaled:
$4,200 (Taxes) + $1,500 (Insurance) + $1,440 (Vacancy) + $1,440 (Maintenance) + $2,304 (Management) = $10,884
Now, we just subtract those expenses from the income:
$28,800 (Gross Rent) - $10,884 (Operating Expenses) = $17,916
The Net Operating Income for this property is $17,916. Easy enough.
Calculating and Making Sense of the Cap Rate
With our NOI locked in, we can finally plug the numbers into the Cap Rate formula for our $350,000 property.
Cap Rate = ($17,916 / $350,000) x 100 = 5.12%
So, we have a Cap Rate of 5.12%. Is that good? Bad? The honest answer from any experienced investor is, "it depends."
A 5% Cap Rate might be an absolute home run in a hot, high-appreciation market like Austin or San Diego. But in a slower, cash-flow-focused market in the Midwest, an investor might not look twice at anything under 8%. It's all relative to the local market conditions and your investment strategy.
Knowing how to calculate cap rate on rental property is crucial because it gives you a standardized benchmark to evaluate deals across different neighborhoods or even across the country.
Pro Tip: I use Cap Rate as a first-pass filter. When I'm sorting through a list of potential deals, I can quickly run the Cap Rate calculation for each. A property showing an unusually high Cap Rate for its area often signals an underpriced gem worth a much deeper look.
Historically, U.S. housing has delivered an average annual return of just 4.2% between 1928 and 2023. By mastering metrics like Cap Rate, you can spot properties that are positioned to blow that long-term average out of the water by focusing on pure income efficiency from day one.
Cap Rate truly gives you an unfiltered look at a property's earning power. For a deeper dive into this crucial calculation, you can learn more about what is cap rate in real estate in our detailed guide. It's a number you absolutely need in your toolkit.
Projecting Total ROI for Long-Term Wealth
While yearly metrics like Cash-on-Cash Return and Cap Rate are fantastic for sizing up a deal right now, real estate is a long game. True wealth isn't built in a year; it's built over decades. That’s where Total Return on Investment (Total ROI) comes in, giving you the full picture of an investment’s performance over its entire life.
To be a successful investor, you have to think long-term. Total ROI is the one metric that rolls up every single wealth-building engine of a rental property: the steady drip of cash flow, the market lifting your property's value, and the equity you build as your tenants dutifully pay down your mortgage month after month.
The Three Pillars of Total Profit
Calculating Total ROI is simple on the surface, but the real power is in understanding what goes into "Total Profit."
Total ROI = (Total Profit / Total Cash Invested) x 100
What is Total Profit? It's the sum of three distinct financial gains you'll see over the time you own the property:
- Cumulative Cash Flow: This is all the net profit you've pocketed after collecting rent and paying bills, added up over all the years you've held the property.
- Property Appreciation: It's the difference between what you bought the property for and what you can sell it for later. Simple, yet powerful.
- Loan Principal Paydown: This is the portion of your mortgage that’s been paid off by rent money. It's forced savings that directly builds your net worth.
This all-in-one view is what really shows you how leverage can turbocharge your returns, often creating a level of wealth that a modest annual cash flow just can't compete with on its own.
A 10-Year Wealth Projection
Let's go back to our $350,000 property example, but instead of looking at one year, let's fast-forward a decade. We'll stick with our initial Total Cash Invested of $85,000.
First, we have to project out our profit sources over those 10 years.
- Cumulative Cash Flow: In our last example, this property was actually losing -$4,440 a year. Over a decade, that's a -$44,400 hole, which is a perfect illustration of why starting with positive cash flow is so critical. Let's adjust our assumptions and say we got the rents up to produce a positive cash flow of $2,000/year. Over 10 years, that’s $20,000.
- Property Appreciation: We'll use a conservative 3% annual appreciation rate. After 10 years, our $350,000 property would be worth around $470,370. That’s $120,370 in equity created just from market growth.
- Loan Principal Paydown: Looking at the amortization schedule for our $280,000 loan at 7%, after 120 payments (10 years), we'd have paid down about $43,500 of the principal.
Now, let's add it all up to find our Total Profit:
$20,000 (Cash Flow) + $120,370 (Appreciation) + $43,500 (Loan Paydown) = $183,870
And finally, we can calculate our 10-Year Total ROI:
($183,870 / $85,000) x 100 = 216.3%
That breaks down to an average annualized return of 21.6%. This is exactly how leveraged real estate can create incredible wealth over time. To get these numbers right for your own deals, using a vacation rental investment calculator can be a huge help in forecasting profits and ROI accurately.
How Financing Choices Shape Your Future
The financing decisions you make on day one will send ripples across your entire investment journey. A slightly different down payment or interest rate can completely change your financial outcome a decade from now. This is precisely why it’s so important to run different scenarios when you calculate the return on investment for a rental property.
A strong starting position matters. In many top global rental markets, it's not uncommon to see initial yields around 7.2% for 2-bedroom properties. When you can lock in a solid yield, combine it with good financing, and let appreciation work its magic, you can build a Total ROI that gives the stock market a serious run for its money.
This chart breaks down the components of Cap Rate, a core metric for analyzing a property's income potential before you factor in financing.
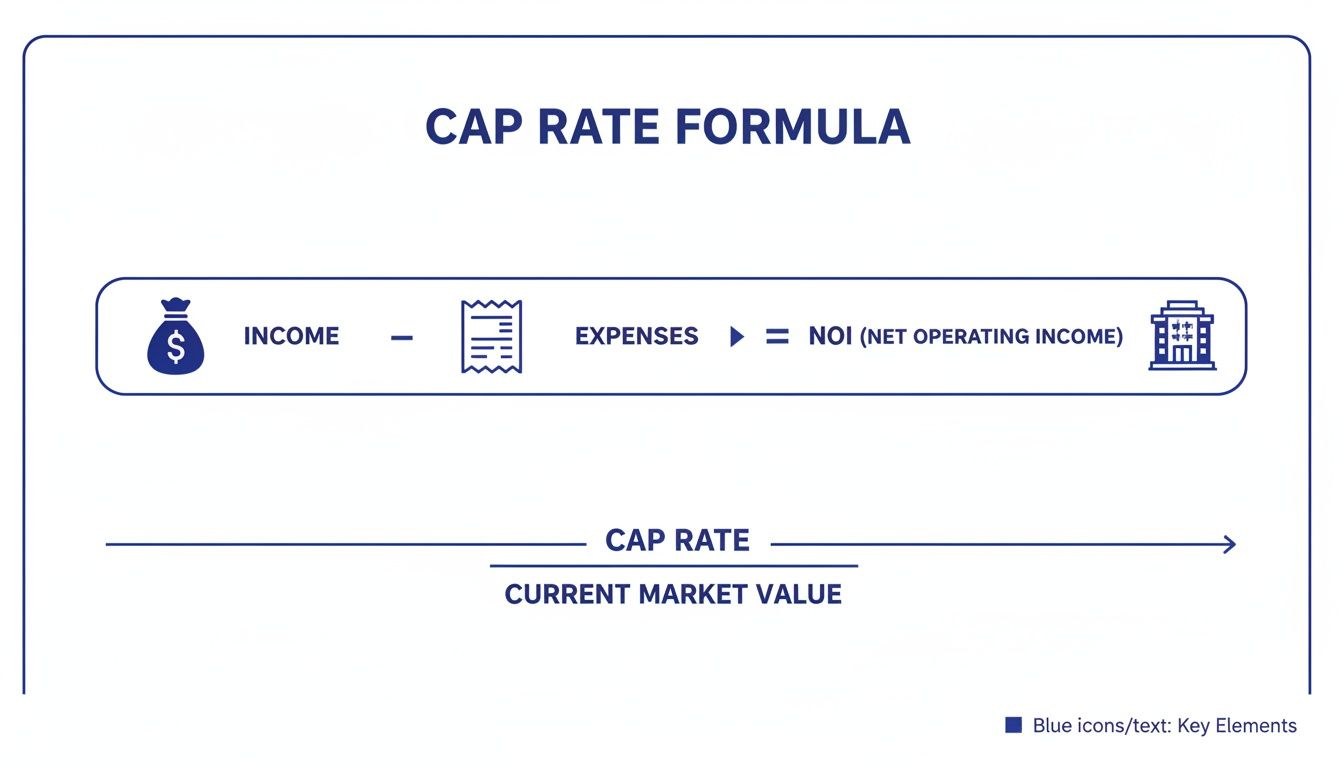
As you can see, your Net Operating Income (NOI)—the profit engine of the property—is simply your rental income minus all your operating expenses.
10-Year Total ROI Projection Scenarios
To really drive home the impact of financing, here’s a look at how different down payment and interest rate scenarios could affect the 10-year Total ROI for a hypothetical $300,000 property.
| Financing Scenario | Total Cash Invested | Projected 10-Year Profit | Projected 10-Year Total ROI |
|---|---|---|---|
| 20% Down / 6.5% Rate | $65,000 | $165,000 | 254% |
| 25% Down / 6.5% Rate | $80,000 | $170,000 | 213% |
| 20% Down / 7.5% Rate | $65,000 | $145,000 | 223% |
| 25% Down / 7.5% Rate | $80,000 | $150,000 | 188% |
Notice how a lower down payment (more leverage) and a lower interest rate combine to produce the highest long-term ROI. Small changes at the start lead to big differences down the road.
Tools like Property Scout 360 are designed to do this heavy lifting for you. Here’s a look at a 30-year projection report from the platform.
See how it automatically calculates and graphs the growth in your equity from both appreciation and the loan being paid down? It gives you a clear, visual forecast of how your wealth can build over the long haul.
Let's Make This Easier: Automating Your ROI Calculations
Okay, we've just waded through the nitty-gritty of calculating Cash-on-Cash Return, Cap Rate, and Total ROI by hand. It’s crucial to understand how those numbers come together—to know what drives your expenses, how a mortgage changes the equation, and why looking 30 years down the road is so important.
But let's be honest. Doing all that math on a spreadsheet for every single property you look at? It's a fantastic way to learn the ropes, but it's not a sustainable way to build a portfolio. A single typo—a misplaced decimal, a forgotten expense line—can completely torpedo your analysis and lead you into a bad deal. This is where you stop being a mathematician and start being a strategic investor, and that means using the right tools for the job.
From Tedious Spreadsheets to Instant Clarity
Picture this: you find a property that looks promising. Instead of firing up Excel and spending the next hour plugging in formulas, you just type in the address. A few seconds later, a complete financial breakdown pops up with all your key ROI metrics already calculated.
That’s exactly what a platform like Property Scout 360 is built for. It takes the human error out of the equation and turns what could be a week's worth of manual analysis into a few clicks.
You get an instant, easy-to-read report that shows you:
- Cash-on-Cash Return: Your first-year return based on the exact down payment and closing costs you plan to use.
- Cap Rate: The property's raw, unleveraged earning power, perfect for comparing it to other deals on the market.
- Long-Term ROI Projections: A clear picture of your wealth growth over 10, 20, or 30 years, with appreciation and loan paydown baked in.
This kind of immediate feedback is a game-changer. It lets you sift through dozens of potential deals in the time it used to take to analyze just one. In a competitive market, that speed is a massive advantage.
Playing with the Numbers: How to Stress-Test a Deal
The real power here isn't just about speed; it's about flexibility. A good tool doesn't just give you one static answer—it gives you a dynamic dashboard to see how the deal holds up under pressure.
A savvy investor doesn't just analyze a deal based on today's numbers. They stress-test it against future possibilities. What if interest rates rise? What if vacancy is higher than expected? Automation makes this professional-grade analysis accessible to everyone.
With a tool like Property Scout 360, you can instantly see how your bottom line changes with different loan terms. Compare a 30-year fixed against a 15-year mortgage. See what happens to your Cash-on-Cash Return when you put 20% down versus 25%. This is the sensitivity analysis that separates amateur investors from the pros, and it’s essential for building a strategy that you’re truly comfortable with.
Dialing in the Details for the Real World
On top of that, we all know that generic rules of thumb don't cut it. No two properties have the same exact expenses. Automation lets you go beyond ballpark estimates and plug in real, local numbers for a much sharper forecast.
You can fine-tune every single variable that affects your net operating income:
- Property Taxes: Pull the actual figures from county records.
- Insurance: Drop in the real quote you got from your agent.
- Vacancy: Adjust the rate based on what's happening in that specific neighborhood.
- Repairs & Maintenance: Set aside custom amounts for routine upkeep and big-ticket items like a new roof or HVAC.
This level of detail is what turns a rough guess into a reliable financial projection. It’s how you calculate the return on investment for a rental property with genuine confidence, ensuring every move you make is backed by solid, defensible data.
Your Top Rental Property ROI Questions, Answered
Once you’ve got the formulas down, the real questions start popping up. Real estate investing isn't a textbook problem; it’s a messy, real-world business full of nuances. Getting these details right is what separates the pros from the amateurs who are just winging it.
Let's dig into the questions I hear most often from investors analyzing their deals.
What’s a Good ROI on a Rental Property, Really?
Honestly, there is no magic number. Anyone who gives you one is oversimplifying things. What counts as a “good” return depends entirely on your market, your personal financial goals, and your stomach for risk. Chasing some universal percentage is a classic rookie mistake.
Many investors I know target a Cash-on-Cash Return of 8-12% or higher. That’s a solid benchmark because it tells you the property is generating strong cash flow against the money you pulled out of your pocket.
But for Cap Rate, context is everything. A 5% Cap Rate might be a fantastic deal in a hot, high-appreciation market like Austin, Texas. But in a stable, cash-flow-focused market in the Midwest? An investor there might not even glance at a deal unless it’s hitting an 8% Cap Rate or better.
The real key is to stop hunting for a single "good" number and start thinking like a local. Know the comps in your target neighborhood, understand the economic drivers, and set a personal benchmark that matches your strategy—whether that's fast growth or steady, reliable income.
How Do I Factor in a New Roof or Other Big Repairs?
This is one of the most critical and most frequently botched parts of any ROI calculation. You have to budget for Capital Expenditures, or CapEx. These are the big-ticket items—the roof, the HVAC system, the water heater—that you know will eventually fail. This isn't your slush fund for fixing a leaky faucet; it's a separate, dedicated reserve.
Forgetting to account for CapEx is the fastest way to turn a "great deal" on paper into a financial nightmare down the road.
A good rule of thumb is to set aside 1-2% of the property's purchase value every year just for these major expenses.
Let’s see how that works in practice:
- Property Value: $300,000
- Annual CapEx Reserve (at 1.5%): $4,500 per year
- Monthly CapEx Savings: $375 per month
You need to treat that $375 as a real, non-negotiable monthly expense in all your calculations. It's money you're physically moving into a separate savings account, building up a war chest. When that furnace dies in five years, you'll be glad you did.
Does ROI Include Property Appreciation?
This question gets to the heart of why using the right metric at the right time is so important. The answer is: it completely depends on which formula you’re using.
Cash-on-Cash Return and Cap Rate: No. These two metrics are designed to measure a property's current income performance, completely excluding appreciation. Think of them as a snapshot of how the asset is performing today based on the cash it generates. They're perfect for comparing the operational health of different deals.
Total ROI: Yes, absolutely. This is the long-term, big-picture metric. It's specifically built to capture all three ways real estate builds wealth: the cash flow you pocket, the loan principal your tenant pays down for you, and the equity you gain as the property (hopefully) appreciates in value.
Use CoC and Cap Rate to vet a deal today. Use Total ROI to forecast your wealth-building potential over the next decade.
Should I Calculate ROI Before or After Taxes?
When you're first sifting through potential deals, almost everyone uses pre-tax calculations. The standard formulas for Cash-on-Cash Return and Cap Rate are designed to be pre-tax. This gives you a quick and clean way to compare multiple properties on an apples-to-apples basis without getting lost in the weeds of your personal tax situation.
However, once you get serious about a specific property, you absolutely must run the numbers again to find your after-tax return. Real estate offers some incredible tax advantages that can significantly sweeten the deal. You can deduct:
- Mortgage interest
- Property taxes
- Operating expenses
- Depreciation (this is a big one—a non-cash expense that can slash your taxable income)
These benefits can easily turn a decent pre-tax ROI into a fantastic after-tax one. So, get efficient at screening deals with pre-tax numbers, but always make your final decision based on the after-tax reality.
Ready to stop guessing and start analyzing deals with confidence? Property Scout 360 automates every calculation we've discussed—from Cash-on-Cash Return to 30-year Total ROI projections. Find and evaluate your next profitable rental property in minutes, not weeks. Get started for free at Property Scout 360.
About the Author
Related Articles
2026 Investor's Guide: Cost of Installing a Sewer Clean Out
Understand the cost of installing a sewer clean out for investment properties in 2026. Get expert advice on prices, ROI, & budgeting for flips. Plan smart!
15 Year vs 30 Year Mortgage: The Investor's Choice
Deciding between a 15 year vs 30 year mortgage for a rental property? Our guide analyzes cash flow, ROI, and equity to help you pick the best loan.
Real Estate Appraisal Software: Features & Limits
Discover what real estate appraisal software is, its core features, and limits. See how it differs from investment tools for profitable deals.