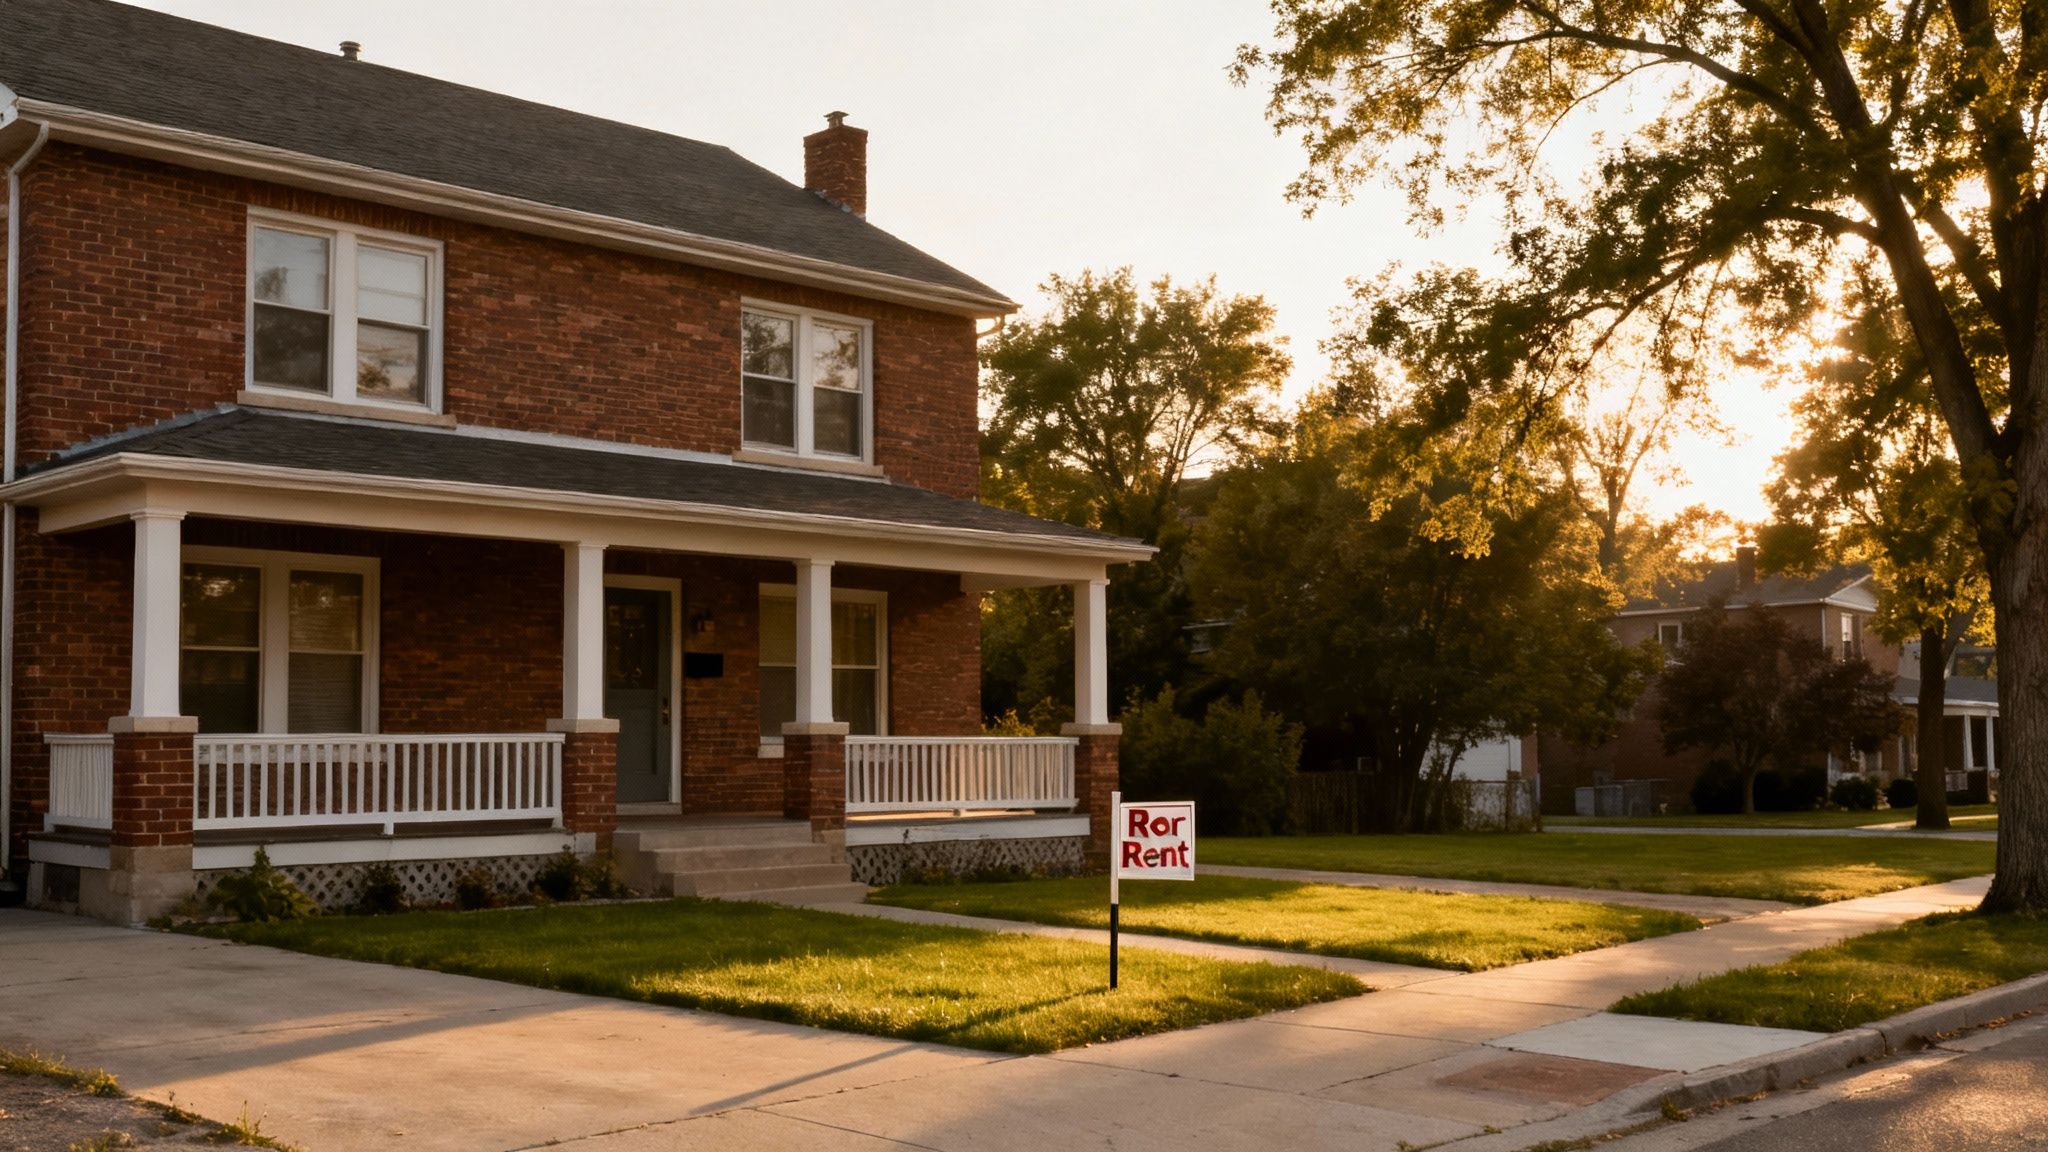
The Top 12 Best Markets for Rental Properties in 2025
Discover the best markets for rental properties in the U.S. This data-driven guide ranks 12 top cities for cash flow, growth, and long-term ROI in 2025.
Choosing the right location is the single most critical decision for a real estate investor. While headlines often focus on skyrocketing coastal prices, the true opportunities for consistent cash flow and sustainable appreciation lie in markets with strong fundamentals. But how do you separate hype from reality? This guide moves beyond generic advice, offering a data-driven breakdown of the 12 best markets for rental properties in the U.S. for 2025.
We'll dissect each city based on key investor profiles, from high-growth tech hubs like Austin for appreciation seekers to stable Midwest value plays like Indianapolis for cash-flow purists. For each market, we provide the critical metrics that matter:
- Capitalization (Cap) Rates
- Rental Yields and Gross Rent Multipliers
- Job and Population Growth
- Price-to-Rent Ratios
This isn't just a list; it's a strategic roadmap. A fundamental metric for evaluating potential investments, learning how to calculate rental yield for your investment property is essential before diving into any market analysis. This article will equip you not only with the "where" but also the "why," including actionable steps to find deals using powerful analysis tools. Our goal is to help you identify, analyze, and confidently invest in the market that perfectly aligns with your financial goals, whether you are a first-time investor or a seasoned professional scaling your portfolio.
1. Austin, TX - High Growth Tech Hub
Austin's transformation into a major tech hub has fueled one of the most dynamic rental markets in the country. Driven by relentless job and population growth from companies like Tesla, Oracle, and Apple, the city attracts a steady stream of high-earning young professionals and remote workers. This creates a robust and reliable tenant base, making it one of the best markets for rental properties focused on long-term appreciation and strong rent growth.
Market Snapshot & Investor Profile
The numbers speak for themselves: investors can target average annual rent growth of 6-8%, with capitalization rates typically falling between 5-6.5%. The consistent demand keeps vacancy rates tight at 4-6%, ensuring stable occupancy for well-managed properties. This market is ideal for investors comfortable with higher entry prices who prioritize appreciation and a strong, qualified tenant pool.
- Property Archetype 1 (Appreciation Play): A single-family home in a South Austin suburb like Circle C Ranch, purchased for $450,000 and renting for $2,600/month to a young family.
- Property Archetype 2 (Cash Flow & Value-Add): A BRRRR (Buy, Rehab, Rent, Refinance, Repeat) project on a 1970s-era home in an evolving East Austin neighborhood, acquired below market value with renovation potential.
How to Win in the Austin Market
Success in Austin requires a strategic, neighborhood-focused approach. Focus on properties near major tech employment corridors like the Domain or the U.S. 183 corridor to minimize vacancy. Consider emerging neighborhoods just outside the downtown core to find better acquisition prices and higher cap rates. A deep dive into a property's financials is crucial; you can learn more about how to perform a detailed real estate investment property analysis to ensure your numbers work.
How to Evaluate with Property Scout 360: Use the "Market Growth" filter to identify Austin zip codes with the highest 6 and 12-month rent growth projections. Cross-reference these areas with the "Job Proximity" score to pinpoint neighborhoods benefiting directly from corporate expansions.
2. Indianapolis, IN - Stable Midwest Value Play
Indianapolis offers exceptional value for cash flow-focused investors seeking consistent returns without the volatility of high-growth coastal markets. The city’s stable, diversified economy and remarkably affordable property prices create a prime environment for buy-and-hold strategies. This affordability makes it one of the best markets for rental properties if your goal is to build a large portfolio that generates steady monthly income.
Market Snapshot & Investor Profile
The financial metrics in Indianapolis are highly attractive for those prioritizing immediate returns. Investors can find capitalization rates of 7-8.5%, with strong rental yields of 5.5-6.5%. While annual rent growth is more moderate at 2-3%, the low vacancy rates of 5-7% provide reliable occupancy. This market is perfect for investors looking to acquire multiple properties and generate significant cash flow from day one.
- Property Archetype 1 (Cash Flow King): A well-maintained Eastside duplex purchased for under $200,000, with each unit renting for $950-$1,200/month, achieving a cap rate over 8%.
- Property Archetype 2 (Portfolio Builder): A long-term buy-and-hold single-family home in a C-Class neighborhood, generating $500+ in monthly cash flow after all expenses.
How to Win in the Indianapolis Market
Success in Indianapolis hinges on diligent financial analysis and careful tenant screening. Target C-Class neighborhoods with improving school ratings and good access to employment hubs. Due to the older housing stock, it is wise to build a 25% reserve of the rental price for maintenance. Understanding your numbers is paramount; you can learn more about calculating rental property ROI to ensure your deals are profitable.
How to Evaluate with Property Scout 360: Use the "Cash Flow Calculator" to model expenses for Indianapolis properties, paying close attention to the age of the home. Filter for properties with a "Cap Rate" above 7% and a "Price-to-Rent Ratio" below 15 to quickly identify high-yield opportunities that fit the local market profile.
3. Phoenix, AZ - Sunbelt Growth Corridor
Phoenix stands as a cornerstone of Sunbelt growth, attracting a diverse influx of retirees, young families, and remote workers seeking affordability and sunshine. This relentless population boom, coupled with a growing job market in tech and healthcare, creates a consistently high demand for rental housing. For investors, this translates into a balanced market that offers both steady cash flow and strong potential for appreciation, making it one of the best markets for rental properties in the Southwest.

Market Snapshot & Investor Profile
Phoenix offers an attractive blend of metrics, with capitalization rates between 5.5-7% and annual rent growth averaging 4-5%. Vacancy rates remain low at 5-7%, reflecting the persistent housing demand. This market is ideal for investors looking for a balanced strategy, with more accessible entry prices than premier coastal markets. The diverse tenant pool supports various investment models, from single-family rentals to student housing.
- Property Archetype 1 (Cash Flow Play): A single-family home in a master-planned community like Chandler or Gilbert, purchased for $380,000 and renting for $2,400/month to a relocating family.
- Property Archetype 2 (Student Housing): A townhouse or condo near Arizona State University in Tempe, targeting higher yields and consistent occupancy driven by the academic calendar.
How to Win in the Phoenix Market
Success in Phoenix means targeting established neighborhoods with strong infrastructure and job proximity. Focus on properties with updated HVAC systems, as this is a major and frequent expense in the desert climate. It's also vital to factor mandatory HOA fees into your calculations, as they can significantly impact your net returns. Understanding how to accurately figure out your profitability is key; you can learn more about how to calculate a property's cap rate in real estate to ensure your deals are solid.
How to Evaluate with Property Scout 360: Use the "Cash Flow Potential" filter to identify Phoenix zip codes with the best rent-to-price ratios. Layer this with the "School Rating" filter to find neighborhoods in high demand with families, which often correlates with lower vacancy rates and long-term tenants.
4. Nashville, TN - Rising Star Entertainment Market
Nashville's reputation as "Music City" now shares the stage with its booming economy, drawing in young professionals, healthcare workers, and creatives alike. This explosive growth, powered by the entertainment, healthcare, and tech industries, has created a high-demand rental landscape. For investors, this translates into one of the best markets for rental properties, offering a blend of solid appreciation and consistent tenant demand from a diverse demographic.
Market Snapshot & Investor Profile
Nashville delivers strong performance metrics for savvy investors. Expect average annual rent growth between 5-7% and capitalization rates in the 5-6.5% range. The city's tight vacancy rates, typically 4-6%, underscore the consistent demand for quality housing. This market is a great fit for investors looking for a balance of cash flow and long-term equity growth, willing to explore emerging neighborhoods for higher returns.
- Property Archetype 1 (Cash Flow Play): A renovated single-family home in an emerging East Nashville neighborhood, purchased for $280,000 and generating $1,700/month in rent from young professionals.
- Property Archetype 2 (Suburban Growth): A newer build in the Murfreesboro suburb, targeting families drawn by strong job growth and good schools, achieving a 6.5% cap rate.
How to Win in the Nashville Market
To succeed in Nashville, investors should look beyond the high-priced downtown core. Focus on evolving areas like East and South Nashville where acquisition costs are lower and yields are higher. Target properties near major employment hubs like Vanderbilt University Medical Center or HCA Healthcare to attract a stable tenant base. Consider house-hacking a duplex to offset rapidly rising property prices, a strategy that works well in neighborhoods popular with younger renters.
How to Evaluate with Property Scout 360: Use the "Neighborhood" filter to analyze submarkets like The Nations or East Nashville. Layer the "Rental Yield" and "Cap Rate" metrics to identify properties that outperform the city average and pinpoint deals with strong immediate cash flow potential.
5. Memphis, TN - Deep Value Dividend Market
Memphis offers a compelling proposition for investors who prioritize immediate and robust cash flow above all else. With some of the lowest entry costs in the nation, the market is defined by its exceptionally high capitalization rates and strong rental yields. Major employers like FedEx, International Paper, and a growing medical sector provide a stable economic base, sustaining rental demand for affordable housing and making Memphis one of the best markets for rental properties geared toward aggressive cash flow generation.
Market Snapshot & Investor Profile
The financial metrics in Memphis are hard to ignore. Investors can target capitalization rates of 8-10% and rental yields of 6-7%. While annual rent growth is more modest at 2-3%, the low median property price of around $140,000 allows for rapid portfolio scaling. Vacancy rates are slightly higher at 6-8%, reflecting the nature of the tenant base. This market is perfect for cash flow investors and those looking to build a large portfolio with minimal initial capital.
- Property Archetype 1 (High Yield Play): A Midtown condo purchased for $130,000, renting for $1,100/month and generating a 9-10% cap rate.
- Property Archetype 2 (Portfolio Builder): A portfolio of single-family homes in 'B' class neighborhoods, each producing $400-600 in monthly cash flow after all expenses.
How to Win in the Memphis Market
Success in Memphis requires a disciplined, risk-managed approach. Focus exclusively on 'A' and upper 'B' class neighborhoods to mitigate tenant risk and avoid distressed areas. It's essential to budget a higher-than-average reserve for vacancy and maintenance, as lower-priced housing stock can incur more frequent costs. Given the hands-on nature of the market, hiring a vetted, high-quality property manager is not a luxury but a necessity for out-of-state investors.
How to Evaluate with Property Scout 360: Use the "Cash Flow Calculator" to model conservative expense scenarios, inputting 8-10% for both vacancy and maintenance reserves. Filter for properties in zip codes with high "Neighborhood Stability" scores to identify quality pockets and avoid riskier submarkets.
6. Denver, CO - Rocky Mountain Growth Market
Denver stands out as one of the best markets for rental properties due to its potent mix of lifestyle appeal and economic stability. The city's thriving job market, particularly in tech, aerospace, and healthcare, draws a consistent flow of young professionals and remote workers seeking both career opportunities and outdoor recreation. This sustained in-migration creates a deep and diverse tenant pool, supporting a rental market that expertly balances immediate cash flow potential with long-term appreciation.
Market Snapshot & Investor Profile
Denver’s metrics signal a healthy, mature market. Investors can expect capitalization rates of 5-6.5% and steady annual rent growth between 4-6%. Vacancy rates remain low at 4-6%, a testament to the high demand for quality housing. This market is perfect for investors who want a blend of reliable monthly income and solid asset growth, without the extreme price volatility seen in some coastal hubs.
- Property Archetype 1 (Balanced Play): A single-family home in a South Denver suburb like Littleton, purchased for $380,000 and renting for $2,100/month to a family seeking good schools.
- Property Archetype 2 (Premium Rent): A townhome near the Boulder County tech corridor, attracting high-earning professionals and commanding premium rents due to its proximity to major employers.
How to Win in the Denver Market
Success in Denver requires a nuanced approach that considers both location and unique environmental factors. Focus on suburbs like Aurora and Westminster for better acquisition prices and stronger cap rates than central Denver. Be sure to budget for altitude-related maintenance, such as HVAC strain and increased roof wear. Given the area's frequent hailstorms, securing comprehensive hail insurance is a non-negotiable part of protecting your investment.
How to Evaluate with Property Scout 360: Use the "Seasonality" tool to analyze Denver's unique rental patterns, identifying peak leasing months to minimize vacancy. Layer this with the "Neighborhood Score" filter to find suburbs with the best combination of school ratings, safety, and job access, maximizing tenant appeal.
7. Louisville, KY - Underrated Midwest Gem
Louisville presents a compelling case for investors prioritizing cash flow and affordability. This often-overlooked Midwest market is anchored by stable industries like healthcare and logistics, with major employers like UPS, Humana, and several large hospital systems. This economic foundation provides a steady tenant base of healthcare workers, manufacturing employees, and logistics professionals, making Louisville one of the best markets for rental properties for those seeking high yields without the high entry costs of coastal cities.
Market Snapshot & Investor Profile
Louisville shines with its strong cash-flow metrics. Investors can target capitalization rates between 7-8.5%, with rent yields typically falling between 5-6%. The affordability is a major draw, with a median property price near $180,000. While rent growth is more moderate at 2-3% annually, the low acquisition cost makes it an ideal market for new investors or those looking to scale a portfolio with multiple cash-flowing assets.
- Property Archetype 1 (Cash Flow King): An updated duplex in East Louisville purchased for $250,000, with each unit renting for $1,050/month to healthcare professionals.
- Property Archetype 2 (Value & Character): A converted Victorian multifamily unit in Old Louisville, offering solid yields and attracting tenants who appreciate historic charm.
How to Win in the Louisville Market
Success in Louisville hinges on neighborhood selection and rigorous tenant screening. Focus on properties near the University of Louisville, the downtown medical district, and major logistics hubs to attract a stable tenant pool. Targeting upper-C to lower-B class properties often provides the best balance of acquisition cost, rental income, and property condition. Due to the diverse tenant base, strong screening is more critical here than in higher-income markets to ensure consistent payments and low turnover.
How to Evaluate with Property Scout 360: Use the "Cash Flow Potential" filter to identify Louisville neighborhoods with the highest cap rates. Cross-reference these areas with the "Neighborhood Stability" score to find pockets with low historical tenant turnover, indicating a reliable and consistent rental environment.
8. Raleigh-Durham, NC - Triangle Tech Growth
The Raleigh-Durham area, known as the Research Triangle, offers a compelling mix of robust tech employment and educational infrastructure. This synergy fuels consistent demand from a high-quality tenant pool of researchers, tech professionals, and graduate students. Unlike more mature tech hubs, the Triangle provides a balanced investment, making it one of the best markets for rental properties for those seeking both appreciation and steady cash flow without paying coastal prices.
Market Snapshot & Investor Profile
Investors here benefit from a stable economic foundation. The market delivers average annual rent growth of 4-5%, with capitalization rates sitting comfortably between 5.5-7%. Strong and consistent demand from major employers and universities keeps vacancy rates in the tight 5-7% range. This market is perfect for investors looking for a growth market with more reasonable entry points and a diverse, educated tenant base.
- Property Archetype 1 (Stable Cash Flow): A single-family home near Chapel Hill purchased for around $340,000, renting for $1,750/month to a young family or university staff.
- Property Archetype 2 (Higher Yield Play): A duplex in an up-and-coming East Durham neighborhood, targeting a 6-7% cap rate and benefiting from the area's ongoing revitalization.
How to Win in the Raleigh-Durham Market
Success in the Triangle means focusing on employment and education hubs. Prioritize properties with easy commutes to Research Triangle Park or major universities like Duke, UNC, and NC State. While Raleigh is more established, Durham often presents better opportunities for higher cap rates and value-add potential. For higher returns, consider professionally managed student housing, which benefits from predictable demand cycles tied to the academic calendar.
How to Evaluate with Property Scout 360: Utilize the "Neighborhood" filter to compare cap rates directly between Durham and Raleigh submarkets. Overlay the "Employer Proximity" score to identify properties within a 15-minute commute of major tech campuses in Research Triangle Park, ensuring you target the most desirable locations for high-income tenants.
9. Tampa-St. Petersburg, FL - Sun State Value
The Tampa Bay area offers a compelling blend of cash flow and appreciation, making it one of the best markets for rental properties in the Sun Belt. Fueled by strong in-migration from northern states and a growing remote workforce, the region boasts consistent tenant demand across its diverse neighborhoods. This market provides a balanced investment opportunity, supported by a robust local economy anchored in finance, healthcare, and tourism.
Market Snapshot & Investor Profile
Investors can expect capitalization rates between 5.5-7% and steady annual rent growth of 4-6%. Vacancy rates typically hold between 5-7%, reflecting the area's desirability. This market is perfect for investors seeking a mix of immediate cash flow and long-term value, with a variety of property types available at more accessible price points than other major Florida cities.
- Property Archetype 1 (Cash Flow Play): A single-family home in a stable Pinellas Park or Clearwater neighborhood, purchased for $320,000 and renting for $2,400/month, yielding a solid cap rate.
- Property Archetype 2 (Appreciation & Value-Add): A slightly dated home in an up-and-coming area like Ybor City or South Tampa, acquired with the potential for cosmetic updates to force appreciation and increase rental income.
How to Win in the Tampa-St. Pete Market
Success here requires careful risk management, particularly concerning environmental factors. Diligently vet properties to avoid high-risk flood zones, as insurance costs can cripple returns. Focus on stable, middle-class neighborhoods like Westshore or Carrollwood that attract long-term tenants over transient tourist areas. It's also critical to budget appropriately for insurance (8-10% of gross rent) and property taxes (2-3%), as these are significant operating expenses in Florida.
How to Evaluate with Property Scout 360: Use the "Flood Zone" and "Insurance Cost" modules to get an accurate estimate of holding costs before making an offer. Filter for properties with "Impact-Resistant Roofing" to identify homes with lower insurance premiums and better resilience against storms.
10. Charlotte, NC - Southeast Balanced Growth
Charlotte, North Carolina, has solidified its reputation as a major southeastern hub, blending robust economic fundamentals with affordable entry points. As a prominent banking and financial services center, it attracts a consistent inflow of professionals from companies like Bank of America and Truist. This creates a stable tenant demand, making it one of the best markets for rental properties for investors seeking a balance of reliable cash flow and steady appreciation.
Market Snapshot & Investor Profile
The numbers in Charlotte present a compelling case for balanced growth. Investors can find capitalization rates between 5.5-7% and average annual rent growth of 3-5%. The consistent demand keeps vacancy rates manageable at 5-7%, offering a more accessible alternative to high-growth tech hubs. This market is ideal for investors who want a blend of cash flow and appreciation without the high acquisition costs of primary markets.
- Property Archetype 1 (Appreciation & Quality Tenant): A single-family home in the sought-after Dilworth or Myers Park area, purchased for around $375,000 and renting for $1,800/month to finance professionals.
- Property Archetype 2 (Cash Flow Play): A property in a South Charlotte suburb like Pineville or Cornelius, offering better cap rates and attracting families with its strong school districts and job access.
How to Win in the Charlotte Market
Success in Charlotte means targeting neighborhoods that align with the city's key employment drivers. Focus on properties with easy commutes to the financial and tech corridors in Uptown and SouthPark. Exploring suburbs on the North Carolina-South Carolina border, such as Rock Hill, can also uncover slightly better yields while still benefiting from the greater Charlotte economy. Always investigate a property's location relative to creek valleys to avoid potential flood-prone zones.
How to Evaluate with Property Scout 360: Use the "Employment Accessibility" score to identify properties with strong connections to Charlotte's major job centers. Layer this with the "School District Rating" filter to pinpoint homes in areas that attract long-term, stable family tenants.
11. Kansas City, MO - Heartland Hidden Opportunity
Kansas City offers a refreshing alternative to high-priced coastal markets, delivering exceptional value and strong cash flow potential. With a diverse economy anchored by healthcare, engineering, and federal government jobs, the city provides tenant stability without the volatility of tech-driven booms. This balance makes it one of the best markets for rental properties for investors who prioritize immediate and consistent cash flow over speculative appreciation.
Market Snapshot & Investor Profile
The numbers in Kansas City are compelling for yield-focused investors: cap rates often reach 7-9%, with vacancy rates holding at 6-8%. With a median home price around $210,000 and moderate annual rent growth of 2-4%, the barrier to entry is low while the potential for monthly income is high. This market is ideal for value-focused investors seeking maximum yield with minimal capital requirements and those looking to build a multi-property portfolio.
- Property Archetype 1 (High Yield Play): A turnkey duplex near the Midtown/Plaza area, acquired for $250,000 and generating a combined $2,200/month in rent for a 7.5%+ cap rate.
- Property Archetype 2 (Portfolio Builder): A portfolio of three single-family homes in working-class neighborhoods, producing a combined $1,500+ in monthly cash flow.
How to Win in the Kansas City Market
Success here means focusing on revitalization corridors like Midtown, the Crossroads Arts District, and the River Market to capture both cash flow and potential appreciation. Target properties within a few miles of the downtown core for better liquidity and tenant demand. Due to the age of the housing stock, budget carefully for capital expenditures, especially winter-related maintenance like heating systems and roof integrity.
How to Evaluate with Property Scout 360: Use the "Cash Flow Potential" filter to identify zip codes with the highest rent-to-price ratios. Overlay the "Neighborhood Stability" score to pinpoint areas with improving crime rates and stable employment, ensuring you are investing in a location with long-term viability.
12. Omaha, NE - Buffett Country Value Anchor
Home to Warren Buffett's Berkshire Hathaway, Omaha embodies the principles of value investing in real estate. The market offers a stable, cash-flow-centric environment built on a diverse economy of finance, insurance, and transportation. Unlike high-growth tech hubs, Omaha provides a predictable, low-volatility landscape, making it one of the best markets for rental properties for investors prioritizing consistent returns and long-term wealth accumulation.
Market Snapshot & Investor Profile
Omaha is a cash flow powerhouse. Investors can find capitalization rates between 7.5-9% and steady annual rent growth of 2-3%. The affordability, with median home prices near $200,000, keeps entry costs low and maximizes yield. Vacancy rates hover around 6-8%. This market is perfectly suited for serious value investors and buy-and-hold portfolio builders who want to acquire multiple cash-flowing assets without massive capital outlays.
- Property Archetype 1 (Stable Cash Flow): A single-family home in the desirable Dundee neighborhood, generating an 8-9% cap rate with rents between $1,050-$1,250/month.
- Property Archetype 2 (Value-Add & Appreciation): A small multi-family property in the revitalizing Benson area, offering a 9%+ cap rate with strong potential for future appreciation as the neighborhood develops.
How to Win in the Omaha Market
Success in Omaha hinges on diligent underwriting and a focus on neighborhood quality. Target stable, established areas like Dundee or up-and-coming zones like Benson for a blend of reliability and growth. Given the older housing stock and harsh winters, it is critical to budget 8-12% of gross rents for maintenance and capital expenditures. Focusing on properties within strong school districts can also secure a wider tenant pool and bolster future resale value.
How to Evaluate with Property Scout 360: Utilize the platform’s "Expense Modeling" tool to accurately forecast winterization, utility, and repair costs specific to the Midwest climate. Filter for properties with a "Cash Flow Score" of 8 or higher in the Dundee and Benson zip codes to quickly identify top-performing assets.
Top 12 Rental Markets Comparison
| Market | Implementation complexity 🔄 | Resource requirements ⚡ | Expected outcomes ⭐ / 📊 | Ideal use cases 💡 | Key advantages |
|---|---|---|---|---|---|
| Austin, TX - High Growth Tech Hub | Medium-High — competitive acquisitions, oversupply risk | High capital; active management; strong property mgmt needed | ⭐ High appreciation + steady rent growth; 📊 Rent growth 6–8%; cap 5–6.5% | Long-term appreciation, tech-worker rentals | Rapid population & job growth; diversified tech demand |
| Indianapolis, IN - Stable Midwest Value Play | Low — plentiful deals, lower competition | Low capital per asset; moderate maintenance; local mgmt advisable | ⭐ Strong cash flow; 📊 Cap 7–8.5%; rent growth 2–3%; CoC 9–12% | Buy-and-hold, portfolio scaling, cash-flow focus | High cap rates; affordable entry; stable tenant base |
| Phoenix, AZ - Sunbelt Growth Corridor | Medium — development variance, climate/water considerations | Medium capital; HVAC/HOA costs; insurance considerations | ⭐ Balanced appreciation + cash flow; 📊 Rent growth 4–5%; cap 5.5–7% | Dual-focused investors (growth + cash flow) | Rapid population growth; favorable landlord laws |
| Nashville, TN - Rising Star Entertainment Market | Medium-High — fast price growth and gentrification risk | Medium-high capital; active sourcing; possible short-term rental ops | ⭐ Strong rent growth; 📊 Rent growth 5–7%; cap 5–6.5% | Appreciation plays, short-term rental or young-professional housing | Entertainment-driven demand; young demographic |
| Memphis, TN - Deep Value Dividend Market | Low — many low-price opportunities but operational risk | Low capital; high reserves; robust property mgmt required | ⭐ Maximum cash flow; 📊 Cap 8–10%; rent growth 2–3%; CoC 12–15% | Aggressive cash-flow portfolios, rapid scaling | Highest cap rates; very affordable entry |
| Denver, CO - Rocky Mountain Growth Market | Medium — competitive sourcing, seasonal maintenance | Medium capital; weather-related maintenance (hail, roofs) | ⭐ Balanced returns; 📊 Rent growth 4–6%; cap 5–6.5% | Growth + lifestyle rentals, mixed strategies | Strong job market; lifestyle appeal reduces churn |
| Louisville, KY - Underrated Midwest Gem | Low-Medium — simpler market with select neighborhood risk | Low capital; moderate reserves; winter maintenance | ⭐ Good cash flow; 📊 Cap 7–8.5%; rent growth 2–3%; CoC 9–11% | Value/cash-flow investors, healthcare-worker rentals | Affordable prices; high cap rates; less investor competition |
| Raleigh-Durham, NC - Triangle Tech Growth | Medium — rising valuations, tech-tilt sourcing needed | Medium capital; proximity to employers boosts demand | ⭐ Growth with steady cash flow; 📊 Rent growth 4–5%; cap 5.5–7% | Tech-exposure investments, university-area rentals | Educated tenant base; diversified tech/biotech/jobs |
| Tampa-St. Petersburg, FL - Sun State Value | Medium — hurricane/flood risk adds complexity | Medium capital; higher insurance and storm-proofing costs | ⭐ Balanced growth + cash flow; 📊 Rent growth 4–6%; cap 5.5–7% | Migration-driven rentals, suburban value plays | Strong in-migration; no state income tax |
| Charlotte, NC - Southeast Balanced Growth | Medium — steady demand but growing competition | Medium capital; employer-proximate properties preferred | ⭐ Balanced returns; 📊 Rent growth 3–5%; cap 5.5–7% | Balanced appreciation/cash-flow portfolios | Strong finance sector; diverse economy |
| Kansas City, MO - Heartland Hidden Opportunity | Low-Medium — good deal flow, neighborhood variance | Low capital; winter maintenance; targeted mgmt | ⭐ High cash flow; 📊 Cap 7–9%; rent growth 2–4%; CoC 10–12% | Value investors, revitalization corridors, portfolio builders | Affordable; landlord-friendly; strong cap rates |
| Omaha, NE - Buffett Country Value Anchor | Low-Medium — stable market, low competition | Low capital; winterization costs; pro mgmt recommended | ⭐ High cash flow; 📊 Cap 7.5–9%; rent growth 2–3%; CoC 10–13% | Conservative buy-and-hold, long-term value investing | Stable employers (Berkshire); landlord-friendly environment |
From Data to Deal: Making Your Next Move
Navigating the landscape of real estate investing can feel overwhelming. We've journeyed through twelve of the best markets for rental properties in the nation, from the explosive tech-fueled growth of Austin and Raleigh-Durham to the steady, cash-flow-centric appeal of Midwest strongholds like Indianapolis and Omaha. Each city presents a unique mosaic of opportunity, risk, and reward, underscoring a fundamental truth: the "best" market is not a universal answer, but a personal one.
Your ideal market is where your investment philosophy, capital limitations, and risk tolerance intersect with favorable economic tailwinds. The aggressive appreciation sought by a growth investor in Phoenix is fundamentally different from the predictable, dividend-like returns a cash flow investor might find in Memphis. This list isn't a declaration of winners; it's a curated map of distinct investment pathways.
Synthesizing the Data: Key Investor Takeaways
As you reflect on these diverse markets, several core themes emerge that are critical for success in any location. Mastering these concepts will separate you from the average investor and put you on the path to building a resilient, profitable portfolio.
Strategy-Market Alignment is Paramount: Never force a market to fit your strategy. If you are a BRRRR investor needing deep value-add opportunities, a high-cost, low-inventory market like Denver might be a frustrating and capital-intensive choice. Conversely, if high appreciation is your primary goal, a stable, slow-growth market like Louisville might not meet your objectives. Always start with your "why" and then find the "where."
Macro Trends Meet Micro Analysis: A city’s booming job growth is a fantastic starting point, but it means little if you overpay for a property in a declining neighborhood. The real magic happens when you use macro indicators (like population growth and employment data) to identify a promising area, then drill down with micro-level analysis (like neighborhood-specific cap rates, school ratings, and crime statistics). This is where tools become an investor's best friend.
Cash Flow Remains King: Appreciation is exciting, but cash flow pays the bills. Even in high-growth markets, underwriting a deal to ensure it at least breaks even, or produces positive cash flow from day one, provides a critical safety net. A market downturn can wipe out paper gains, but positive cash flow provides the holding power to ride out volatility. Meticulously accounting for all expenses, from vacancy to maintenance, is non-negotiable.
Your Actionable Path Forward
Information without action is merely entertainment. The goal of this guide is to empower you to move forward with clarity and confidence. Your next steps are not to analyze all twelve markets, but to narrow your focus and begin the real work of due diligence.
Select Your Top Two: Re-read the profiles and choose the two markets that most closely align with your financial goals and personal risk profile. Does the balanced growth of Charlotte appeal to you, or does the hidden potential of Kansas City spark your interest?
Deep-Dive with Purpose: For your chosen markets, begin a deeper investigation. Start following local real estate news, connect with investor-friendly agents in those cities, and join local real estate investor groups on social media. Listen to what locals are saying about neighborhood trends.
Model, Model, Model: This is the most crucial step. Take the example property archetypes we provided and find real, on-market listings that match. Run the numbers rigorously. Project your cash-on-cash return, net operating income, and long-term ROI. Stress-test your assumptions: what happens if vacancy is 2% higher than expected or a major repair hits in year one? Beyond the purchase, remember that operational efficiency is key to profitability. Mastering expense management, including finding ways to minimize utility costs, directly impacts your bottom line. For an in-depth look at this, see this a practical guide to lowering utility bills.
Ultimately, building a successful rental portfolio is a marathon, not a sprint. It’s built property by property, deal by deal, on a foundation of disciplined analysis and decisive action. The data presented here is your launchpad. By combining these market insights with powerful analytical tools and a commitment to continuous learning, you can transform market potential into tangible wealth and financial freedom.
Ready to move from market theory to deal reality? Property Scout 360 is the all-in-one platform designed to help you analyze any property in any market with institutional-grade precision. Stop guessing and start making data-driven decisions by visiting Property Scout 360 to model your next deal today.
About the Author
Related Articles
2026 Investor's Guide: Cost of Installing a Sewer Clean Out
Understand the cost of installing a sewer clean out for investment properties in 2026. Get expert advice on prices, ROI, & budgeting for flips. Plan smart!
15 Year vs 30 Year Mortgage: The Investor's Choice
Deciding between a 15 year vs 30 year mortgage for a rental property? Our guide analyzes cash flow, ROI, and equity to help you pick the best loan.
Real Estate Appraisal Software: Features & Limits
Discover what real estate appraisal software is, its core features, and limits. See how it differs from investment tools for profitable deals.