What Is Cap Rate In Real Estate And How To Use It
Learn what is cap rate in real estate and how to calculate it, interpret varied ranges, and apply cap rate analysis for smarter property investment decisions.
Quick Answer To Cap Rate In Real Estate
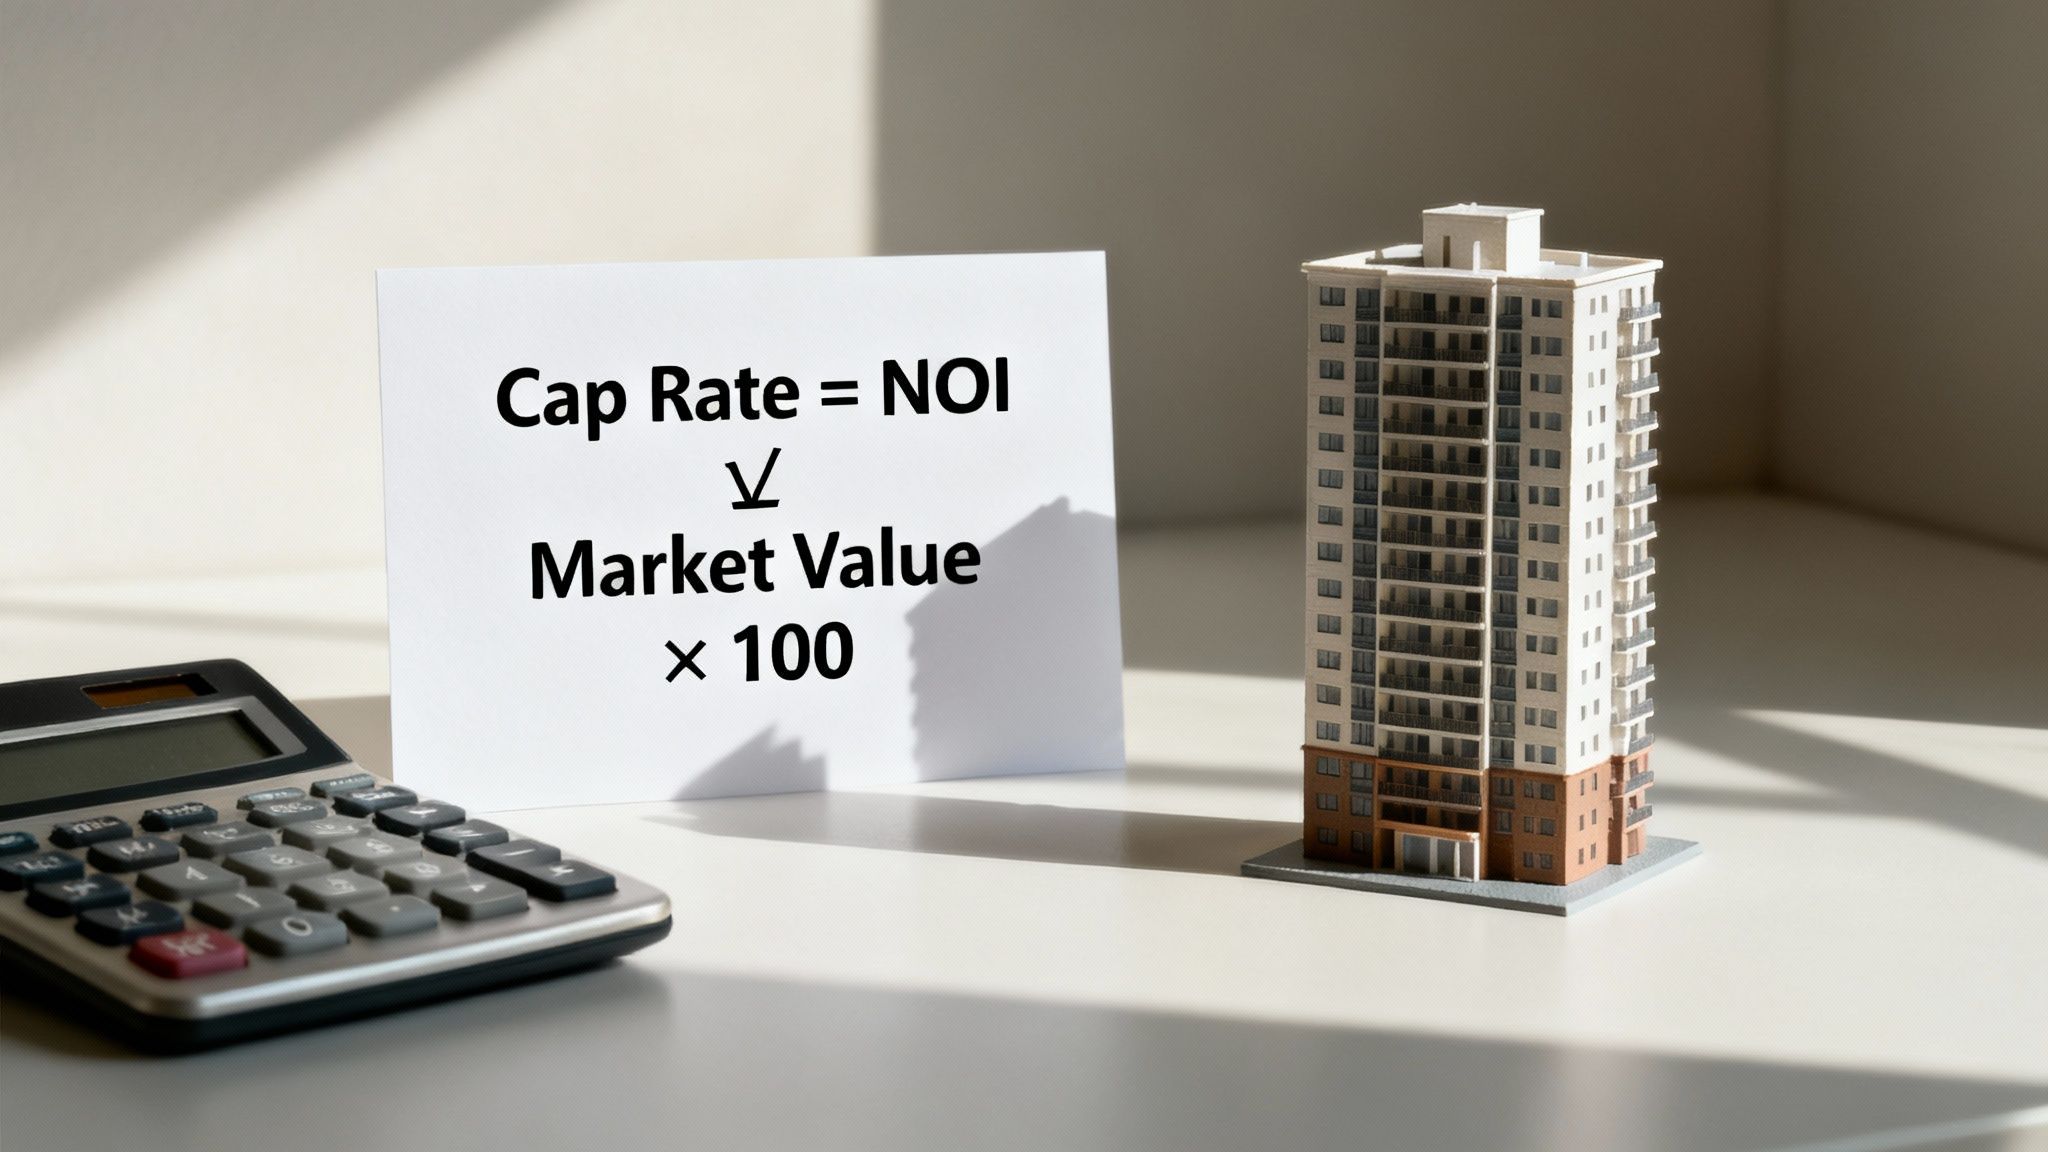
When you want a snapshot of a property’s earning power, cap rate is your go-to metric. It pits the annual Net Operating Income (NOI) against the property’s value, then multiplies by 100 to give you a percentage return.
Think of cap rate as the pure, cash-only return. No financing noise—just property income versus price. A higher rate usually hints at more risk or an undervalued deal, while a lower figure suggests stability or a premium neighborhood.
- Annual Return Measure: NOI ÷ Market Value × 100
- Operations Focused: Ignores debt costs to highlight true income
- Fast Screening Tool: Compare apartments, offices, retail quickly
- Benchmark Ranges: Apartments ~4%–6%, Offices ~5%–7%, Retail ~6%–9%
For instance, an $80,000 NOI on a $1,000,000 asset delivers an 8% cap rate—simple and direct.
Cap Rate Summary Table
Below is a concise overview of each component and the typical cap rate bands by asset type.
| Component | Description | Typical Range |
|---|---|---|
| NOI | Net Operating Income | Varies by asset |
| Market Value | Purchase Price or Appraised Value | Market-dependent |
| Cap Rate | (NOI ÷ Market Value) × 100 | 3%–10% |
This table lays the groundwork for deeper examples and benchmarks in the sections ahead. Use these figures to quickly spot value buys or lock in stable cash flows.
Understanding Key Cap Rate Concepts
Cap rate might sound technical, but at its heart, it bridges a property’s income and its market value. When investors ask “What is cap rate in real estate?”, they’re zeroing in on the pure, debt-free return a property generates. Think of it as a performance score for any income-producing asset.
Key Cap Rate Components
Every cap rate calculation begins with Gross Rental Income—the sum of tenant payments over a year. From there, subtract Operating Expenses (utilities, repairs, taxes) to arrive at Net Operating Income (NOI).
- Gross Income – Total tenant payments before costs
- Operating Expenses – Utilities, maintenance, property taxes
- Market Value – The price you’d pay to acquire the asset today
Two often-overlooked items:
- Vacancy Loss: Assume a 5%–10% vacancy rate to avoid overstating revenue.
- Reserves: Set aside cash for occasional repairs or capital replacements.
Once you have NOI, divide it by the property’s Market Value, then multiply by 100 to express it as a percentage.
Key Insight
Cap rate ignores financing to highlight pure operational performance.
That apples-to-apples view lets you compare a high-rise condo to a strip mall without worrying about different loan terms.

Imagine a neighborhood coffee shop bringing in $5,000 per month. If annual expenses total $12,000, your NOI is $48,000. Sell the shop for $800,000, and the cap rate calculates to 6%.
Why Debt Free Metrics Matter
Cap rate deliberately sets aside mortgages and loan fees so you can benchmark properties purely on their income. Comparing a Chicago apartment to a Miami retail building becomes straightforward—no hidden debt dynamics to cloud the picture.
Applying Cap Rate With Tools
With Property Scout 360, you can:
- Input rents, vacancy rates, and expense items in minutes
- Adjust market value estimates on the fly
- Generate instant charts showing how small tweaks affect cap rate
- Compare results across different markets and asset classes
This hands-on approach solidifies your understanding of what cap rate truly represents in real estate.
For a deeper theoretical dive, check out PNC’s Cap Rate Guide.
Check out our guide on free real estate comps to see how comps influence your cap rate analysis.
Armed with these insights—and the right tools—you’ll swiftly filter deals by target return, map comps and expenses, and uncover underpriced opportunities with confidence.
Historical Perspective On Cap Rate
Picture an investor in the 1920s sizing up a downtown storefront and treating its land rent much like a bond coupon. That simple exercise—capitalizing rent into a yield—laid the foundation for what we now call the cap rate. Over the years, this ratio has become the industry’s go-to gauge for a property’s income potential.
After World War II, suburban shopping centers blossomed and buyers demanded 10%–12% yields to offset development risks. Those early benchmarks for risk and reward still influence how we think about cap rates today.
Cap Rate Cycles Through Decades
As the economy sways, cap rates swing right along with it. During the 1980s savings and loan crisis, yields rocketed above 15%, and many deals collapsed under tight financing.
- Suburban shopping centers compressed to 8%–9% in the late 1990s.
- Prime-market office towers settled around 7% in the 2000s.
- Multifamily buildings hovered near 6% before the Great Recession.
Ultra-low interest rates after 2008 drove cap rates to record lows by 2021. Cheap debt and strong rental demand squeezed yields across every asset class, reminding investors to recalibrate old benchmarks for today’s market.
Key Insight
Historical cap rate compression mirrors shifts in economic policy and credit availability.
One vivid example comes from the early 2000s housing boom. A multifamily property generating $80,000 in first-year NOI sold for $1,000,000, locking in an 8% cap rate. That single deal rippled through billions of dollars in investment decisions. Discover more insights about cap rates in the 2000s housing boom on Origin Investments.
Lessons For Today's Investors
History shows cap rates rarely stay put. To use that knowledge:
- Compare current cap rates against past cycles to unearth hidden value.
- Avoid leaning on outdated benchmarks when interest rates shift.
- Utilize tools like Property Scout 360 to tweak NOI and valuation inputs.
When cap rates climb, prices generally dip—creating buying windows. Conversely, ultra-low yields often point to crowded or overleveraged markets. Armed with these lessons, you can spot opportunities whenever cap rates stray from the norm.
- Review historical cap rates in your target markets to gauge relative valuations.
- Factor in macroeconomic cycles when modeling future NOI and exit cap rates.
Property Scout 360’s filters help you align cap rate analysis with the right market cycle.
Interpreting Cap Rates And Common Pitfalls
Think of the cap rate as your risk compass. It strips away financing noise and reveals what truly drives your returns.
When you see a 3% cap rate, imagine a blue-chip bond—steady, reliable, but modest. An 8% cap rate, by contrast, feels like a high-yield bond—eye-catching returns coupled with extra risk.
Of course, numbers on their own can be misleading if you don’t dig into the assumptions.
Key Pitfalls
- Vacancy Assumptions: Overly optimistic occupancy will inflate your NOI.
- Inflated Income Projections: Banking on steep rent hikes might leave you chasing shadows.
- Misreading Comparable Sales: The wrong comps will distort market value.
“A cap rate is only as good as the inputs behind it.”
Common Mistakes To Avoid
Often, investors gloss over vacancy and lock themselves into unrealistic numbers. Aim for a 5%–10% vacancy buffer and run stress tests to see how minor shifts affect returns.
Relying on best-case rent projections is like hoping for a windfall. Instead, ground your forecasts in current market data.
And never grab comps from a different neighborhood or asset class. Always use recent sales in the same property segment to keep your bids honest.
How To Use Property Scout 360
With Property Scout 360 you can model different vacancy and income scenarios in seconds. Adjust any variable and watch your cap rate update in real time.
Use these tools to:
- Filter Comparable Sales to ensure accurate benchmarks
- Test Worst-Case Vacancy inputs and see immediate cap rate shifts
- Lock In Reliable NOI Estimates with dynamic expense modeling
| Cap Rate | Analogy | What It Means |
|---|---|---|
| 3% | Blue-Chip Bond | Low risk, modest returns |
| 8% | Junk Bond | Higher income, more volatility |
Balancing yield against risk is what smart deal screening is all about. Cap rates move with interest rates, supply and demand, and economic cycles—so revisit your analysis often.
“Expert investors view cap rate as a conversation starter, not the final verdict.”
Keep your data fresh, compare against local benchmarks, and let cap-rate insights guide you toward deals that match your risk tolerance.
Comparing Cap Rates With Other Metrics
When you’re sorting through a stack of investment options, cap rate is your quickest yardstick. It lets you compare pure operating returns without worrying about loans or financing.
Of course, it only tells part of the story. To fill in the blanks, you’ll need cash-on-cash return and IRR.
- Cap Rate ranks properties by yield alone, ignoring debt.
- Cash-on-Cash Return factors in mortgage payments and down payment.
- IRR models future cash flows, including sale proceeds and appreciation.
When Cap Rate Works
Think of cap rate as your first-pass filter. It treats every property like a standalone business, pitting NOI against purchase price in one clean stroke.
“Cap rate is your speedometer for deal hunting.”
Scanning 50 listings for a 5%+ yield? That takes minutes when you stick to cap rate.
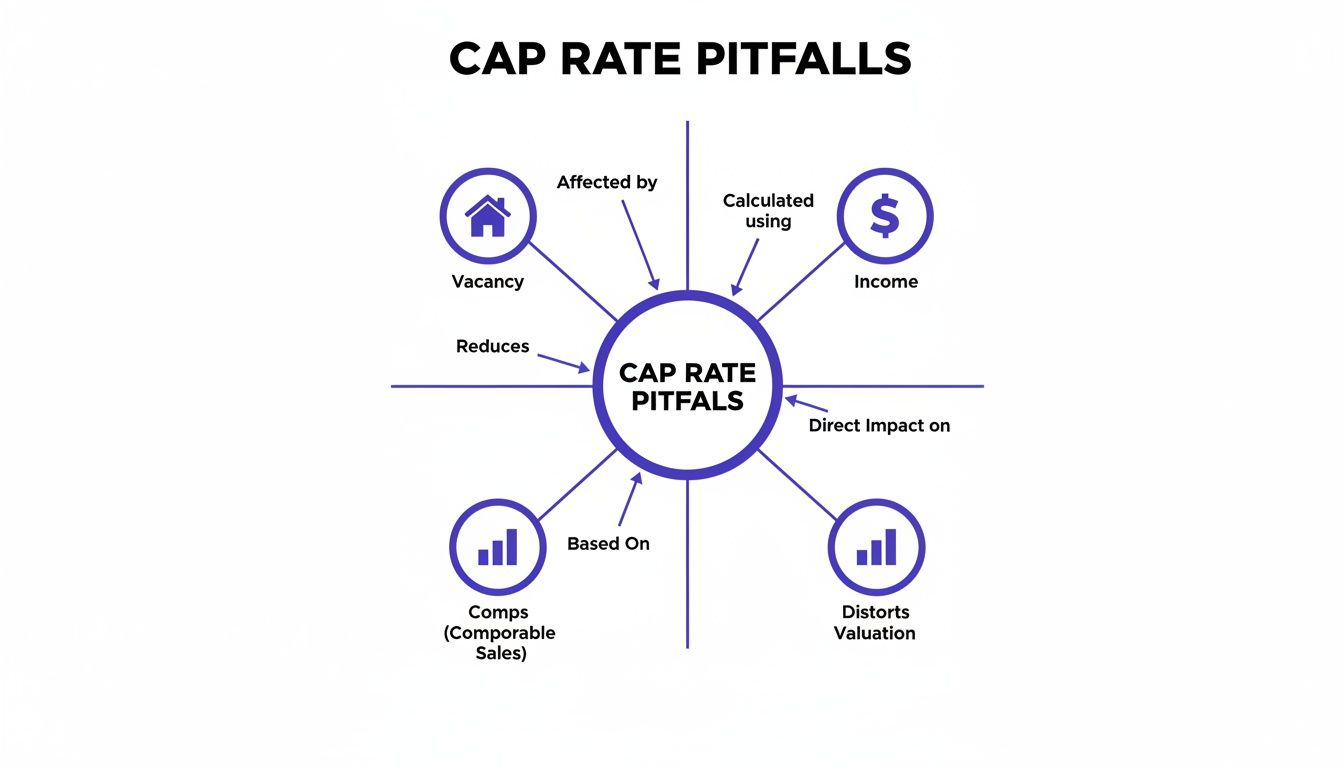
This infographic zeroes in on the pitfalls—vacancy assumptions, income accuracy, comp selection—that can skew your cap rate.
When Other Metrics Matter
Once you layer in financing, cash-on-cash return becomes crucial. It reveals your real net yield after mortgage expenses and equity outlay. When you want to project growth over time, IRR steps in, accounting for both cash flow and exit proceeds.
Follow these steps:
- Estimate your mortgage details and down payment.
- Calculate annual cash flow, then divide by your initial equity.
- Forecast sale price, cash flows, and choose a discount rate to nail your IRR.
For a walkthrough of these calculations, check out our guide on the real estate investment calculator.
In short, start with cap rate to narrow the field, layer on cash-on-cash to gauge financing, and finish with IRR for the full picture. Each metric has its moment—use them in sequence to uncover the best deals.
Practical Cap Rate Calculation Examples

Bringing real numbers into play makes cap rate tangible. We’ll walk through two scenarios: a single-family property and a small rental building.
Single Family Rental Example
Imagine a house renting at $1,800 per month, which adds up to $21,600 in annual gross income. After subtracting $5,600 in operating costs, your NOI sits at $16,000. With a market value of $200,000, that property yields an 8% cap rate.
- Gross income: $1,800 × 12 = $21,600
- Operating expenses: $5,600
- Cap rate calculation: 16,000 ÷ 200,000 × 100 = 8%
Three-Unit Multi-Family Example
Scaling up shows how vacancy and expenses change the picture. If each unit nets $1,200 per month, total annual rent reaches $43,200. Deduct $14,000 for insurance, taxes, and maintenance, and the NOI becomes $29,200, giving you about 5.3% on a $550,000 purchase.
- Annual gross rent: $1,200 × 3 units × 12 months
- Operating expenses: $14,000
- Cap rate calculation: 29,200 ÷ 550,000 × 100 ≈ 5.3%
Key Insight
Small swings in vacancy or costs can move your cap rate by hundreds of basis points.
Cap Rate Calculation Examples
Below is a quick comparison of a single-family rental versus a three-unit building.
| Property Type | NOI | Market Value | Cap Rate |
|---|---|---|---|
| Single Family | $16,000 | $200,000 | 8% |
| Three-Unit Building | $29,200 | $550,000 | 5.3% |
This table highlights how property scale and expense items influence overall returns.
Example Summary
- Single-family returns 8% with minimal cost layers.
- Three-unit shows 5.3%, reflecting higher vacancies and reserves.
- Sensitivity checks reveal both risks and potential upside.
- Cap rate screening helps you compare deals on an apples-to-apples basis.
Price Sensitivity Check
Even small shifts in purchase price can adjust cap rates significantly.
- Original cap rate: 8.00%
- Price drop of $6,000 brings the purchase price to $194,000
- New cap rate: 16,000 ÷ 194,000 × 100 ≈ 8.25%
Expense And Vacancy Assumptions
Realistic forecasts are key to credible cap rates.
- Vacancy buffer: 5% of gross rent
- Repair reserve: 10% of gross income
- Insurance and taxes: roughly 20% of gross rent
Next Steps With Property Scout 360
Log into Property Scout 360 to model these scenarios in minutes.
- Adjust vacancy, expense, and price inputs to watch cap rates update live
- Compare markets side by side
- Generate PDF summaries for your team
- Save templates for future deal screening
- For detailed step-by-step instructions, see our guide on how to calculate cap rate
Cap rates strip out financing to focus purely on operational returns. A $10 million asset producing $500,000 NOI yields a 5% cap rate, typical in stabilized U.S. office sectors after 2020.
FAQ
Here, we answer your top questions about cap rate in real estate with straightforward, practical insights. No fluff—just the facts you need.
Common Distortions
What Factors Can Distort Cap Rate Accuracy
It gets thrown off by overly optimistic vacancy assumptions, one-off costs or sudden income spikes, and stale market values. To keep it honest, rely on normalized income and fresh comps.
Recalculate Frequency
How Often Should I Recalculate Cap Rates
Cap rates shift whenever your rent rolls, expense lines or market valuations change. As a rule of thumb, run the numbers at least once a quarter—or anytime you see a big market swing.
- Refresh your rent and expense data
- Factor in the latest market comps
- Keep the figures tied to real revenue and costs
Quick Insight
A cap rate is a moment in time—not a crystal ball for future cash flow.
Long-Term Perspective
Can Cap Rate Predict Long-Term Returns
A cap rate will tell you today’s yield, but it won’t capture tomorrow’s price appreciation or financing structure. For a multi-year view, layer in your IRR calculations.
Risk Signals
Is A Higher Cap Rate Always Better
Not necessarily. A soaring cap rate can signal risk—think aging buildings or soft markets. Always weigh the number against the asset’s condition and neighborhood strength.
Keep your cap rate insights fresh by updating inputs and benchmarking against local deals.
Ready to speed up your cap rate analysis? Try Property Scout 360 today.
About the Author
Related Articles
2026 Investor's Guide: Cost of Installing a Sewer Clean Out
Understand the cost of installing a sewer clean out for investment properties in 2026. Get expert advice on prices, ROI, & budgeting for flips. Plan smart!
15 Year vs 30 Year Mortgage: The Investor's Choice
Deciding between a 15 year vs 30 year mortgage for a rental property? Our guide analyzes cash flow, ROI, and equity to help you pick the best loan.
Real Estate Appraisal Software: Features & Limits
Discover what real estate appraisal software is, its core features, and limits. See how it differs from investment tools for profitable deals.