Calculating Cap Rate on Rental Property a Practical Guide
Learn how calculating cap rate on rental property can sharpen your deal analysis. A practical guide to NOI, formulas, and real-world property evaluation.
If you're serious about real estate investing, the cap rate is the first number you need to master. Think of it as your initial gut check on a deal—a quick way to gauge a rental property's potential return before you dive deep into the weeds. It’s essentially the unlevered rate of return, which lets you compare different investment opportunities on a level playing field.
What Is Cap Rate and Why It Matters for Investors
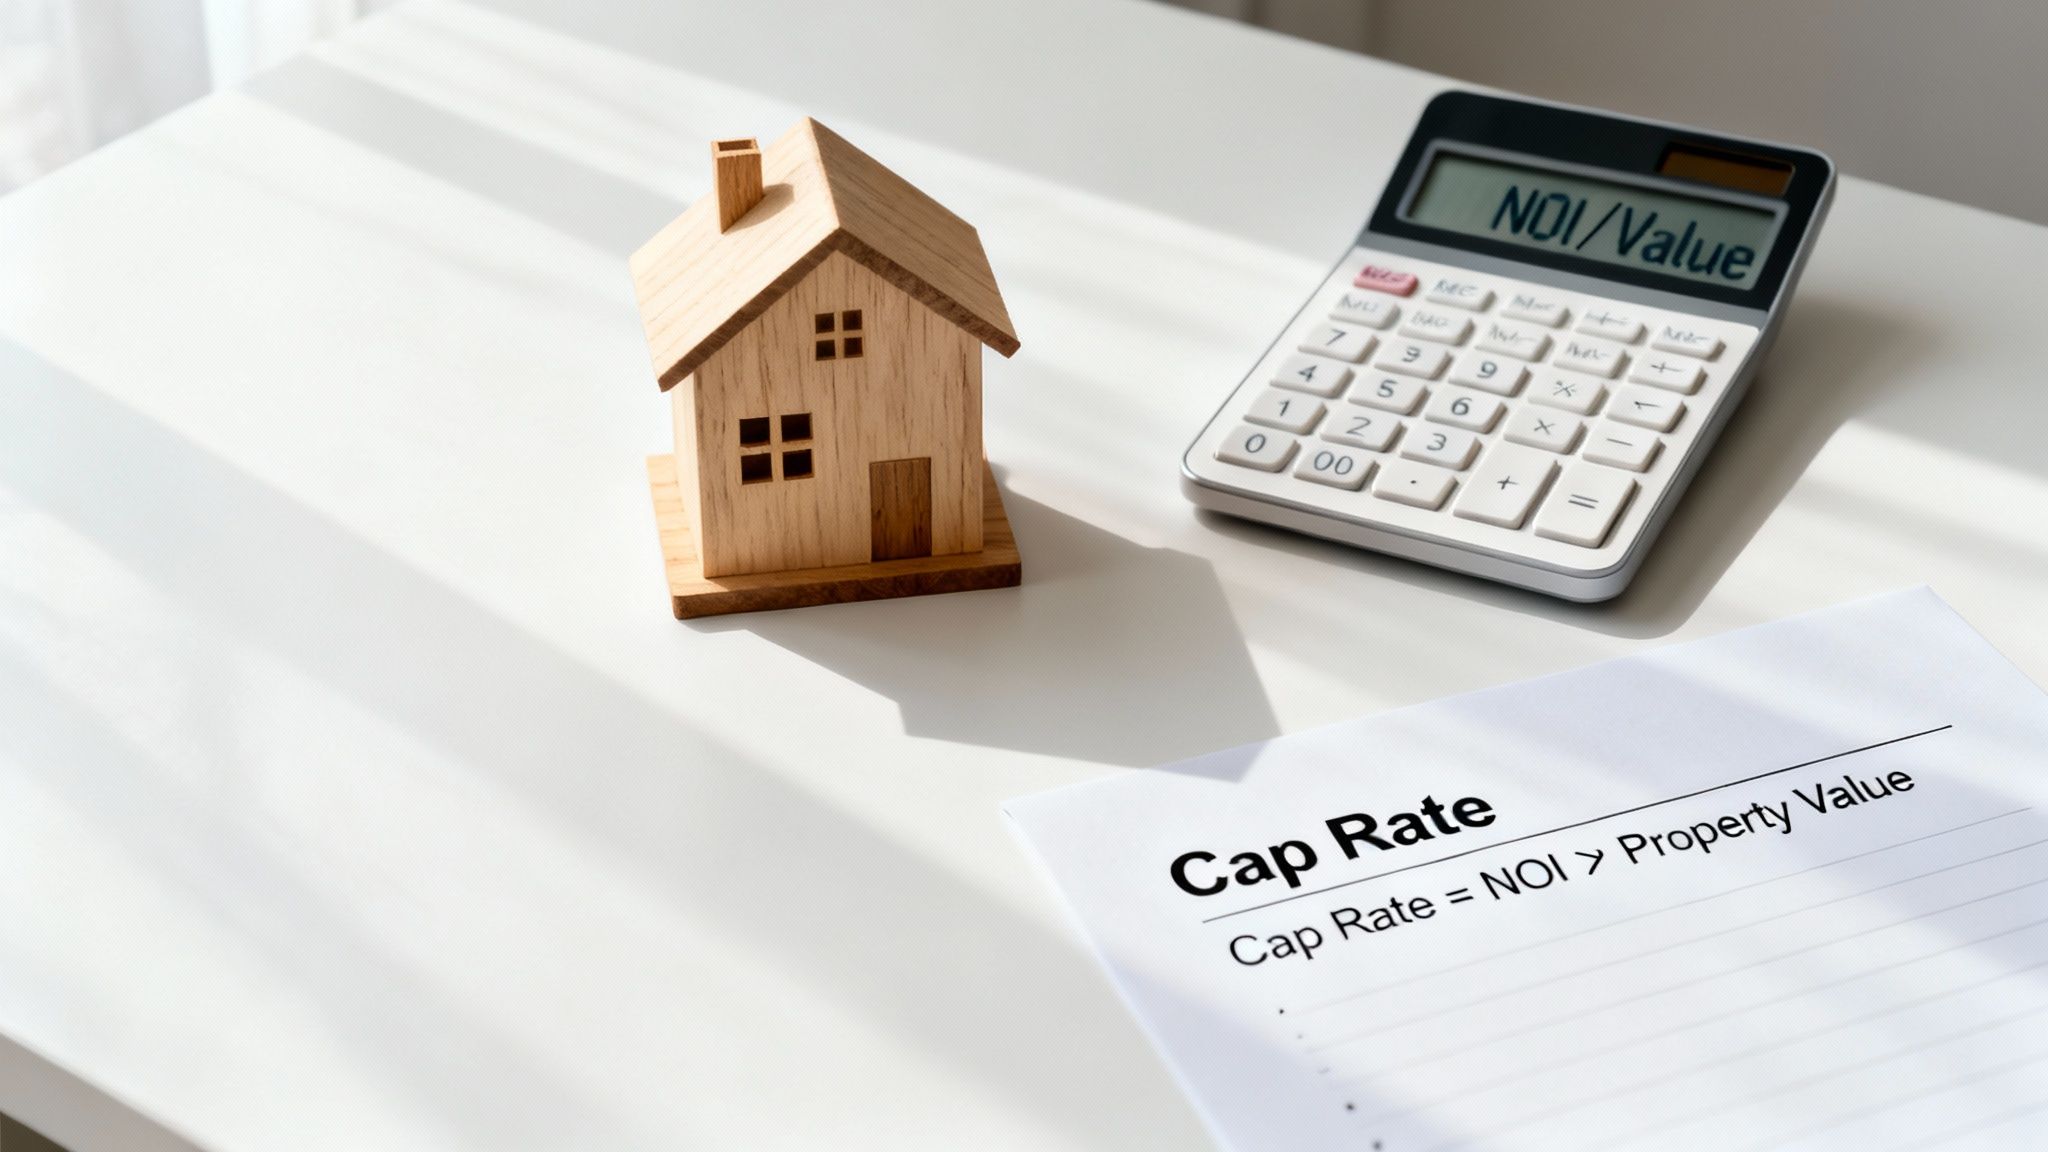
I like to think of the capitalization rate—or "cap rate"—as a property's financial pulse. It gives you a clean snapshot of profitability because it strips away financing details like your mortgage. This is key. It's all about measuring the property's raw, intrinsic earning power.
The formula itself couldn't be simpler: Net Operating Income (NOI) / Property Value. Because it ignores financing, you can evaluate a property based purely on how it operates as a business. This allows for a true apples-to-apples comparison between potential deals, regardless of whether you’re paying all cash or getting a loan.
A Tool for Quick Deal Screening
When you’re sifting through dozens of listings, you need a quick way to separate the contenders from the junk. The cap rate is that tool. When another investor asks, "What's the cap rate?", they're trying to figure out a property's income potential relative to its price in just a few seconds.
Let's say you're looking at two similar properties. Property A has a 7% cap rate, while Property B next door is at 5%. Right away, you know Property A is generating more income for every dollar of its purchase price. That doesn't automatically make it the better buy—a higher cap rate can sometimes signal higher risk—but it absolutely tells you which property deserves a closer look first.
Understanding Market Dynamics
Cap rates do more than just evaluate a single property; they act as a barometer for the entire market. They have an inverse relationship with property values. When prices in an area are climbing, cap rates tend to get squeezed lower (compress). When values fall, cap rates typically expand.
By tracking local cap rate trends, you get a real feel for market sentiment. Are investors paying high prices and accepting lower returns because they're banking on appreciation? Or are they demanding higher returns to offset a perceived risk?
This context is everything. A property with a 4-6% cap rate might be a fantastic deal in a stable, high-demand city center. But in a smaller market that requires more hands-on work, you might be looking for something 8% or higher. It all comes down to the market you're in.
Getting Your Financials in Order for an Accurate Calculation
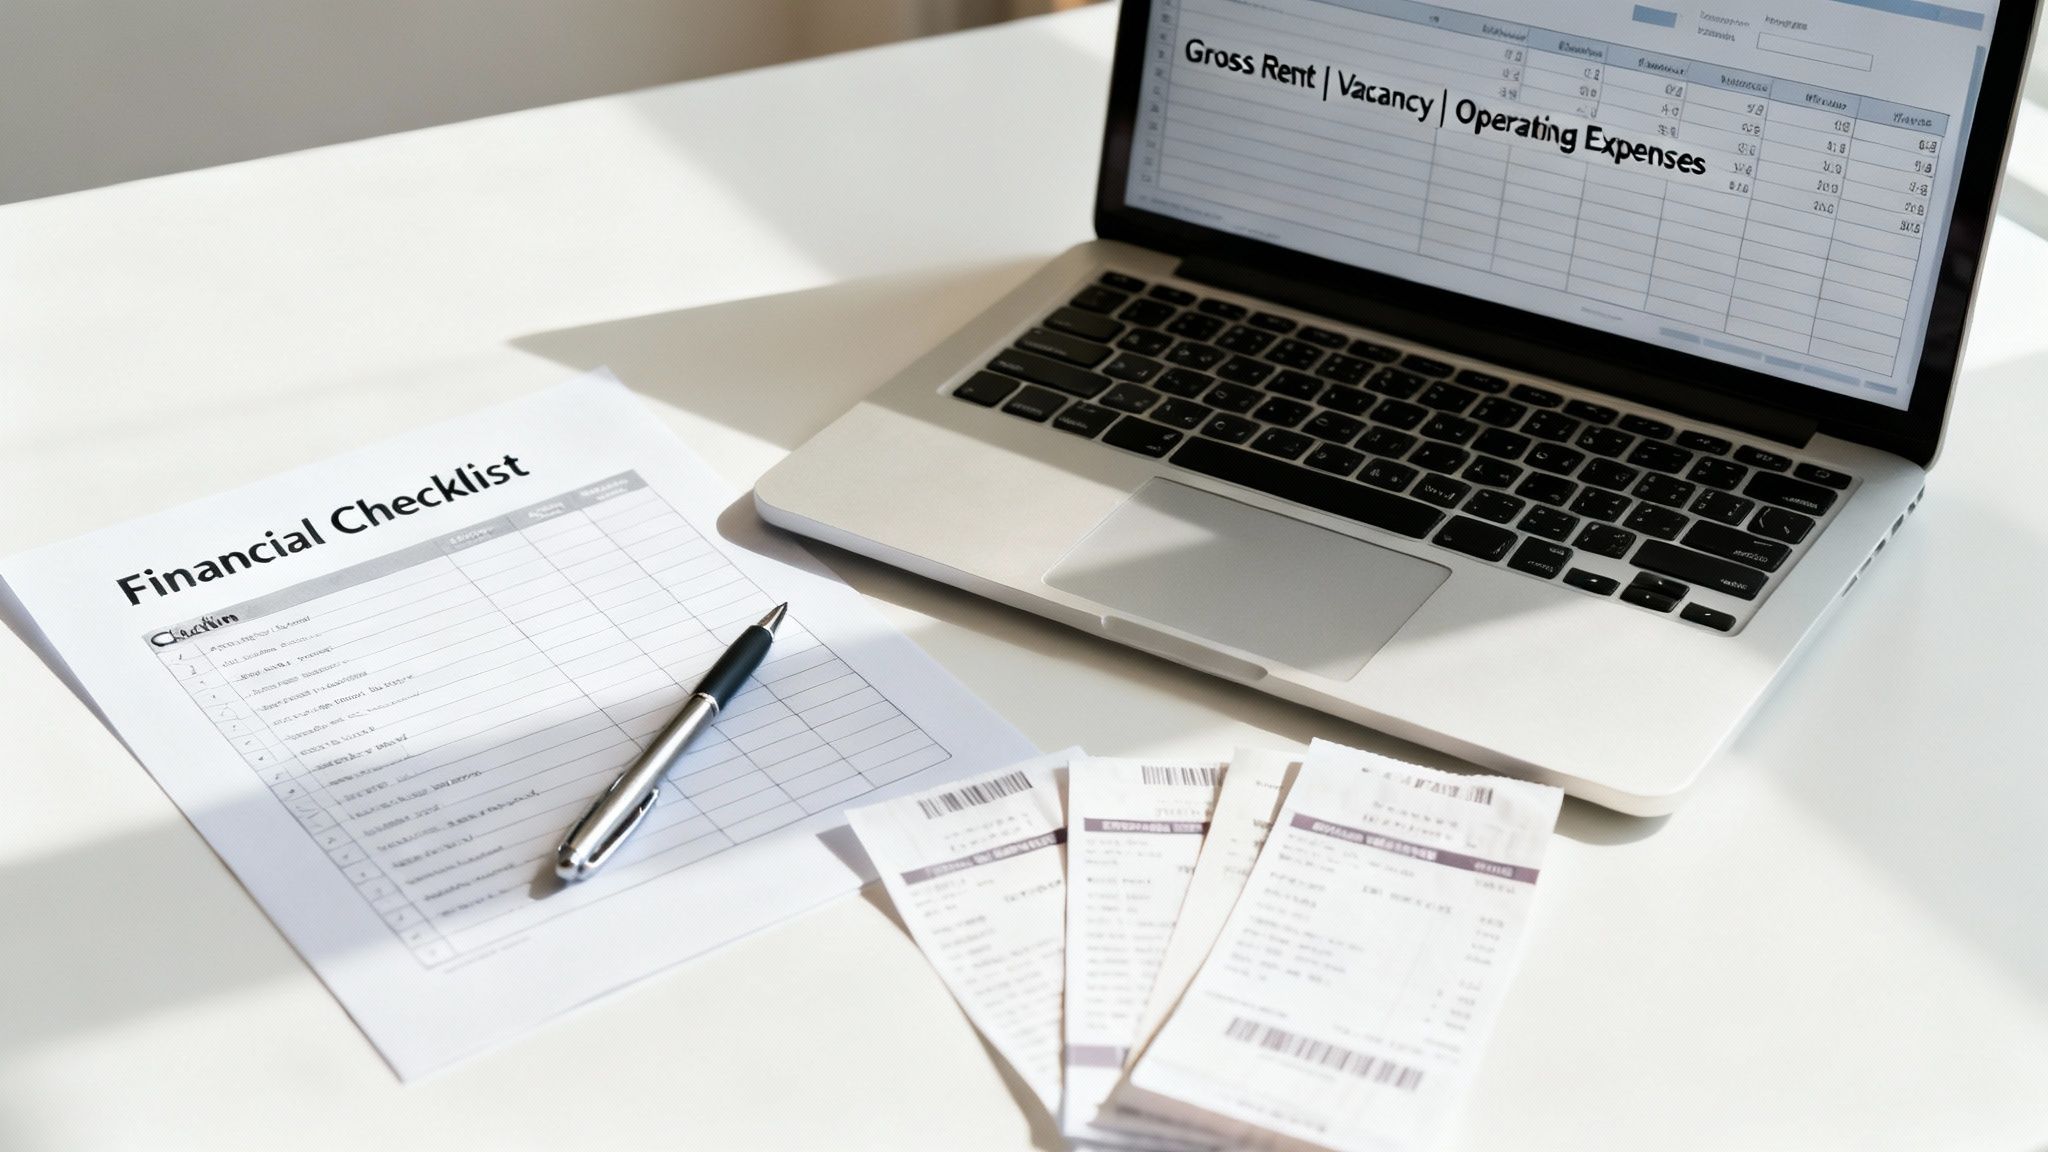
Here’s a hard truth: your cap rate calculation is only as good as the numbers you plug into it. A seller’s proforma is a nice starting point, but let’s be honest—it’s a sales document. It's often designed to look as rosy as possible. To get a real sense of a property's performance, you have to do your own homework and build a financial picture based on facts, not just projections.
First, let's look at the income side of the equation. Gross rent is the big piece of the puzzle, but don't stop there. You might be surprised by the other revenue streams hiding in plain sight.
Verify All Income Sources
Your first job is to confirm what tenants are actually paying in rent, not just what's on the rent roll. Always ask for copies of the current lease agreements. This lets you verify rental rates, lease end dates, and any included concessions.
Beyond the rent, look for ancillary income. It all adds up.
Common additional income sources include:
- Parking Fees: Are there assigned spots or garages that bring in extra cash each month?
- Laundry Facilities: Coin-operated or card-based laundry can be a small but surprisingly steady source of income.
- Storage Units: Any on-site storage closets or cages can often be rented out for a monthly fee.
- Pet Fees: Many landlords charge one-time deposits or recurring monthly "pet rent."
Once you have a firm grip on all the money coming in, it's time to tackle the expenses. This is where so many investors, especially new ones, get tripped up.
An accurate cap rate isn’t about making the numbers look good—it’s about protecting your investment. Underestimating expenses by just 5-10% can turn a seemingly profitable deal into a financial drain.
Itemize Operating Expenses
Operating expenses are all the costs needed to keep the lights on and the rent checks coming in. It's crucial to remember that this does not include your mortgage payment (debt service) or major capital improvements like a new roof. For a great way to keep everything organized, check out our guide on building a rental income and expenses spreadsheet.
Your expense checklist should absolutely include these items:
- Property Taxes: Don't rely on the seller's old tax bill. A sale often triggers a reassessment, so check with the local tax authority for the most current figures.
- Insurance: Get a real quote for a landlord insurance policy. Don't just guess.
- Utilities: Pinpoint exactly which utilities are the owner's responsibility. Is it just water and trash, or are you on the hook for gas, too?
- Maintenance & Repairs: A solid rule of thumb is to budget 5-10% of your effective gross income for this category. Older properties will naturally land on the higher end of that range.
- Property Management Fees: Even if you plan to manage it yourself, you must account for this. Plug in an industry-standard fee (8-10% of gross rent) to reflect the true cost of operations and the value of your own time.
- Vacancy Allowance: No property stays 100% occupied forever. A conservative vacancy estimate is usually 5-8% of the gross potential rent, but this can swing wildly depending on your local market.
How to Calculate Net Operating Income Correctly
Your cap rate is only as good as your Net Operating Income (NOI), so getting this number right is everything. Think of NOI as the annual profit a property generates from its day-to-day business—before you account for your loan or personal taxes. The formula itself is simple: Effective Gross Income - Operating Expenses = NOI.
I like to explain it this way: the property is a small business. NOI is its operating profit before the owner (you) pays the business loan (the mortgage) or income taxes. This is why it’s such a powerful metric for comparing two completely different properties on an apples-to-apples basis.
What to Exclude from Your Expense List
One of the most common rookie mistakes I see is lumping ownership costs in with operating costs. If you do this, you’ll artificially deflate your NOI and could walk away from a great deal.
Here’s exactly what to leave out of the calculation:
- Mortgage Payments (Principal and Interest): This is a financing cost, plain and simple. Cap rate evaluates the property, not your loan structure.
- Capital Expenditures (CapEx): A new roof, replacing the HVAC system, or a full kitchen gut job are capital improvements, not routine upkeep. You absolutely have to budget for these big-ticket items, but they don't belong in the annual operating expense list.
- Income Taxes: Your tax situation is unique to you. It has nothing to do with how well the property itself performs.
- Depreciation: This is a "paper" expense for tax purposes. It’s a great benefit, but it doesn't impact the actual cash coming in or out.
Stripping these items out gives you a clean, unbiased look at the asset's performance. This number is the foundation not just for cap rate, but for determining if a property can actually produce positive cash flow. If you're fuzzy on that concept, our guide explains in detail what cash flow in real estate is and why it's a make-or-break metric.
Itemizing Operating Expenses: A Practical Example
Getting your NOI right means being brutally honest and thorough with your expense list. For a commercial or multifamily property, this can get complicated with different lease types and pass-through costs. It's often worth understanding service charge accounting to see which expenses can be legally passed on to tenants.
But let's stick with a straightforward single-family rental to see how this works in the real world.
My Two Cents: I always see new investors lowballing vacancy and maintenance reserves. A conservative approach—bumping those numbers up a bit—is your best defense against overly rosy projections. It gives you a much more realistic benchmark for how the property will actually perform.
Here’s a breakdown of the income and expenses for a typical single-family rental. This is exactly how you’d lay it out to find your NOI.
Sample Net Operating Income (NOI) Calculation for a Single-Family Rental
| Item | Monthly Amount | Annual Amount | Notes |
|---|---|---|---|
| Gross Potential Rent | $2,000 | $24,000 | The total rent if occupied 100% of the time. |
| Vacancy Allowance (5%) | -$100 | -$1,200 | Always budget for turnover and empty months. |
| Effective Gross Income (EGI) | $1,900 | $22,800 | This is your realistic, expected rental income. |
| Operating Expenses | |||
| Property Taxes | $250 | $3,000 | Based on county records. |
| Insurance | $100 | $1,200 | Landlord/Hazard insurance policy. |
| Repairs & Maintenance (8% of EGI) | $152 | $1,824 | A percentage-based reserve is a smart way to budget. |
| Property Management (10% of EGI) | $190 | $2,280 | Standard fee for professional management. |
| Utilities (Owner-paid) | $50 | $600 | e.g., water/sewer, trash service. |
| Total Operating Expenses | $742 | $8,904 | The sum of all legitimate operating costs. |
| Net Operating Income (NOI) | $1,158 | $13,896 | EGI - Total Operating Expenses |
After running the numbers, we see the NOI is $13,896. This is the key figure we’ll plug into the cap rate formula in the next step.
Crunching the Numbers: How to Calculate and Interpret Cap Rate
You've done the hard part and figured out your Net Operating Income (NOI). Now for the fun part—putting it to work. The actual cap rate calculation is refreshingly simple.
The formula is: Cap Rate = Net Operating Income (NOI) / Property Value
This little equation gives you a percentage that represents the property's unlevered annual return. Think of it as a clean way to see how efficiently the asset generates income relative to its cost, completely independent of any loans or financing.
Let's walk through a couple of real-world scenarios to see how this plays out.
Single-Family Home Cap Rate Example
Let's say you're eyeing a single-family rental with a purchase price of $300,000. Using the numbers we worked through earlier, we landed on an annual NOI of $13,896.
Plugging those into the formula is straightforward:
- NOI: $13,896
- Property Value: $300,000
Cap Rate = $13,896 / $300,000 = 0.0463, or 4.63%
That 4.63% cap rate is your baseline. Now you can start comparing it to other similar homes in the neighborhood to see if it’s a competitive return or if you should keep looking.
Small Multifamily Cap Rate Example
Now, let's shift gears to a four-unit building on the market for $850,000. After running the numbers on all the rents and subtracting your estimated vacancy and operating expenses, you've landed on an annual NOI of $55,250.
The math is exactly the same:
- NOI: $55,250
- Property Value: $850,000
Cap Rate = $55,250 / $850,000 = 0.065, or 6.5%
At 6.5%, this multifamily property’s cap rate looks much stronger than the single-family home’s. But this is where the art of interpretation comes in—a higher number isn't automatically better.
So, What Is a Good Cap Rate?
The honest answer? It completely depends on the market, the type of property, and your tolerance for risk. There's no magic number that screams "buy this now!"
A 4% cap rate might be an incredible deal for a brand-new apartment building in a booming city with a long line of qualified tenants. The risk is low. On the flip side, you might pass on anything less than an 8-10% cap rate for an older property in a less certain market that's going to demand more of your time and attention. That higher rate is your compensation for taking on more risk.
The real power of the cap rate isn't the number itself, but what it reveals about the relationship between risk and return. A high cap rate can signal a hidden gem, but it can also be a warning sign for major headaches ahead.
This visual shows how we get to the NOI, which is the engine driving the whole cap rate calculation.
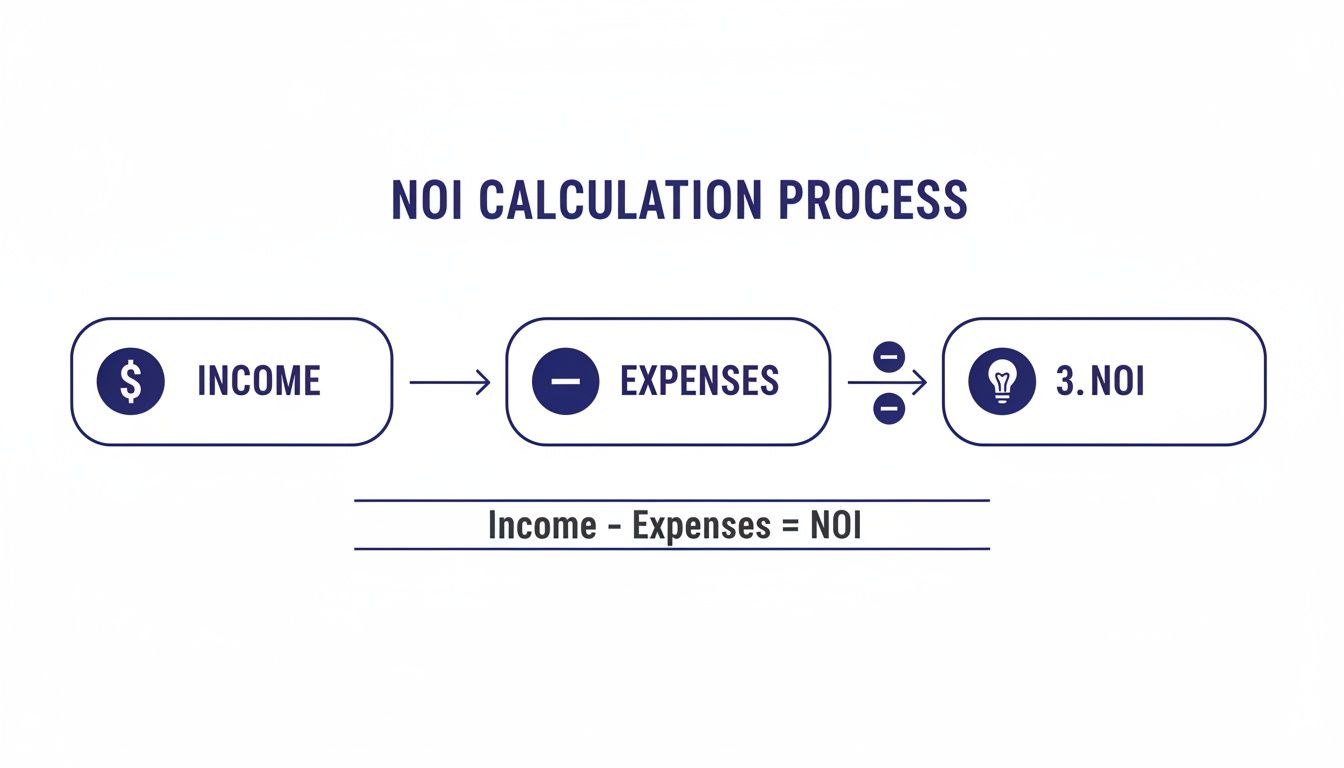
By isolating the property's pure earning potential, you get a clear look at its performance before any financing comes into play.
Remember, cap rates aren't static. They move with the wider economy. We've seen some dramatic swings over the last twenty years, showing just how tightly property values are tied to interest rates. Back in 2021, for instance, rock-bottom interest rates drove multifamily cap rates to historic lows around 4.1%. That's a world away from 2009-2010, when rates shot up to nearly 8% as nervous investors demanded much higher returns. You can dig into more of these historical trends on Callan.com.
Understanding this context is key. It helps you move beyond just asking, "What's the cap rate?" and start asking the more important question: "Why is the cap rate what it is?" That shift in thinking is what separates seasoned investors from the beginners.
Using Other Metrics for a Complete Deal Analysis
While the cap rate is a fantastic tool for calculating cap rate on rental property, it really only gives you a 30,000-foot view of an asset's performance. It’s perfect for quick, apples-to-apples comparisons between properties, but it’s designed to ignore financing. To get a true picture of how an investment will actually work for you, you need to look at the deal from a few different angles.
Think of it this way: the cap rate tells you about the property's raw, unleveraged earning power. But to understand how your personal investment—your down payment, your loan, your specific deal structure—will perform, you have to bring in other metrics. This is where the numbers get personal and much more powerful for making a final decision.
Cash-on-Cash Return: The Investor's Perspective
For most investors using a loan, the Cash-on-Cash Return is arguably the most important number. It answers the one question we all want to know: "For every dollar I put into this deal out of my own pocket, how much cash am I getting back each year?"
This metric zeros in on the actual cash you invest, which is mostly your down payment and closing costs.
The formula is simple:
- Annual Pre-Tax Cash Flow / Total Cash Invested
Notice the key difference from cap rate? This calculation includes your mortgage payment. It reveals the direct return on your invested capital, making it a potent indicator of a deal's immediate profitability from your specific standpoint. You might find that a property with a modest 5% cap rate can deliver an excellent 12% cash-on-cash return if you secure the right financing.
Return on Investment (ROI): The Big Picture
While Cash-on-Cash Return is all about the annual cash flow, Return on Investment (ROI) gives you a much broader look at your total profitability over the life of the investment. It accounts for more than just the cash hitting your bank account each month. It also factors in the equity you build as you pay down the mortgage and any appreciation in the property's value.
A smart deal analysis never hinges on a single number. The cap rate screens the property, Cash-on-Cash Return evaluates your cash flow, and ROI measures your total wealth-building potential. They work together to tell the complete financial story.
For a deeper dive, our detailed guide explains how to calculate the total return on investment for a rental property, helping you see the powerful long-term impact of your purchase. And while cap rate is essential, a complete analysis should also consider other key financial ratios to get a full financial picture.
Understanding the relationship between cap rates and bigger economic trends, like interest rates, also provides crucial context. Historically, cap rates and the 10-year Treasury yield maintain a certain spread that reflects how investors feel about risk. For instance, during the 2001-2003 recession, this spread hit 434 basis points as investors demanded higher returns for taking on risk. In contrast, it was much tighter during the low-rate environment of 2020-2021. This dynamic highlights why looking beyond a single metric is so vital for making sound, long-term decisions.
Got Questions About Cap Rate? Let's Dig In.
Once you get the hang of the cap rate calculation, the real-world questions start popping up. It's one thing to run the numbers, but another to know what they actually mean for your next deal. Let's tackle some of the most common questions I hear from both new and seasoned investors.
Getting these concepts straight is what separates a confident, informed decision from a costly guess. This is where theory meets the street.
So, What’s a "Good" Cap Rate?
This is the big one, and the honest answer is: it depends. There’s no universal magic number that works everywhere. What’s considered a “good” cap rate is completely tied to the market, the specific property, and what you’re willing to risk.
For instance, in a hot urban market like Austin or San Diego, a 4-6% cap rate on a well-maintained property could be a fantastic deal, especially if you're banking on appreciation. But if you’re looking at a property in a smaller Midwest town that needs more hands-on management, you might not even look twice unless the cap rate is 8-10% or higher.
The trick is to stop thinking about a national average and start comparing apples to apples. A property’s cap rate only makes sense when you stack it up against similar properties in the same neighborhood.
Is a Higher Cap Rate Always Better?
Not so fast. A juicy double-digit cap rate looks incredible on a spreadsheet, but it can also be a red flag. A high cap rate often signals high risk, and you absolutely have to figure out why it's so high before you get too excited.
A high cap rate could be a warning sign for things like:
- A property in a neighborhood that's heading downhill.
- A money pit that needs a new roof, HVAC, and plumbing.
- A revolving door of tenants and constant vacancy problems.
A high cap rate isn't a "buy" signal; it's a signal to do more homework. Your job is to dig deep and uncover the story behind that number.
How Does Financing Change the Cap Rate?
Here’s a crucial point that trips people up: it doesn’t. The cap rate formula is based on the property operating as if it were bought with cash. It completely ignores your mortgage.
This is what makes it such a powerful tool—it lets you compare the raw performance of different properties on an even playing field, regardless of how you plan to finance them.
Once you start layering in your loan details—the down payment, interest rate, and term—you’ve moved on to a different metric. That’s when you calculate your Cash-on-Cash Return, which measures the return on the actual cash you’ve pulled out of your pocket.
Stop drowning in spreadsheets and start making data-driven decisions. Property Scout 360 automates the entire analysis process, giving you instant cap rate, cash flow, and ROI projections for any U.S. property. Find your next profitable investment in minutes at Property Scout 360.
About the Author
Related Articles
2026 Investor's Guide: Cost of Installing a Sewer Clean Out
Understand the cost of installing a sewer clean out for investment properties in 2026. Get expert advice on prices, ROI, & budgeting for flips. Plan smart!
15 Year vs 30 Year Mortgage: The Investor's Choice
Deciding between a 15 year vs 30 year mortgage for a rental property? Our guide analyzes cash flow, ROI, and equity to help you pick the best loan.
Real Estate Appraisal Software: Features & Limits
Discover what real estate appraisal software is, its core features, and limits. See how it differs from investment tools for profitable deals.