How to Calculate Cap Rate for Rental Property An Investor's Guide
Learn how to calculate cap rate for rental property using real-world examples. Master the formula to analyze and compare real estate investments effectively.
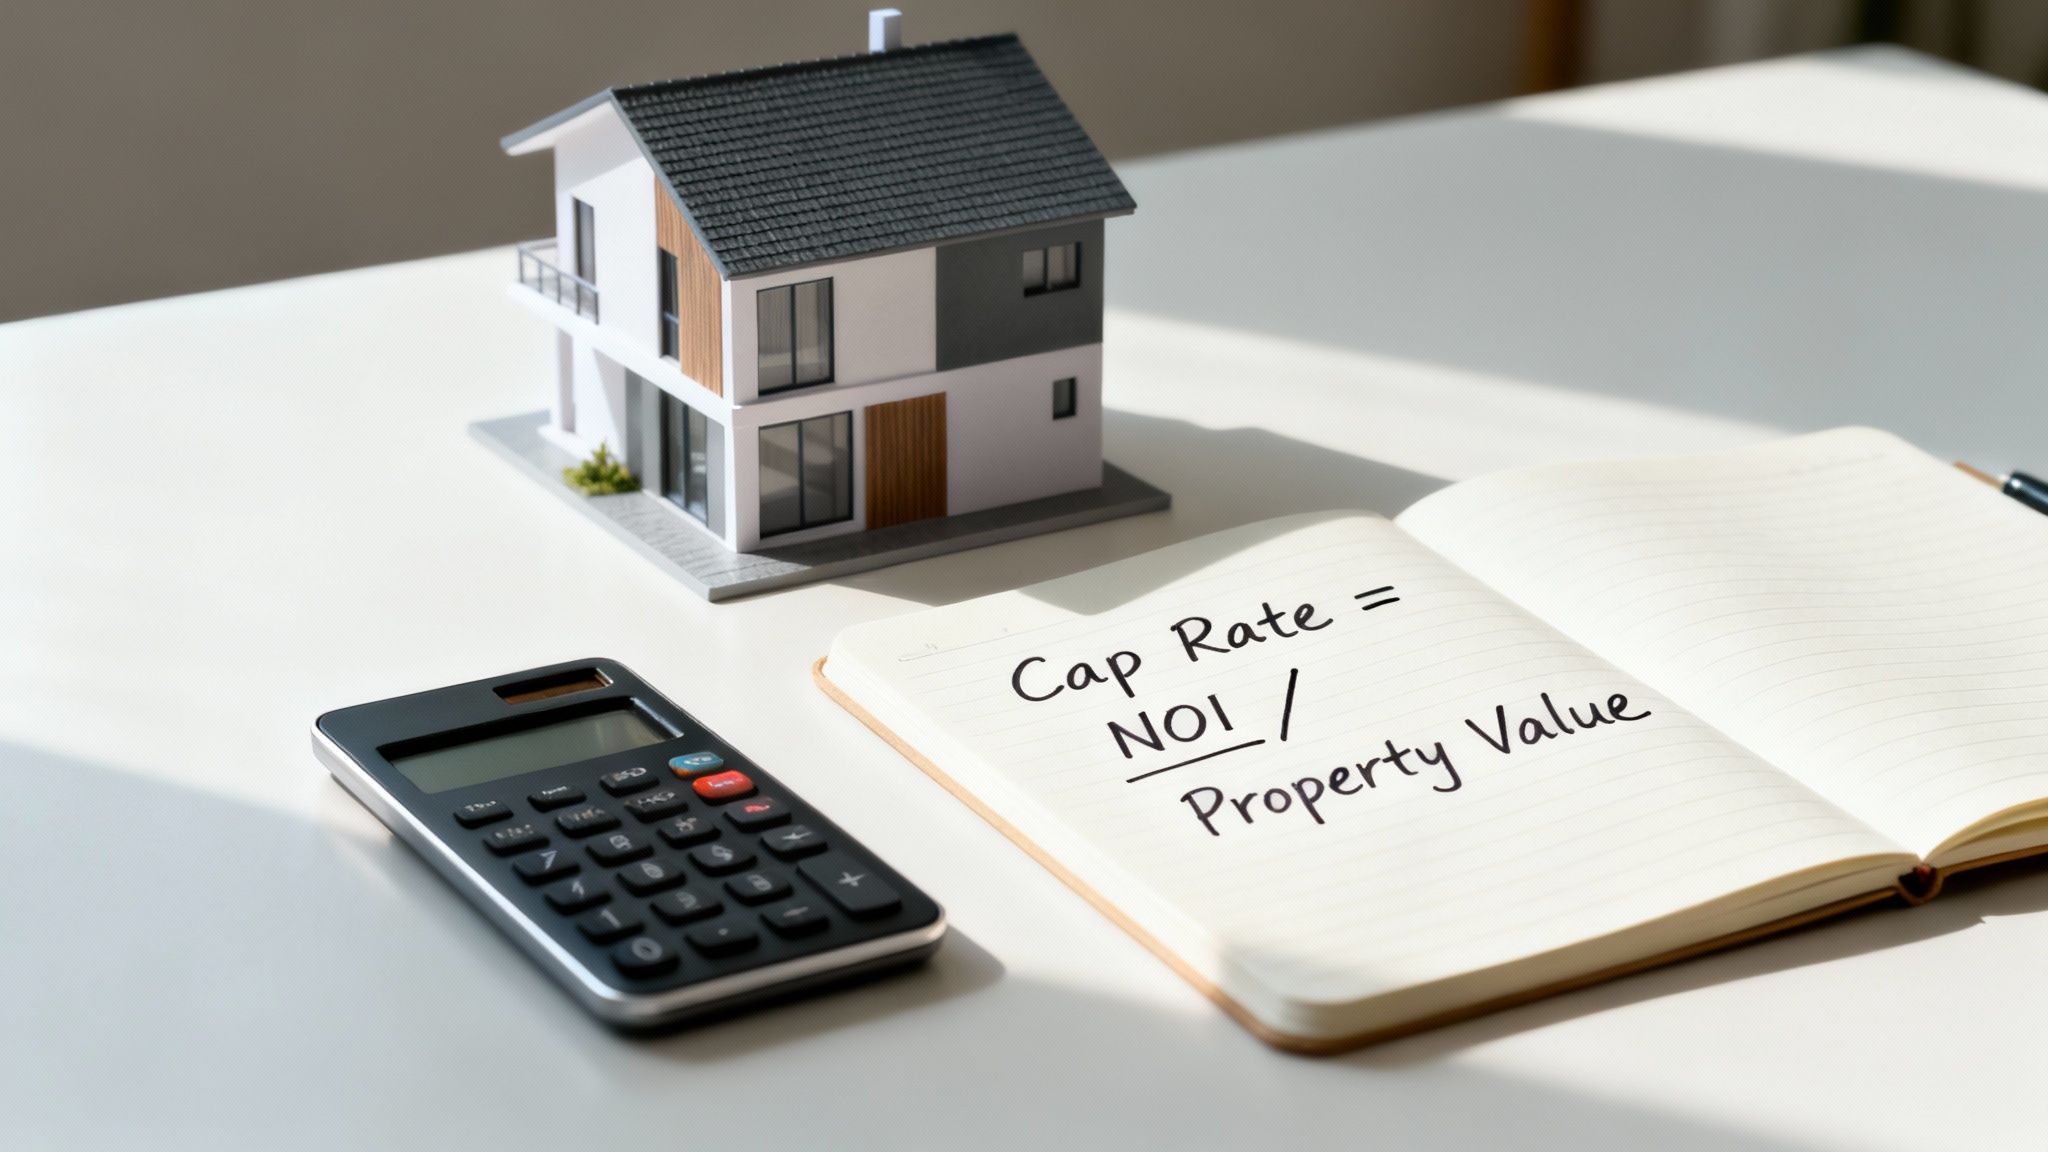
To figure out the cap rate for a rental property, you just need two numbers: its Net Operating Income (NOI) and its current market value. You divide the NOI by the value, and that simple formula gives you a percentage that shows the property's unleveraged annual return. It's an incredibly powerful tool for comparing one investment opportunity to another.
What Is Cap Rate and Why Does It Matter?
Before we start crunching numbers, let's get a feel for what cap rate really tells you. I like to think of it as a quick financial health check for a potential investment property.
This single percentage strips away financing details and lets you compare the raw profitability of different properties on an even playing field.
The formula itself is straightforward: Cap Rate = (Net Operating Income / Property Value) × 100. The Net Operating Income (NOI) is simply your total annual rental income minus all your operating expenses—things like maintenance, insurance, and property taxes. Crucially, it excludes your mortgage payments.
For example, say you're looking at a small multifamily building for $2,000,000. It brings in $120,000 in rent per year, and your annual operating expenses run about $30,000. That leaves you with an NOI of $90,000. Your cap rate would be 4.5% ($90,000 / $2,000,000).
The Core Components of the Formula
The beauty of the cap rate calculation is its simplicity. It really just boils down to two key parts, and understanding them is essential.
Here’s a quick breakdown of the terms you'll be working with.
| Component | Definition | Role in Calculation |
|---|---|---|
| Net Operating Income (NOI) | The property's annual income after all operating expenses are paid but before mortgage payments or income taxes. | This is the numerator; it represents the property's raw profitability from operations. |
| Property Value | This is the purchase price or the current, fair market value of the property. | This is the denominator; it's the cost basis against which you measure the income. |
These two elements give you a pure, unfiltered look at a property's performance.
The real power of cap rate is its ability to value a property based purely on its income-generating potential. By removing the variable of financing from the equation, it lets you standardize your comparisons and focus solely on operational performance.
Ultimately, getting comfortable with this metric is one of the first, most important steps toward making smarter, data-driven investment decisions. A solid grasp of cap rate is fundamental when you analyze any rental property for its true potential because it helps you quickly gut-check if a property's asking price is actually justified by its earnings.
Nailing Your Net Operating Income Calculation

Think of Net Operating Income (NOI) as the engine driving your cap rate. A small error here can send your entire analysis off course, so precision is everything. This number shows you how profitable a property truly is before you even think about loans or taxes.
The path to a solid NOI starts with a clear-eyed look at a property's potential income, then carefully subtracting all the costs of running the place.
Start With Income, Then Get Real
First things first, figure out the Gross Potential Income (GPI). This is the absolute maximum rent you could collect if the property was full 100% of the time. For a single-family home that rents for $2,000 a month, the GPI is a straightforward $24,000 a year.
But let's be honest—no property is ever occupied 100% of the time. That’s why you have to factor in a vacancy allowance. In a typical residential market, a vacancy rate of 5% to 8% is a safe bet. Skipping this step is a classic rookie mistake that makes a deal look much better on paper than it is in reality.
To find your Effective Gross Income (EGI), you just subtract that vacancy loss from your GPI.
- Gross Potential Income: $2,000/month x 12 = $24,000
- Vacancy Loss (at 5%): $24,000 x 0.05 = $1,200
- Effective Gross Income: $24,000 - $1,200 = $22,800
This number gives you a much more realistic foundation for the rest of your math.
Detailing Your Operating Expenses
Next up, you have to tally up all the legitimate operating expenses—the money it takes to keep the lights on and the property running smoothly. A common shortcut is the "50% rule," which assumes half your gross income gets eaten up by expenses. It's a decent starting point, but a detailed breakdown is always better.
Your goal isn't to make the numbers look good; it's to make them accurate. Underestimating expenses by even a few percentage points can be the difference between a profitable investment and a financial drain.
Here are the core expenses you absolutely must include in your calculation:
- Property Taxes: Don't rely on the seller's old figure. Pull the most recent tax assessment.
- Insurance: Landlord or hazard insurance is a non-negotiable cost.
- Property Management Fees: Even if you plan to self-manage, account for this. A standard fee is 8-10% of your EGI. Your time isn't free.
- Repairs & Maintenance: Set aside 5-10% of your EGI. This covers everything from a surprise plumbing leak to a broken appliance.
- Utilities: If you're paying for water, sewer, trash, or anything else, it goes here.
- Landscaping & Snow Removal: These recurring costs are part of the operation.
Just as important is knowing what to leave out. Your NOI calculation should never include your mortgage payment (principal and interest), income taxes, or big-ticket capital expenditures (CapEx) like a new roof. Those are ownership costs, not operational ones. For investors managing larger portfolios, specialized real estate data management solutions can be a lifesaver for keeping these details straight.
Using a good tracking system is key. You can make this much easier with a detailed rental income and expenses spreadsheet to ensure no cost falls through the cracks. Once you've diligently accounted for every real expense, you have your true Net Operating Income—the number you can trust for an accurate cap rate.
Putting the Cap Rate Formula into Practice
Okay, theory is great, but let's get our hands dirty. The best way to truly understand cap rate is to run the numbers on a couple of real-world properties. We'll start with a classic single-family rental and then move on to a small duplex to see how the analysis differs.
Scenario 1: The Suburban Single-Family Home
You've found a promising three-bedroom house in a good school district, and the seller is asking $350,000. Based on your market research, you're confident it will rent for $2,500 per month.
So, how do we get to the Net Operating Income (NOI)?
- Gross Potential Rent: $2,500/month x 12 months = $30,000
- Vacancy (5%): We need to account for turnover. Let's use a conservative 5% vacancy rate, which is $1,500 per year.
- Effective Gross Income (EGI): $30,000 - $1,500 = $28,500
Now, let's tally up the expenses. These are the real costs of owning the property.
- Property Taxes: Pulled from county records, they're $4,200 annually.
- Insurance: A quote from your agent comes in at $1,200 per year.
- Repairs & Maintenance: A good rule of thumb is 8% of EGI, so that's $2,280.
- Property Management: If you hire a pro at 9% of EGI, that's another $2,565.
- Total Annual Expenses: Adding it all up, we get $10,245.
With our EGI and expenses figured out, calculating NOI is simple:
NOI = $28,500 (EGI) - $10,245 (Expenses) = $18,255
Finally, the moment of truth. We plug the NOI into our cap rate formula:
Cap Rate = ($18,255 / $350,000) x 100 = 5.2%
For this property, the cap rate is 5.2%. This number is your benchmark. It’s what you’ll use to compare this deal against other opportunities on the market.
Scenario 2: The Urban Duplex
Next up is a duplex in a trendier urban neighborhood, listed at $500,000. Each of the two units brings in $1,600 per month. The process is the same, but now we're dealing with two income streams and a few extra costs.
First, let's figure out the income.
- Gross Potential Rent: ($1,600/month x 2 units) x 12 = $38,400
- Vacancy (6%): Multi-family can have a bit more turnover, so we'll bump this to 6%, which is $2,304.
- Effective Gross Income (EGI): $38,400 - $2,304 = $36,096
Now for the expenses, which are naturally a bit higher for a larger property.
- Property Taxes: $6,000
- Insurance: $1,800
- Repairs & Maintenance: We’ll budget 10% of EGI for an older duplex: $3,610.
- Property Management: At 8% of EGI, this is $2,888.
- Utilities: It's common for landlords to cover water/sewer, adding $1,200.
- Total Annual Expenses: The grand total comes to $15,498.
Let's find our NOI:
NOI = $36,096 (EGI) - $15,498 (Expenses) = $20,598
And now for the cap rate:
Cap Rate = ($20,598 / $500,000) x 100 = 4.1%
At 4.1%, the duplex's cap rate seems lower and therefore less appealing than the single-family home's 5.2%. But hold on—this isn't the whole story. A lower cap rate can often signal a more desirable, high-demand location where you can expect stronger appreciation over time. This shows how cap rate is a critical tool, but it's just one piece of the investment puzzle.
It's also worth remembering that these numbers don't exist in a vacuum. Market conditions are always shifting. For instance, national average cap rates for single-family rentals climbed from around 5.3% in late 2021 to 6.8% by mid-2024. Knowing these trends provides essential context for your own analysis.
Once you get comfortable running these numbers, you can use cap rate as a core component to calculate rental property value with the same methods seasoned pros use.
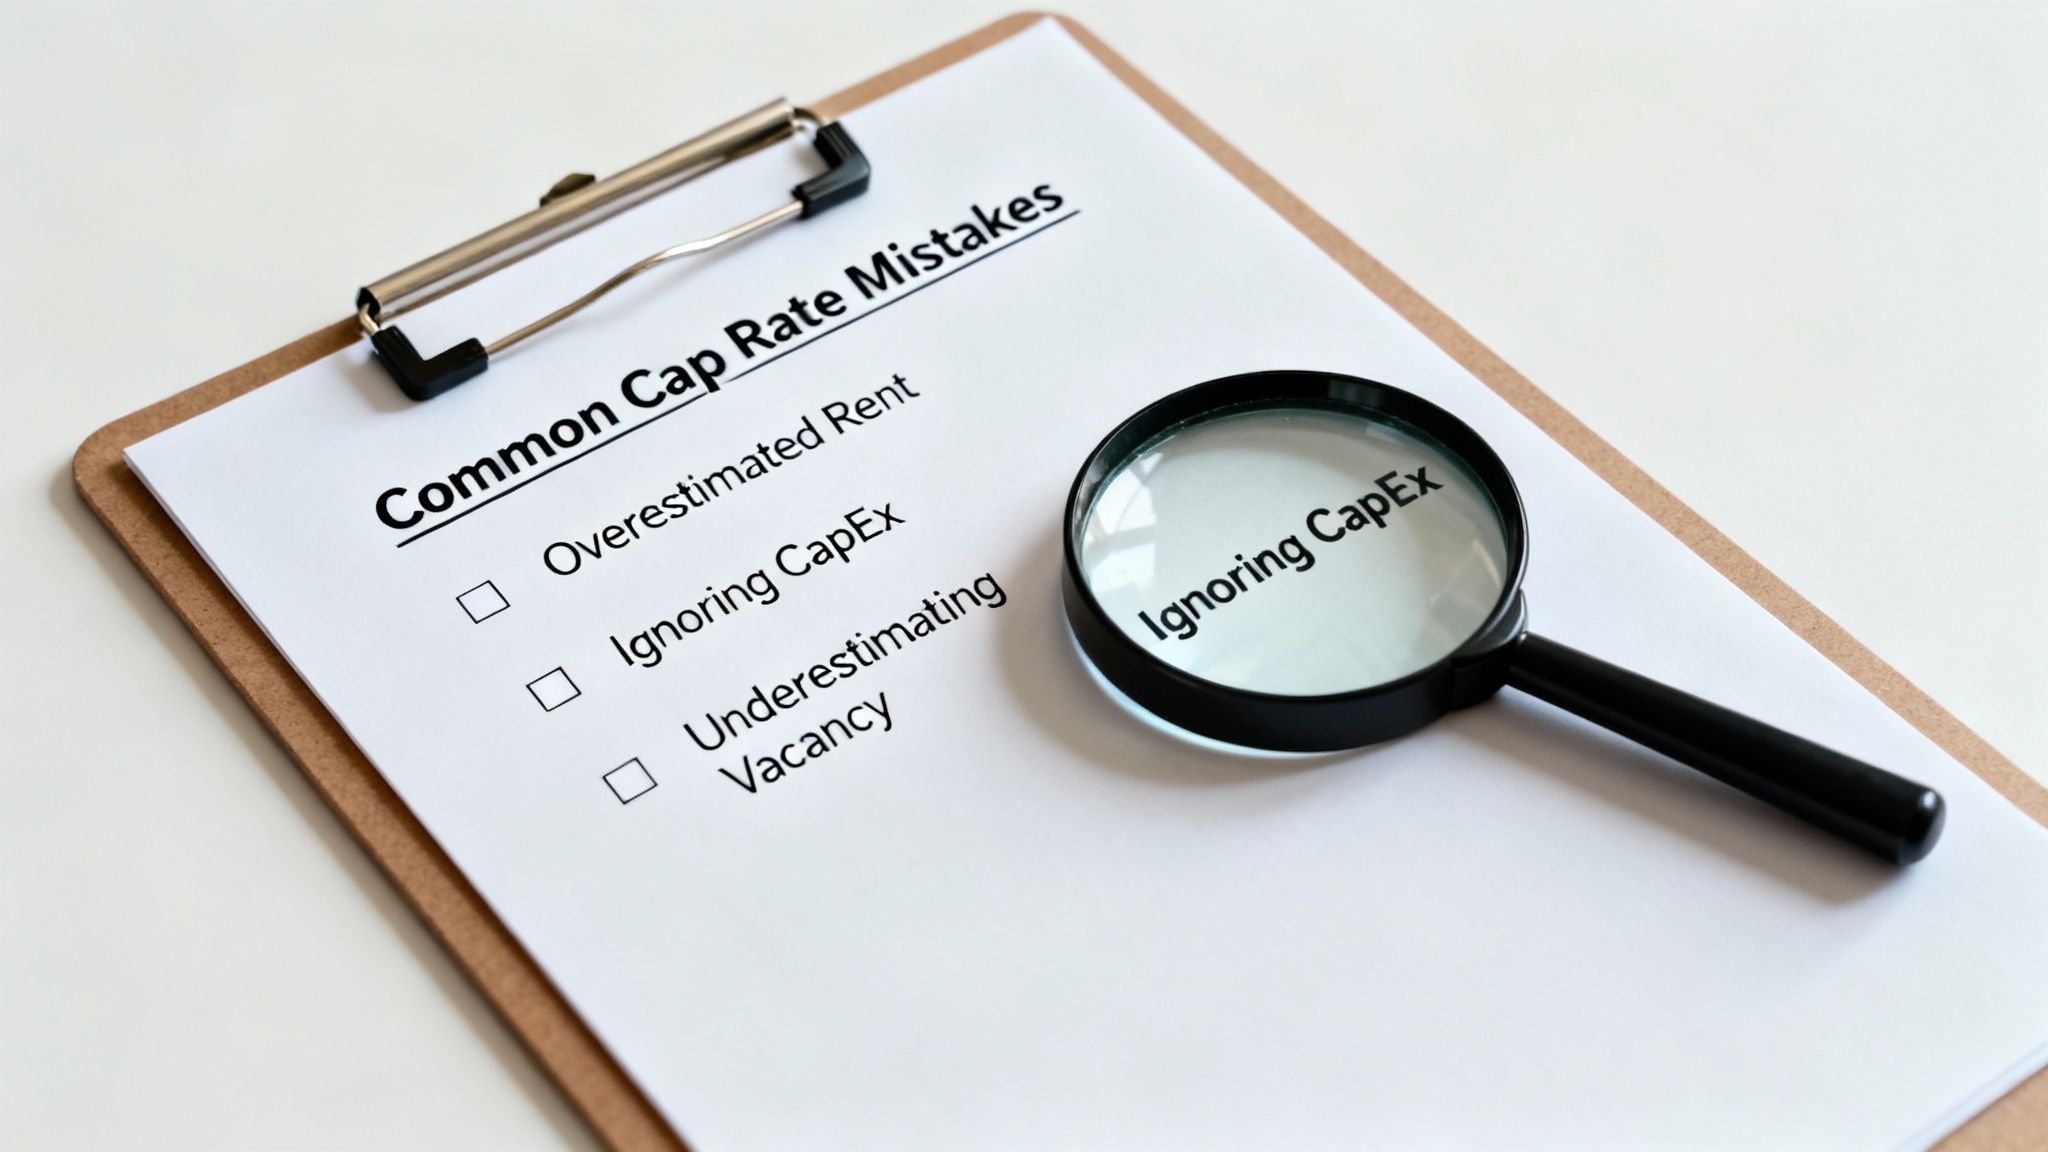
Common Cap Rate Mistakes and How to Avoid Them
The cap rate formula seems straightforward on the surface, but don't let that simplicity fool you. It’s surprisingly easy to make a mistake that turns a questionable deal into a "sure thing" on paper. If you really want to know how to calculate cap rate for a rental property the right way, you need to know which pitfalls to watch out for.
One of the oldest traps in the book is taking the seller's pro forma at face value. These are marketing documents, plain and simple. They often paint a rosy picture with 100% occupancy and unrealistically low expenses. Do your own homework. Always. Build your analysis from scratch with numbers you can verify.
Another classic blunder is lowballing vacancy and maintenance costs. A small "oops" here can snowball into a massive miscalculation. Forgetting to set aside 5-8% for vacancies or budgeting pocket change for repairs will inflate your NOI and give you a dangerously misleading cap rate.
Confusing Operating Costs with Capital Spending
This is a big one, and it trips up new and even seasoned investors. You absolutely have to know the difference between ongoing operating expenses (OpEx) and major capital expenditures (CapEx). Get this wrong, and your NOI calculation will be worthless.
OpEx are the routine, everyday costs of keeping the lights on and the rent checks coming in.
- Examples of OpEx: Property taxes, landlord insurance, fixing a running toilet, lawn care, and property management fees.
CapEx are the big-ticket items. These are major investments that add value or extend the life of the property, not just maintain it. They don't belong in your annual operating budget, so they must be excluded from the NOI formula.
- Examples of CapEx: A full roof replacement, a brand-new HVAC system, or a gut renovation of a kitchen.
Here’s a simple way to think about it: fixing a leaky faucet is an operating expense. Replacing all the pipes in the building is a capital expenditure. Your NOI should only reflect the cost of the faucet repair, not the massive plumbing overhaul.
Ignoring Future Expense Increases
A snapshot in time isn't a long-term strategy. Property taxes, insurance, and utilities almost never go down—they creep up year after year. A common mistake is using today's expenses to predict performance for the next five or ten years. That’s just not realistic.
Smart investors plan for this. When you're running the numbers, build in a reasonable annual increase for your major expenses. A 2-3% bump per year for taxes and insurance is a good place to start. This gives you a much more durable and honest financial projection.
Forgetting this step is like planning a cross-country road trip and assuming gas prices will stay the same the whole way. You’re setting yourself up to run out of fuel.
Finally, always account for property management, even if you plan to manage it yourself. Your time isn't free. By including a standard management fee—usually 8-10% of gross income—in your expense column, you ensure your analysis reflects the property's true operational cost. This also makes your cap rate comparable to other deals on the market that are professionally managed.
Dodging these common mistakes will keep your calculations grounded in reality, which is the key to making smarter, more profitable decisions.
Looking Beyond Cap Rate: A Smarter Approach to Deal Analysis
Cap rate is a fantastic tool for quickly sizing up a property, no doubt about it. It gives you that clean, apples-to-apples comparison. But if you stop there, you're only seeing part of the picture—and potentially leaving money on the table or walking into a bad deal.
Think of cap rate as your initial screening tool. It helps you scan the market and identify potential contenders. Once you've got a property in your sights, though, you need to bring in other metrics to see how the deal actually works for you, especially when financing is involved. Two of the most crucial are Cash-on-Cash Return and the classic Return on Investment (ROI).
Cash-on-Cash Return: What’s Your Wallet Actually Feeling?
This is where the rubber meets the road. While cap rate ignores financing entirely, Cash-on-Cash Return puts it right at the center of the conversation. It tells you exactly how much pre-tax cash you'll get back each year based on the actual cash you pulled out of your pocket to buy the place.
The formula is simple but powerful: Annual Pre-Tax Cash Flow / Total Cash Invested.
Your "Total Cash Invested" isn't the purchase price; it’s your down payment, closing costs, and any upfront rehab money. This metric is so valuable because it shows the real power of leverage. You might find a property with a decent but not amazing cap rate that suddenly looks incredible once you see its 20% cash-on-cash return thanks to a low down payment and good loan terms. It's a measure of how hard your money is working.
Return on Investment (ROI): The Big Picture
If cash-on-cash is about your annual cash flow, Return on Investment (ROI) is about the total wealth you build over the long haul. It's a much broader metric that accounts for everything.
ROI doesn't just look at cash flow. It also factors in the equity you gain as your tenant pays down your mortgage and, crucially, any appreciation in the property's value. This gives you a complete view of your total profit when you eventually sell. For a closer look at all the moving parts, our guide on calculating rental property ROI breaks it all down.
My Takeaway: I use cap rate to compare properties. I use cash-on-cash to analyze a specific deal with my financing. I use ROI to project my total profit and long-term wealth.
Investment Metrics Comparison: Cap Rate vs. Cash-on-Cash vs. ROI
To really understand how these metrics work together, it helps to see them side-by-side. Each one offers a unique lens through which to view a potential investment, and using them in combination gives you a much clearer financial picture.
| Metric | What It Measures | Formula | Best Used For |
|---|---|---|---|
| Cap Rate | The property's unleveraged, raw profitability. | Net Operating Income / Property Price | Quickly comparing multiple properties on an equal footing, regardless of financing. |
| Cash-on-Cash Return | The annual return on your actual cash invested. | Annual Pre-Tax Cash Flow / Total Cash Invested | Evaluating a specific deal with your financing terms to understand immediate cash flow. |
| Return on Investment (ROI) | The total return over the life of the investment. | (Net Profit / Total Investment Cost) x 100 | Measuring the overall long-term success of an investment, including appreciation and equity. |
Using this trio of metrics is what separates savvy investors from beginners. You can scan an entire market with cap rates, dig into a specific deal's performance with cash-on-cash, and then forecast your long-term success with ROI. It’s a complete toolkit for making confident decisions.
Common Questions About Cap Rate Calculations
Even after you've got the formula down, putting cap rate to work in the real world brings up a lot of practical questions. I hear them all the time from other investors. Let's tackle a few of the most common ones that come up when you're figuring out how to calculate the cap rate for a rental property.
What’s a Good Cap Rate, Really?
There’s no single magic number. What’s considered a “good” cap rate depends entirely on the market, the property type, and your own appetite for risk.
In a hot, high-appreciation market like San Francisco, you might jump on a deal with a 4-5% cap rate. Why? Because you’re banking on future value growth. But in a smaller, slower-growing market, you'd likely want to see something in the 8-10% range (or even higher) to make the deal worthwhile.
A good cap rate is simply one that makes sense for its specific neighborhood and lines up with your investment strategy. The best way to know is to compare your target property against what similar properties have recently sold for nearby.
How Do Interest Rates and Cap Rates Relate?
Think of interest rates and cap rates like two ends of a seesaw. They have an inverse relationship. When interest rates climb, loans get more expensive, which tends to cool down buyer demand and soften property prices.
To keep real estate a compelling investment compared to safer options like bonds, investors start demanding higher returns. This pressure pushes cap rates up.
When the cost of borrowing goes up, investors need to see a better return from a property to justify taking on the risk. That's what drives cap rates higher across the market.
On the flip side, when interest rates drop, financing becomes cheaper. This usually sparks more competition among buyers, pushing property prices higher. As prices go up, the return (or yield) gets compressed, and cap rates fall.
Can I Use Cap Rate for a Fix-and-Flip?
Please don't. It's the wrong tool for the job, plain and simple. Cap rate is all about measuring the long-term, ongoing income potential of a rental property. It’s perfect for a buy-and-hold strategy.
A fix-and-flip is a completely different game. Your profit comes from the After Repair Value (ARV) minus your total cost (purchase plus rehab). For a short-term project like that, you need to be looking at metrics like Return on Investment (ROI) or annualized ROI. These are designed to measure the profit from a single sale, not recurring income.
Tired of endless spreadsheets and manual calculations? Property Scout 360 automates everything from cap rate to cash flow and ROI, giving you instant, data-driven deal analysis so you can make confident investment decisions in minutes. Explore how you can find and evaluate profitable properties faster at https://propertyscout360.com.
About the Author
Related Articles
2026 Investor's Guide: Cost of Installing a Sewer Clean Out
Understand the cost of installing a sewer clean out for investment properties in 2026. Get expert advice on prices, ROI, & budgeting for flips. Plan smart!
15 Year vs 30 Year Mortgage: The Investor's Choice
Deciding between a 15 year vs 30 year mortgage for a rental property? Our guide analyzes cash flow, ROI, and equity to help you pick the best loan.
Real Estate Appraisal Software: Features & Limits
Discover what real estate appraisal software is, its core features, and limits. See how it differs from investment tools for profitable deals.