Mastering the Investment Property ROI Calculator
Unlock smarter real estate deals with our investment property ROI calculator guide. Learn to analyze metrics, gather data, and interpret results like a pro.
At its core, an investment property ROI calculator is a simple tool designed to answer one big question: will this property make me money? It works by stacking all the income a property generates against all of its costs. But to really get the most out of it, you need to understand the language it speaks—the key metrics like Return on Investment (ROI), Cash-on-Cash Return, and Capitalization (Cap) Rate. Together, they paint a complete financial picture.
Understanding the Language of Real Estate Returns
Before you plug any numbers into a calculator, it’s crucial to know what you're actually calculating. Getting a handle on these terms is what separates a novice from a seasoned pro. It’s the difference between making an emotional guess and making a confident, data-backed decision that you can stand behind.
Once you’re comfortable with these concepts, you can look at the output from any calculator and truly understand the story it's telling you about a property's potential.
Decoding the Core Metrics
Every serious real estate analysis is built on a foundation of four key calculations. Each one gives you a slightly different lens through which to view a property's profitability.
Return on Investment (ROI): This is the 30,000-foot view. ROI looks at the total return—that’s both net income and any equity growth from appreciation—measured against the total investment cost. It’s the perfect metric for judging a property’s overall performance after you've held it for a while. For a practical example, see how a kitchen renovation return on investment can impact a property's total value.
Cash-on-Cash Return: If you’re using a loan, this metric will be your best friend. It shows you the annual cash flow you receive before taxes as a percentage of the actual cash you put into the deal (your down payment, closing costs, etc.). It answers the most important question for a leveraged investor: "For every dollar I put in, how many am I getting back each year?" We break this down further in our guide on https://propertyscout360.com/blog/what-is-cash-flow-in-real-estate.
Capitalization Rate (Cap Rate): Think of the Cap Rate as a quick and dirty way to compare similar properties, completely ignoring financing. It's simply the Net Operating Income (NOI) divided by the property's market value. This is the go-to metric for an apples-to-apples comparison when you're initially screening deals.
Break-Even Ratio: This is your safety net metric. It tells you exactly what percentage of your gross income is eaten up by expenses and debt. A lower ratio means you have more wiggle room for unexpected vacancies or repairs before you start losing money. It’s a fantastic way to gauge risk.
These four metrics provide a comprehensive framework for evaluating any potential investment. To make it even clearer, here’s a quick summary of what each one does and when it’s most useful.
Key Real Estate Investment Metrics at a Glance
| Metric | What It Measures | Best Use Case |
|---|---|---|
| Return on Investment (ROI) | Total profit (income + appreciation) vs. total cost. | Evaluating long-term performance of a flip or rental. |
| Cash-on-Cash Return | Annual pre-tax cash flow vs. your actual cash invested. | Analyzing returns when using financing (a mortgage). |
| Cap Rate | Net Operating Income vs. the property's market value. | Quick, debt-free comparison of similar properties in an area. |
| Break-Even Ratio | The occupancy rate needed to cover all operating costs and debt. | Assessing the risk and financial stability of an investment. |
By using these metrics together, you move from just looking at numbers to truly understanding a property's financial health and its potential place in your portfolio.
A landmark 145-year study found that residential real estate has historically delivered real returns of about 7% per year, rivaling the performance of stocks. This is exactly why getting your calculations right is so important—it's the key to capturing those powerful long-term gains.
Nailing Down the Numbers: What Your Calculator Needs to Know
Any investment property calculator is just a tool. A powerful one, yes, but its results are only as good as the numbers you feed it. Think of it like this: garbage in, garbage out. To get a truly accurate picture of a property's potential, you have to get meticulous about gathering every last bit of income and expense data.
It's easy to get overwhelmed, so let's break it down into two manageable chunks: the upfront cash you'll need to close the deal and the recurring numbers that dictate your monthly cash flow.
Tallying Your Upfront Investment
First things first, you need to figure out the total cash you'll have out-of-pocket to get the property up and running. This is way more than just the down payment. Honestly, underestimating this figure is one of the biggest rookie mistakes I see, and it can completely torpedo your return projections from day one.
Here’s what you absolutely must include in your total investment:
- Purchase Price: The obvious one—the number on the sales contract.
- Closing Costs: These are the slew of fees needed to legally seal the deal. A good rule of thumb is to budget 2% to 5% of the purchase price to cover things like title insurance, loan fees, appraisals, and legal costs.
- Inspection Fees: Never skip this. Paying a few hundred dollars for professional foundation, pest, or radon inspections can save you from a five-figure nightmare down the road.
- Initial Rehab & Repair Budget: How much will it cost to get the place rent-ready? This could be a few thousand for paint and carpet or a major budget for a new kitchen and updated bathrooms.
Getting this total investment number right is the bedrock of your analysis. It's the "cash" in your Cash-on-Cash Return, so precision here is non-negotiable.
A hard-won tip for new investors: Get at least three quotes for any significant rehab work. I've seen a job one contractor quoted at $15,000 get done just as well by another for $11,000. That $4,000 difference goes straight back into your pocket and dramatically improves your day-one ROI.
Mapping Out Ongoing Income and Expenses
With your initial investment locked in, it's time to shift focus to the property's monthly financial life. This means forecasting every dollar that will come in and every dollar that will go out.
Where the Money Comes From (Income):
- Gross Monthly Rent: This is your bread and butter. Don't just guess; research what comparable units in the immediate neighborhood are actually renting for right now.
- Other Income: Are you charging for pets, parking spots, or on-site laundry? It might not seem like much, but these small streams can add up to a significant amount over a year.
Where the Money Goes (Expenses):
These are all the costs to keep the property running, not including your mortgage payment (that comes later in the calculation).
- Property Taxes: You can usually find this on the public listing or by checking the county assessor's website.
- Landlord Insurance: This is not the same as a standard homeowner's policy. Make sure you're getting quotes for the right kind of coverage.
- Property Management: If you're not managing it yourself, expect to pay a pro 8% to 12% of the monthly rent.
- Vacancy Fund: No property stays rented 100% of the time. I always set aside 5% to 8% of the total annual rent to cover the months it sits empty between tenants.
- Repairs & Maintenance: Things break. The "1% rule" (budgeting 1% of the home's value annually for repairs) is a decent starting point, but I prefer a more detailed estimate based on the age of the roof, HVAC, and appliances.
- HOA Fees & Utilities: Don't forget any homeowners' association dues or utilities like water, sewer, or trash that you're on the hook for as the owner.
Taking the time to dig up these numbers—both the big upfront costs and the small ongoing expenses—is what separates a professional analysis from a hopeful guess. This is the diligence that builds a truly sound investment strategy.
Putting The Calculator To Work With Real-World Scenarios
Theory is one thing, but running the numbers on a live deal is where an investment property ROI calculator really proves its worth. It stops being an abstract tool and becomes the engine that drives your decisions.
Let's walk through two completely different but very common investment scenarios. By plugging in the numbers, you'll see just how much financing strategies and property type can swing your potential returns, even on deals with similar price tags. We’ll pit a classic "Starter Duplex" against a hands-off "Turnkey Single-Family Rental" to see how they stack up.
Scenario A: The Starter Duplex
You’ve found a duplex for $350,000. It's a solid building in a good area—a perfect first investment. You plan on putting 20% down, a common route for investors starting out.
Here’s how the initial numbers shake out:
- Purchase Price: $350,000
- Down Payment (20%): $70,000
- Closing Costs (3%): $10,500
- Initial Rehab Budget: $7,500 (for fresh paint, new fixtures, and minor TLC)
- Total Cash Invested: $88,000
With your upfront investment locked in, it's time to look at the monthly cash flow. Each unit can realistically rent for $1,600, bringing in a total gross monthly income of $3,200.
Now for the other side of the ledger—the monthly expenses:
- Mortgage (Principal & Interest): $1,680
- Property Taxes: $350
- Insurance: $120
- Vacancy Reserve (5%): $160
- Repairs & Maintenance (7%): $224
- Total Monthly Expenses: $2,534
After all the bills are paid, you're left with a monthly cash flow of $666. That adds up to $7,992 in your pocket each year.
Running the final calculation, your Cash-on-Cash Return is a healthy 9.08% ($7,992 / $88,000). That’s a strong return and shows how your initial capital is working hard for you.
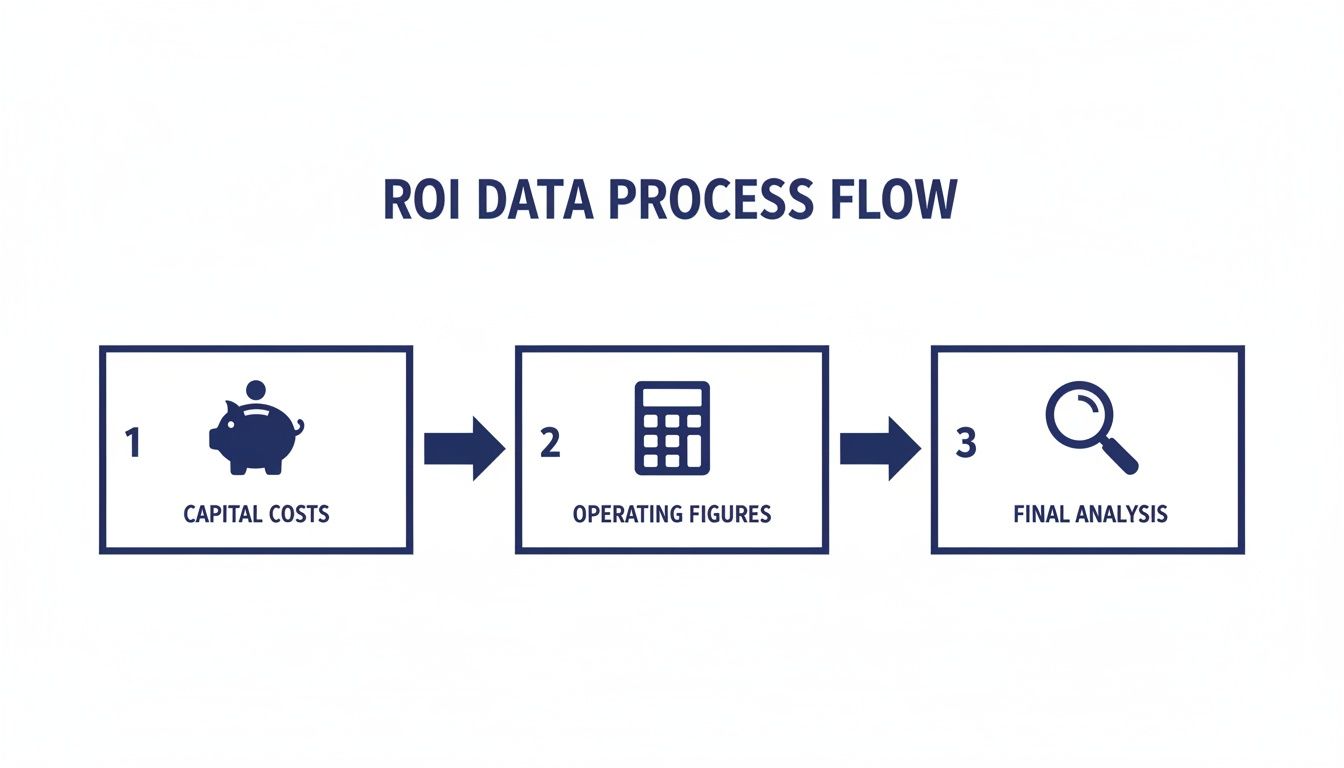
This whole process follows a logical flow: you start with what it costs to get the deal done, factor in the ongoing operational numbers, and arrive at your final return metrics.
Scenario B: The Turnkey Single-Family Rental
Next up, let's analyze a single-family home (SFR) priced at $340,000. It’s a "turnkey" property, meaning it's already renovated and has a tenant in place. Since this is a pure investment, your lender will likely require a larger down payment.
Here’s the breakdown for the turnkey SFR:
- Purchase Price: $340,000
- Down Payment (25%): $85,000
- Closing Costs (3%): $10,200
- Initial Rehab Budget: $0 (the work is already done)
- Total Cash Invested: $95,200
The home is already renting for $2,900 per month. Since it’s freshly updated, you can budget a little less for ongoing repairs.
Here’s what the monthly expenses look like:
- Mortgage (Principal & Interest): $1,530
- Property Taxes: $330
- Insurance: $110
- Vacancy Reserve (5%): $145
- Repairs & Maintenance (5%): $145
- Property Management (8%): $232
- Total Monthly Expenses: $2,492
That leaves you with a monthly cash flow of $408, which comes out to $4,896 annually. The Cash-on-Cash Return here is 5.14% ($4,896 / $95,200). It’s still a positive return, but it's noticeably lower than the duplex.
When running these scenarios, you also have to think long-term. A big repair like a new roof can throw your numbers off if you're not prepared. Understanding the various financing options for property improvements ahead of time is crucial for protecting your cash flow and overall returns.
The big takeaway here is a classic real estate lesson: Leverage is a double-edged sword. The lower down payment on the duplex amplified the return on every dollar invested, even though it came with a higher mortgage payment.
Comparing The Results Side-By-Side
The true magic of an ROI calculator is its ability to put different deals on a level playing field. It cuts through the noise and shows you the raw performance.
This table really drives home the difference between the two deals.
Scenario Comparison: Starter Duplex vs. Turnkey SFR
| Metric | Scenario A: Starter Duplex (20% Down) | Scenario B: Turnkey SFR (25% Down) |
|---|---|---|
| Purchase Price | $350,000 | $340,000 |
| Total Cash Invested | $88,000 | $95,200 |
| Annual Cash Flow | $7,992 | $4,896 |
| Cash-on-Cash Return | 9.08% | 5.14% |
| Cap Rate (NOI/Price) | 6.5% | 5.7% |
Hands down, the Starter Duplex is the winner on both cash flow and returns. This is mostly thanks to more favorable financing and the higher gross income from having two rental units.
This is exactly the kind of apples-to-apples comparison that forms the foundation of a solid real estate investment property analysis, helping you see beyond just the purchase price.
Reading the Tea Leaves: Interpreting Your Results and Avoiding Common Traps
Getting a number from an investment property ROI calculator is the easy part. The real skill is knowing what that number actually means and spotting the dangerous assumptions hiding just beneath the surface.
A calculated 10% Cash-on-Cash return looks fantastic on screen, but it’s completely worthless if it's built on a foundation of wishful thinking. This is where you graduate from being a number-cruncher to a strategic investor—by learning to question the output, stress-test your numbers, and sidestep the pitfalls that trip up so many beginners.
What Makes a "Good" ROI, Anyway?
One of the first questions every new investor asks is, "What's a good ROI?" While a lot of people throw around a Cash-on-Cash return between 8% and 12% as a benchmark, there’s no single magic number. The right answer depends entirely on your market, your strategy, and your personal tolerance for risk.
High-Cost Coastal Markets: In places like California or New York, properties are expensive and finding strong positive cash flow can be tough. Investors here might be perfectly happy with a lower initial cash-on-cash return, maybe in the 3-5% range, because they're betting on significant long-term appreciation to build wealth.
Midwest Cash Flow Markets: On the flip side, many cities in the Midwest offer lower property prices and much higher rental yields. An investor in this market might not even look twice at a deal unless it projects a 10% or higher cash-on-cash return right out of the gate.
The key is context. A "good" return is one that hits your financial goals and stacks up well against other investment opportunities you could pursue in that same market.
The Pitfalls That Can Wreck Your Numbers
An overly optimistic calculation is far more dangerous than no calculation at all because it gives you a false sense of security. I've seen it time and again—new investors consistently fall into the same traps that can turn a "sure thing" into a financial nightmare.
1. Underestimating Capital Expenditures (CapEx)
This is the number one dream killer, bar none. Your monthly repair budget might cover a leaky faucet, but it won't even make a dent in a $15,000 roof replacement or a $10,000 HVAC system. If you don't set aside a separate CapEx fund (a good rule of thumb is 5-10% of gross rent), a single major failure can wipe out years of profit.
2. Banking on Unrealistic Rent Growth
Never, ever assume rents will just magically climb 5% every year. You need to base your projections on historical averages for your specific neighborhood, not just broad national trends. It's always smarter to project flat rents and be pleasantly surprised than to count on growth that never shows up.
3. Ignoring Realistic Vacancy Rates
Your property will not be occupied 365 days a year, every single year. It just won't. A conservative vacancy estimate of 5-8% is a standard starting point. In some student-heavy or seasonal markets, it could be much higher. Ignoring this simple fact is a direct path to overstating your income and getting yourself into trouble.
A critical part of due diligence is turning a simple calculation into a robust risk assessment. Ask the tough questions: What happens to my cash flow if my mortgage rate jumps 1% at renewal? What if a major employer leaves town and my vacancy rate shoots up to 15% for a year? If your deal only works in a perfect-world scenario, it's not a good deal.
Putting Your Returns into Market Context
Understanding what's happening in the broader market helps keep your expectations grounded in reality. As of Q4 2025, average gross rental yields in the United States were 6.56% across a sample of major cities, a slight tick up from 6.51% in Q3 2025.
So, what does that mean? A $300,000 property earning a typical U.S. gross yield would bring in about $19,680 in annual rent before any expenses. An ROI calculator is the tool that then layers on all the real-world costs—taxes, insurance, maintenance, vacancies, and financing—to turn that gross 6.5%–6.6% yield into the numbers that actually matter: net operating income, cap rate, and your final cash-on-cash return.
You can discover more insights about these national rental yield trends to see how your target property compares.
Moving From Manual Spreadsheets to Automated Analysis
Running the numbers on a single property feels empowering, doesn't it? But trying to do that for dozens of potential deals is a fast track to burnout and costly mistakes. This is exactly where technology gives smart investors a serious edge, turning a soul-crushing chore into a strategic weapon.
The jump from a basic spreadsheet to a dedicated investment platform is about more than just saving time. It’s about making better, faster, and more confident decisions. The cracks in a manual approach start to show when you’re under pressure, trying to compare multiple properties at once.
The Pitfalls of Manual Property Analysis
Let's be honest, relying on spreadsheets creates some major headaches that slow you down and open you up to risk. It’s a system that just doesn't scale as your portfolio grows.
I've seen these pain points trip up investors time and again:
- Endless Data Entry: Manually digging up property tax records, chasing insurance quotes, and researching rental comps for every single property is a massive time-suck.
- The High Cost of Human Error: One misplaced decimal or a busted formula in a spreadsheet can torpedo your entire analysis. You could end up passing on a gem or, worse, buying a dud.
- Clunky Scenario Modeling: Want to see how a 15-year mortgage stacks up against a 30-year loan? Or how a bigger down payment impacts your cash-on-cash return? Trying to model this in a spreadsheet is clunky, inefficient, and prone to errors.
These challenges are precisely why dedicated platforms were created. They automate the grunt work, letting you focus on the big-picture strategy. Think of it as the natural evolution of the basic investment property roi calculator.
Manually analyzing one property can easily take a few hours. A good platform can run the numbers on dozens in that same time, giving you a huge advantage in a competitive market.
How Automation Creates a Decisive Advantage
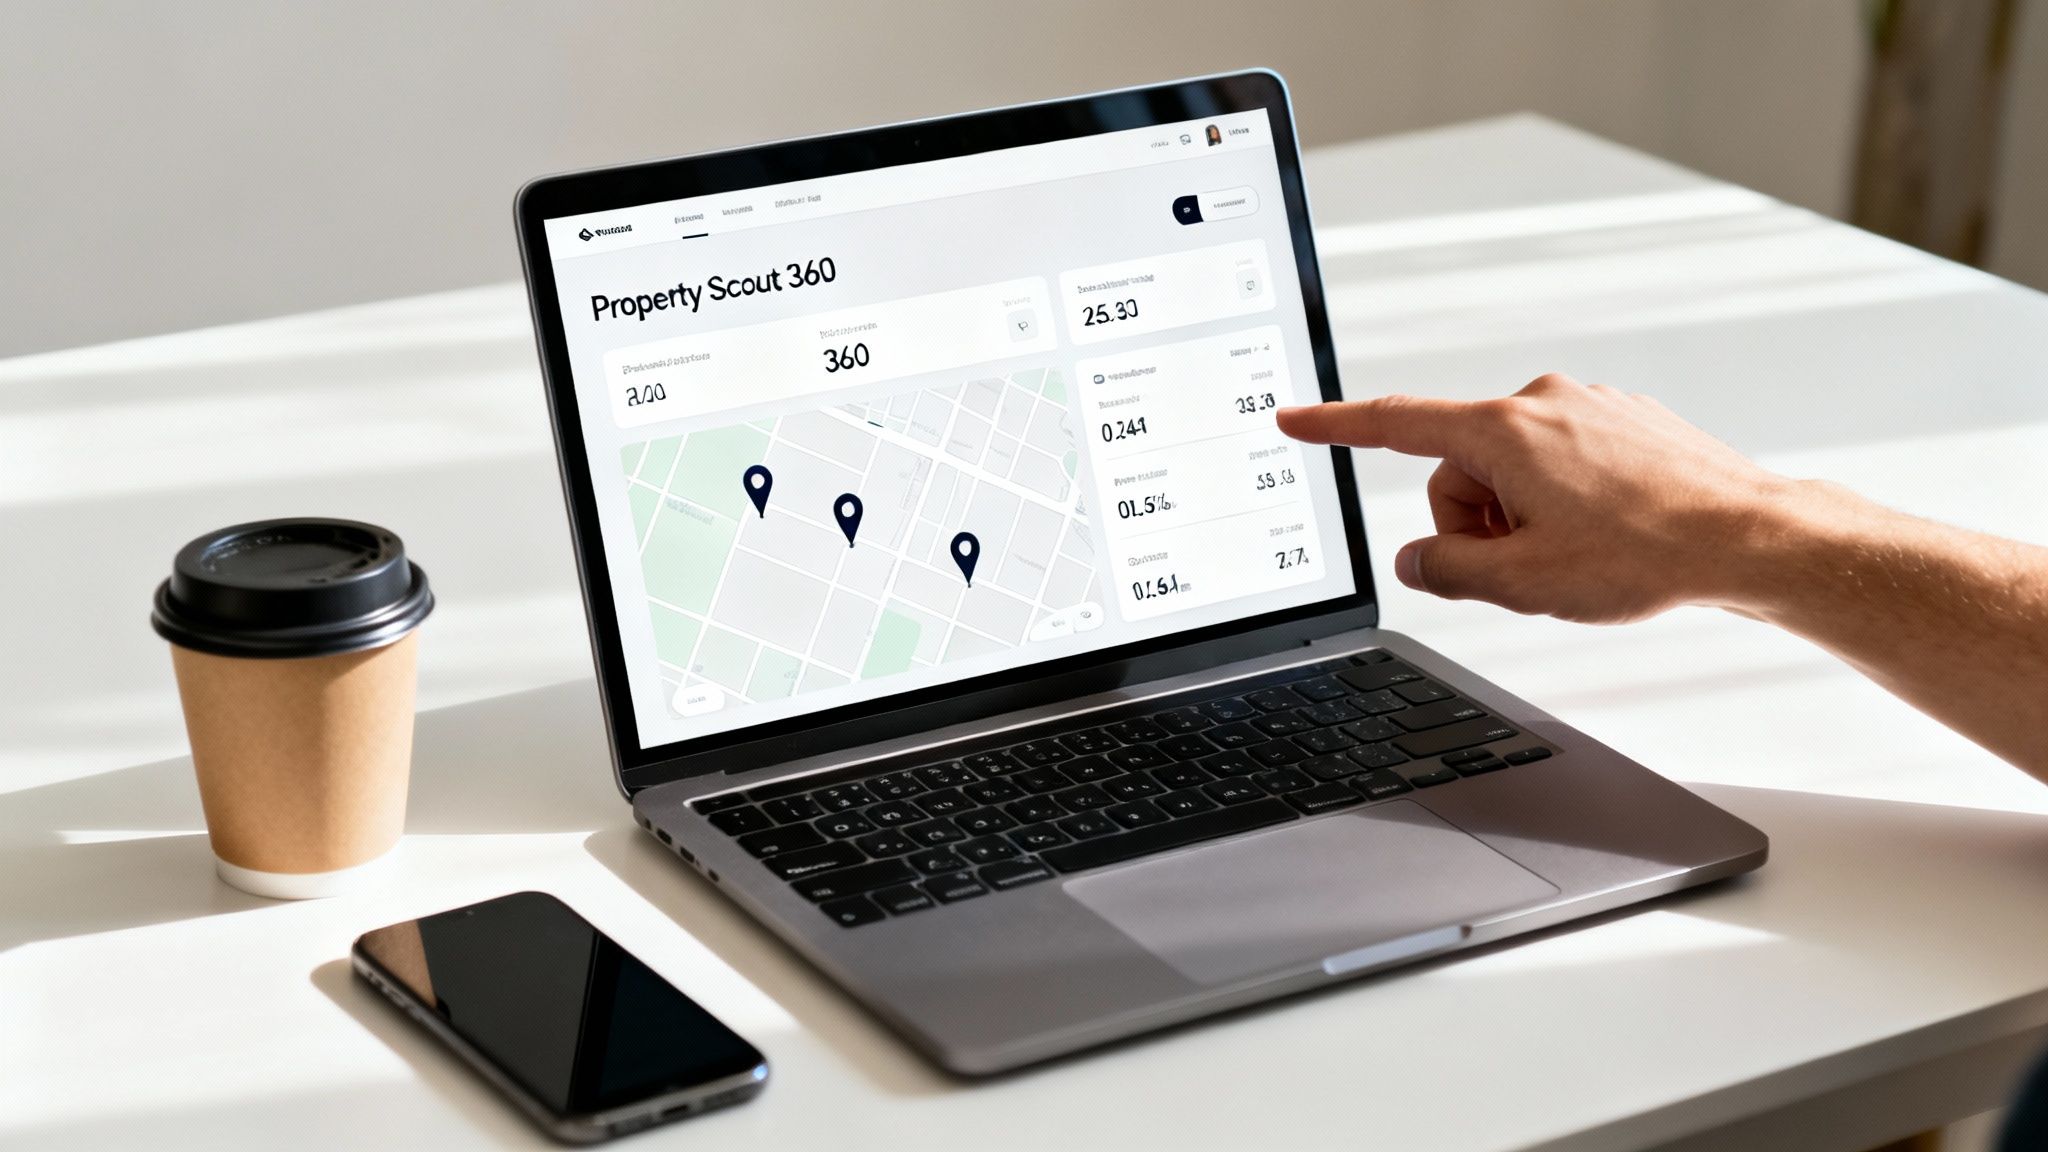
This is where a tool like Property Scout 360 changes the game. It’s built as a complete investment engine, not just a calculator. It takes over the entire analytical process by pulling in real-time data from countless sources.
Instead of you spending hours hunting for information, the platform does the heavy lifting for you.
It automatically populates your analysis with:
- Live MLS data from over 800 regions.
- Accurate property tax records for spot-on expense forecasting.
- Localized insurance estimates based on the property’s actual location.
- Current market rent comparables to ensure your income projections are realistic.
This immediate access to verified data takes the guesswork out of the equation and hands you back hours of your life. It’s the difference between working in your business and working on it. With the right tools, you can spend your time making decisions, not digging for data.
Beyond Basic Math to Comprehensive Analysis
A truly powerful tool does more than just spit out an ROI number. Property Scout 360 is designed to give you a complete financial picture, helping you model a property’s performance over its entire lifecycle.
You can instantly model different financing scenarios, comparing a 20% down payment versus 25% down side-by-side to see the immediate impact on cash flow and returns. The platform also generates detailed 30-year ROI projections that factor in appreciation, loan paydown, and cumulative cash flow, showing you the real long-term wealth-building power of a deal.
To learn more about how different tools can help, check out our guide to the best real estate investment software on the market.
The detailed expense breakdowns are another game-changer. They provide granular estimates for everything from property management fees to capital expenditure reserves for big-ticket items like a new roof or HVAC system. This is the kind of detail that helps you avoid the nasty surprises that can eat away at your profits down the road.
Ultimately, graduating from a spreadsheet to an automated platform isn't just about convenience. It’s about using technology to make smarter, data-driven decisions, minimize your risk, and find profitable deals before your competition does. It’s a fundamental shift in how you analyze real estate.
Answering Your Top ROI Calculator Questions
Even when you've got a great investment property ROI calculator, some questions just keep popping up. That's natural. Getting comfortable with the story behind the numbers is what separates a good investor from a great one. Let's dig into a few of the most common questions I hear and get you some straight answers.
What Is a Good ROI for a Rental Property?
Ah, the million-dollar question. The honest answer? It completely depends on your market and your goals.
While there's no magic number, many experienced investors I know won't look twice at a deal unless it projects a Cash-on-Cash Return between 8% and 12%. That range usually signals a property that generates solid cash flow without taking on a crazy amount of risk.
But your strategy is everything. If you're buying in a high-growth area like Austin, you might be okay with a lower initial cash flow because you're banking on appreciation to boost your total return down the road. On the other hand, if you're investing in a steady, cash-flow-focused market in the Midwest, you might skip any property that doesn't promise a double-digit cash-on-cash return right out of the gate.
The best thing you can do is stop chasing a generic number and start looking at local benchmarks. A truly "good" ROI is one that hits your personal financial targets and beats other similar deals available in your target area right now.
How Does Leverage Affect My ROI?
Getting a mortgage—or using leverage, as we call it in the industry—is one of the most powerful wealth-building tools in real estate. It's how you can control a very expensive asset with a relatively small chunk of your own capital, and it can seriously juice your returns.
This is exactly why Cash-on-Cash Return is my go-to metric. By using a loan, your actual out-of-pocket investment is just the down payment and closing costs, which makes that "cash" part of the equation much smaller.
Think about it this way: a property that brings in $6,000 a year in cash flow on a $50,000 down payment gives you a fantastic 12% cash-on-cash return. If you bought that same $250,000 house with all cash, that same $6,000 profit is only a 2.4% return. Big difference, right?
Of course, leverage isn't a free lunch. That mortgage payment eats into your monthly cash flow and raises your break-even point. This is where an ROI calculator becomes your best friend—it lets you model different loan terms and down payments to see exactly how they affect both your potential profit and your risk.
Can I Trust the Estimates from Online Calculators?
You can trust the math, but you have to be skeptical of the inputs. The formulas for ROI, cap rate, and cash flow are just math—they don't change. What does change is the quality of the data you plug into them.
A lot of the free, generic calculators out there pull in automated numbers for things like property taxes, insurance, and even rent. The problem is, this data can be old or just plain wrong for the specific property you're looking at. A calculator that projects a great ROI based on last year's tax bill is setting you up for a nasty surprise.
Here’s my advice: always treat an online calculator as a starting point, not the final word. Your analysis is only as good as your due diligence. You have to verify the big numbers yourself.
- Confirm Property Taxes: Go directly to the county assessor's website. It’s public information.
- Get Insurance Quotes: Make a quick call to an insurance agent and ask for a real quote on a landlord policy.
- Verify Market Rent: Don't trust a single estimate. Check Zillow, Rentometer, and local listings for what truly comparable units are renting for today.
A trustworthy calculator is one that lets you override every single automated field with your own, verified numbers. That’s how you build an analysis based on reality, not wishful thinking.
Stop wasting time with flawed spreadsheets and outdated data. The Property Scout 360 platform automates your entire analysis, pulling in real-time market data to deliver accurate ROI projections in seconds. Find and analyze profitable deals faster by visiting Property Scout 360.
About the Author
Related Articles
2026 Investor's Guide: Cost of Installing a Sewer Clean Out
Understand the cost of installing a sewer clean out for investment properties in 2026. Get expert advice on prices, ROI, & budgeting for flips. Plan smart!
15 Year vs 30 Year Mortgage: The Investor's Choice
Deciding between a 15 year vs 30 year mortgage for a rental property? Our guide analyzes cash flow, ROI, and equity to help you pick the best loan.
Real Estate Appraisal Software: Features & Limits
Discover what real estate appraisal software is, its core features, and limits. See how it differs from investment tools for profitable deals.