Unlocking Property Profits Your Guide to Real Estate Investment Analysis
Master real estate investment analysis. This guide demystifies key metrics like cap rate and cash flow to help you evaluate properties and build wealth.
Investing in real estate without running the numbers is like trying to navigate a new city without a map. Sure, you might get lucky, but you're more likely to get lost. Real estate investment analysis is that map—it’s the crucial process of evaluating a property's potential to make money and identifying the financial risks before you sign on the dotted line.
It's all about making data-driven decisions instead of emotional ones.
What Is Real Estate Investment Analysis Really

Think of investment analysis as your strategic blueprint for building wealth. It’s not just some tedious financial chore; it's the pre-flight check every savvy investor performs to avoid nasty surprises down the road.
This systematic approach forecasts a property's financial performance, painting a clear picture of its potential. Ultimately, it answers the one question that matters most: "Is this a good deal?"
Moving Beyond Guesswork
Without a proper analysis, you're essentially gambling. It’s easy to get swept up by a property’s great curb appeal or a seller's persuasive pitch, only to find out later that the numbers just don't add up. A thorough real estate investment analysis takes the guesswork out of the equation.
It forces you to see the property for what it is: a business. You have to consider every potential source of income and, just as critically, every possible expense. This disciplined mindset is what separates successful long-term investors from speculators chasing a quick buck. The real goal is to build a predictable, reliable stream of income.
This is more important than ever in the current market. Global private real estate has shown incredible resilience, with values climbing for five straight quarters heading into Q4 2025. In major markets, transaction volumes have also surged, reaching $739 billion over the last 12 months—a hefty 19% jump from the previous year. To ride that wave, you need a sharp analytical edge.
Real estate investment analysis is less about predicting the future and more about preparing for it. It's about understanding the range of possible outcomes so you can build a resilient portfolio that thrives in any economic climate.
The Foundation of Confident Decisions
A solid analysis gives you more than a simple "yes" or "no." It arms you with the knowledge to negotiate from a position of strength, secure better financing, and manage your property for the best possible returns. The core of this process breaks down into a few key areas:
- Financial Forecasting: This involves projecting future rental income, accounting for potential vacancies, and estimating all your operating expenses.
- Metric Calculation: Here, you run the numbers to find key performance indicators (KPIs) like cap rate, cash flow, and return on investment (ROI).
- Risk Assessment: This means identifying potential pitfalls, like a sudden need for a new roof or a downturn in the local rental market.
To see just how far this discipline has come, it's worth exploring the role of Business Intelligence in Real Estate, where modern tools are completely changing the game. Platforms like Property Scout 360 automate these complex calculations, transforming what used to be hours of spreadsheet headaches into confident, data-backed decisions in minutes.
The Core Metrics That Drive Smart Investments
To do a proper real estate investment analysis, you need to speak the language of numbers. These core metrics are the vital signs that tell you the true financial health of a property. They move you beyond a gut feeling to a deep, factual understanding of its potential.
Think of them as different tools in your toolbox. Each one reveals a unique part of the investment story. Mastering these figures is what separates hoping for a good deal from knowing you’ve found one.
Gauging a Property’s Pure Profitability with NOI
Before you can figure out what a property can do for you, you have to know what it earns on its own. That’s where Net Operating Income (NOI) comes in. Think of NOI as the property's annual salary—it's the total income it generates after paying all the bills necessary to keep it running, but before you factor in your mortgage or income taxes.
NOI gives you the cleanest possible look at a property's inherent profitability. It’s a pure metric, untainted by your specific financing, which lets you judge the asset on its own merits.
To get it, you just take your Gross Operating Income (rent plus any other income, like laundry fees) and subtract the Operating Expenses (property taxes, insurance, maintenance, management fees). What's left is the NOI, and it’s the foundation for almost every other calculation you’ll do.
Is It a Good Deal for the Price? The Cap Rate
Once you have the NOI, you can calculate the Capitalization Rate, or Cap Rate. The best analogy for a cap rate is a car's miles-per-gallon rating. Just like MPG tells you how efficient a car is with fuel, the cap rate tells you how efficient a property is at generating income relative to its price.
You calculate it by dividing the NOI by the property's purchase price. Generally, a higher cap rate suggests a better return for the price you’re paying. This simple percentage is one of the fastest ways to see if a property is priced fairly for its market. For a deeper dive, check out our guide on what is a cap rate in our detailed guide.
But be careful—a "good" cap rate isn't universal. A 6% cap rate might be fantastic in a stable, high-demand city like San Diego, but it could be considered quite low in a smaller, up-and-coming market in the Midwest. Context is everything.
What Actually Hits Your Bank Account: Cash Flow
While NOI shows a property's potential, Cash Flow is what's real. It’s the money left in your pocket each month after all the bills are paid, and that absolutely includes your mortgage. This is the number that really determines if an investment is helping or hurting your personal finances.
Positive cash flow means the property is putting money into your bank account. Negative cash flow means you're feeding it money just to keep it afloat. For most of us investing for the long haul, steady positive cash flow is the name of the game.
The math is simple:
Cash Flow = Net Operating Income (NOI) - Debt Service (Your Mortgage Payments)
This is the lifeblood of your investment. It’s what covers surprise repairs, funds your next deal, and ultimately, builds your wealth. When looking at potential profit, understanding the Return on Investment (ROI) becomes crucial for any improvements you plan to make.
Measuring Your Down Payment’s Power: Cash-on-Cash Return
Last but not least, we have the Cash-on-Cash Return. This is arguably the most important metric for any investor who uses a loan to buy property. It answers the single most important question: "For every dollar I put in out of my own pocket, how much am I getting back each year?"
It specifically measures your annual pre-tax cash flow against the total cash you had to bring to the table. That includes your down payment, all your closing costs, and any money you spent on initial repairs to get it rent-ready.
- Formula: Annual Pre-Tax Cash Flow / Total Cash Invested
- Example: If your annual cash flow is $4,000 and your total out-of-pocket investment was $40,000, your Cash-on-Cash Return is a solid 10%.
This metric powerfully shows the magic of financing. By using the bank's money, you can achieve a much higher return on your own capital than if you had to pay all cash.
Key Real Estate Investment Metrics at a Glance
Navigating these numbers can feel like a lot at first. This table is a quick cheat sheet to help you keep these core metrics straight as you analyze potential deals.
| Metric | Simple Formula | What It Measures |
|---|---|---|
| Net Operating Income (NOI) | Gross Income - Operating Expenses | The property's pure profitability, before debt. |
| Capitalization Rate (Cap Rate) | NOI / Property Price | The rate of return based on the property's income and price. |
| Cash Flow | NOI - Debt Service (Mortgage) | The actual profit that ends up in your pocket. |
| Cash-on-Cash Return | Annual Cash Flow / Total Cash Invested | The return on your actual out-of-pocket investment. |
Think of this as your dashboard. Each metric gives you a different reading, and together, they provide a complete picture of a property's financial health, helping you make a confident, informed decision.
Automating these calculations is the key to analyzing deals quickly and accurately. A platform like Property Scout 360 instantly crunches these numbers for any U.S. property. Instead of getting bogged down in a spreadsheet, you get a simple dashboard that lays out the NOI, cap rate, projected cash flow, and cash-on-cash return. It empowers you to evaluate dozens of deals in the time it would normally take to analyze just one.
A Practical Workflow for Evaluating Any Property
Knowing the metrics is one thing, but applying them consistently is what separates successful investors from the rest. The key is having a repeatable workflow that prevents you from missing crucial details and lets you evaluate properties quickly and accurately. This isn't just theory—it's the battle-tested framework for turning a "For Sale" sign into a smart investment.
Think of this process as a series of filters. Each step weeds out the properties that don't make sense, so you only spend your valuable time on the ones with real potential.
The chart below gives you a bird's-eye view of how the money flows—from the rent you collect down to the profit that actually lands in your pocket.
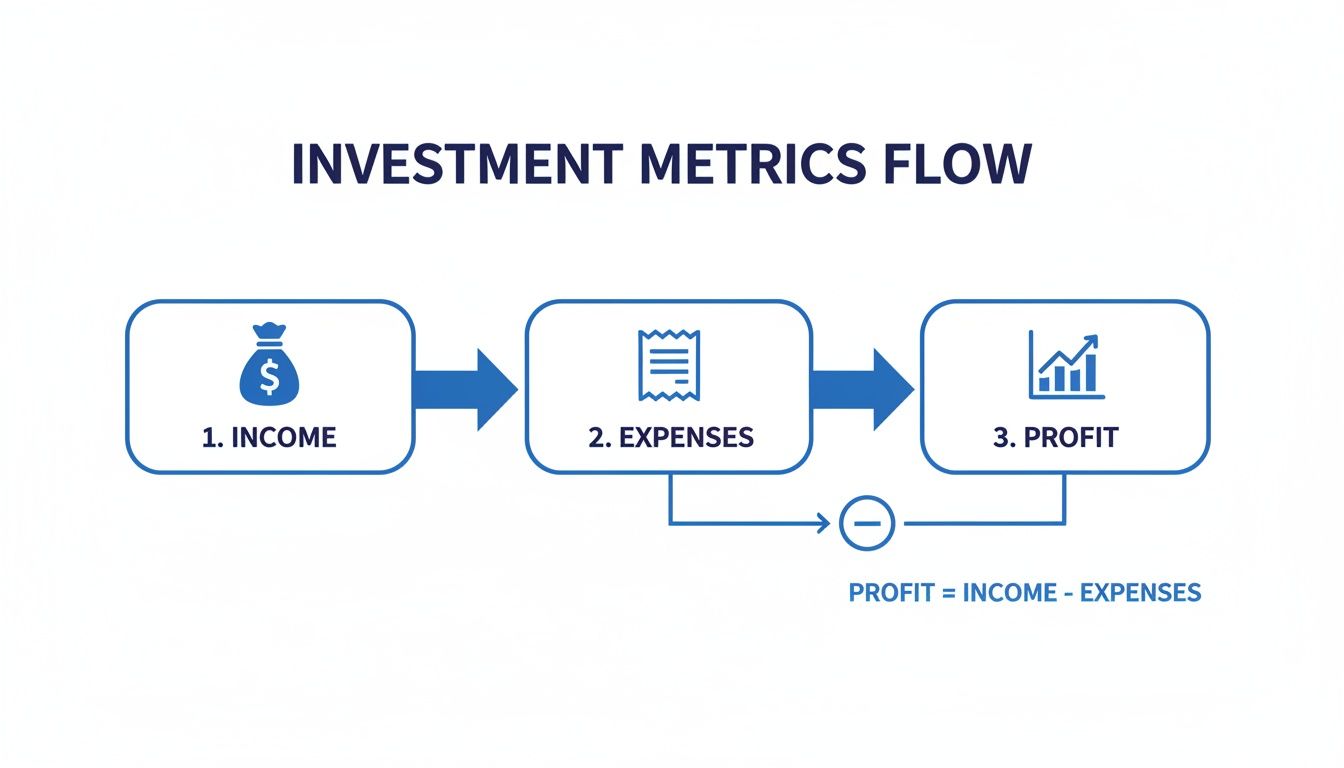
Ultimately, your profit is just what's left after every single cost has been paid. That’s why you have to be meticulous about tracking both sides of the equation.
Step 1: The Initial Deal Screen
The first step is a quick "back-of-the-napkin" test to see if a property is even worth a second look. You’re not building a massive spreadsheet here; you’re just looking for obvious red flags. A classic tool for this is the 1% Rule. It’s a simple guideline: the gross monthly rent should be at least 1% of the purchase price.
For example, a $250,000 property should bring in at least $2,500 per month in rent. If the listing says it only rents for $1,500, it’s a strong signal that it won't have enough income to cover its own bills, let alone generate positive cash flow. It’s not a hard-and-fast rule, but it’s an incredibly effective first filter.
Step 2: Gather Your Essential Data
If a property clears that initial hurdle, it’s time to roll up your sleeves and gather the real numbers. This is where the serious research begins, because the quality of your analysis is only as good as the data you feed into it. You’ll need to collect info for two main categories.
Income Data:
- Current and Market Rents: Find out what tenants are paying now. But more importantly, what could you be charging? Check comps to find the true market rent for similar units.
- Other Income: Don't forget other potential revenue streams. Is there coin-op laundry, paid parking spots, or storage fees? Every dollar counts.
Expense Data:
- Property Taxes: Never trust the seller's old tax bill. Head straight to the local assessor’s website to get the most current figures, as a sale will often trigger a reassessment.
- Insurance: Call your insurance agent and get a real quote for a landlord policy on that specific property. Estimates won't cut it.
- Utilities: Figure out which utilities are the owner's responsibility and which fall to the tenants. This can make or break a deal.
- Maintenance & Repairs: A solid rule of thumb is to budget 1-2% of the property's value annually for things that will inevitably break.
- Capital Expenditures (CapEx): This is for the big stuff—a new roof in 5 years, an HVAC system in 10. Set aside 5-10% of the gross rent to build a fund for these big-ticket items.
- Property Management Fees: Planning to manage it yourself? Great! Still, factor in an 8-12% management fee. This ensures the deal still works if you ever decide to hire a pro, protecting your investment's future.
Step 3: Run the Core Numbers
With all your data collected, you can finally run the numbers that matter: NOI, Cap Rate, Cash Flow, and Cash-on-Cash Return. This is the moment of truth, where the property’s financial story comes into focus, free from any sales hype or emotion.
This is where your raw data transforms into real insight. You’ll see clearly whether you’re looking at a cash-flowing machine or a future money pit.
This is exactly where modern tools can give you a huge advantage. Instead of wrestling with formulas in a spreadsheet, a platform like Property Scout 360 instantly takes your inputs and generates a complete financial analysis. This automation frees you up to focus on what matters most—interpreting the results and making a great decision. To see how to build one yourself, check out our guide to creating a real estate investment analysis spreadsheet.
By sticking to this structured workflow for every single property, you build the discipline and confidence you need to make sound, data-driven investment decisions again and again.
Mastering 'What If' Scenarios for Smarter Decisions
A static analysis of a property gives you a snapshot in time. But here's the thing: great investors know the real world is constantly in motion. Your real estate investment analysis needs to be dynamic, helping you prepare for what’s ahead instead of just reacting to it. This is where 'what if' scenarios transform your approach from basic math to genuine strategic planning.This process is called sensitivity analysis, and it’s basically a financial fire drill for your property. It’s all about asking tough questions to see how your investment holds up under pressure. What happens if that perfect tenant leaves and the property sits empty for two months? What if property taxes jump by 10% after a reassessment? These aren't just far-fetched hypotheticals; they're the real-world curveballs that can make or break your returns.
When you stress-test your assumptions, you build a financial model that's resilient, not fragile. You get to move beyond the sunny, best-case scenario and prepare a strategy that can withstand the inevitable bumps in the road.
Exploring Your Financing Options
One of the most powerful 'what if' scenarios you can run revolves around your financing. The loan you choose has a massive impact on everything—your monthly cash flow, how fast you build equity, and your overall long-term wealth. Simply taking the first loan you're offered without modeling other options is one of the most common and costly mistakes you can make.
Think about the classic debate: a 30-year loan versus a 15-year loan.
- The 30-Year Loan: This route gives you a much lower monthly payment. That means more immediate cash flow, which acts as a safety buffer for surprise expenses and can make it easier to qualify for the loan in the first place.
- The 15-Year Loan: Your monthly payment will be significantly higher here, shrinking your immediate cash flow. But the upside is huge: you pay off the loan in half the time, build equity like crazy, and save an enormous amount in total interest payments.
There’s no single “right” answer. It all comes down to your goals. An investor laser-focused on maximizing monthly income will probably lean toward the 30-year option. But someone who prioritizes becoming debt-free and building wealth fast might go for the 15-year path.
Running both scenarios through a real estate investment analysis tool lays out the trade-offs in black and white. You can see the exact difference in monthly cash flow and total interest paid, empowering you to make a decision that truly aligns with your personal financial strategy.
Stress-Testing Your Key Assumptions
Beyond just the loan, a solid analysis must poke and prod at the key variables that drive your profitability. These are the numbers you initially estimated, but trust me, they can and will change. Tweaking them in your model reveals your property's vulnerabilities and its hidden strengths.
Here are some of the most critical variables to test:
- Vacancy Rate: Your initial math might assume a 5% vacancy rate (about 18 days a year). What happens to your cash flow if that jumps to 8% or even 10% because of a slow-down in the local economy?
- Maintenance and Repairs: What if a major appliance gives out or you discover a surprise plumbing issue? Bumping your repair budget from 5% to 10% of the gross rent for a year will show you if you have enough of a cushion to handle it.
- Rent Growth: Projecting a 3% annual rent increase looks great on paper. But what if rents stay flat for two years? Testing this assumption makes sure your investment works today, not just in a perfect future.
This process helps you pinpoint a property’s break-even point and truly understand your margin of safety. Savvy investors even look at macro trends for ideas. For instance, data from PWC shows data centers are a top global investment prospect for 2025, thanks to the AI boom. This is fueling high-yield opportunities in related infrastructure and creating demand for residential rentals near these new tech hubs. You can read more about these global real estate trends on PWC.com.
This is where a modern real estate investment calculator becomes indispensable. Platforms like Property Scout 360 are built for this kind of dynamic analysis. Instead of manually re-calculating a dozen cells in a spreadsheet, you can use simple sliders to adjust variables like vacancy, repairs, or property taxes. The platform instantly recalculates every single metric—from cash flow to ROI—showing you the real-time impact of each change. This lets you explore dozens of potential futures in minutes, giving you true confidence in your investment decision.
Common Analysis Pitfalls and How to Sidestep Them
Learning from someone else's expensive mistake is the cheapest education you can get in real estate. A solid real estate investment analysis is your best line of defense, but even pros can stumble into common traps that turn a great-looking deal into a money pit. Knowing what these pitfalls look like is the first step to confidently walking right past them.
The path to a successful investment is full of potential wrong turns. By seeing where others have slipped up, you can build a smarter, more resilient portfolio from your very first property. Let's break down the most common mistakes and how to build a better strategy.
Underestimating Your True Expenses
One of the quickest ways to kill your returns is to wear rose-colored glasses when you look at expenses. It's easy to focus on the big, predictable costs like the mortgage, taxes, and insurance. The real trouble comes from the smaller, less obvious costs that inevitably pop up.
Many new investors completely overlook budgeting for the big-ticket replacements, what we call Capital Expenditures (CapEx). These are the major components that don't need replacing every year, but when they fail, they fail big. A new roof can easily run you $15,000, and a new HVAC system could be another $8,000. If you haven’t been setting money aside for these certainties, a single repair can wipe out your cash flow for years.
Here's a simple, systematic way to stay ahead of the game:
- Maintenance: Plan on setting aside 1-2% of the property’s value every year for routine upkeep and small repairs.
- CapEx: Earmark an additional 5-10% of your gross rental income specifically for a fund to cover those major replacements.
- Property Management: Even if you plan to manage the property yourself, run your numbers as if you were paying an 8-12% management fee. This forces the deal to stand on its own two feet and ensures it still works if you ever decide to hire a pro.
Falling for Overly Optimistic Projections
Hope is not a business plan. Another classic mistake is getting swept up in overly optimistic projections about a property's income and future value. Sellers and their agents are paid to paint a rosy picture; it's your job to bring those numbers back down to earth.
This optimism often leads to underestimating vacancy. No property stays rented 100% of the time. Tenants move on, and you need time to turn the unit over—cleaning, making repairs, and finding the next great renter. A truly conservative analysis should always factor in a vacancy allowance of at least 5-8% of the gross rent.
Just as dangerous are aggressive guesses about appreciation. While real estate values have historically trended upward, you should never, ever bank on it. A good deal works today based on its cash flow, not on some hypothetical future sale price. This is especially critical in markets that feel a bit frothy. For instance, recent reports like the UBS Global Real Estate Bubble Index flag certain cities for being overvalued, reminding us to tread carefully.
The best real estate deals are built on conservative numbers. Your investment should be profitable based on its current performance, with any future appreciation being a welcome bonus, not a core requirement.
Getting Stuck in Analysis Paralysis
Then there's the other side of the coin: analysis paralysis. This is what happens when you're so buried in data and terrified of making a mistake that you never actually make a move. You run the numbers again and again, tweaking your spreadsheet for the hundredth time, waiting for that "perfect," risk-free deal.
Here's the truth: the perfect deal doesn't exist. Every single investment carries some degree of risk. The whole point of real estate investment analysis isn't to find a property with zero risk, but to understand the risks, measure them, and decide if the potential reward makes them worth taking.
This is exactly where a tool like Property Scout 360 can make all the difference. It gives you a standardized process, using detailed expense templates and conservative rent estimates to keep your projections grounded in reality. By automating the heavy lifting and laying out the key metrics clearly, it helps you cut through the noise and move from endless analysis to confident, decisive action.
Bringing It All Together: A Real-World Property Analysis
Theory is great, but the real confidence comes from seeing the numbers work on an actual deal. Let's walk through a practical case study to see how a professional real estate investment analysis goes from a simple property listing to a solid investment decision.
Imagine we’ve spotted a duplex for sale in a neighborhood with good growth potential. Duplexes are a classic starting point for investors because you get two income streams from a single property. Now, let’s apply our step-by-step process and see if this deal holds up.
Setting the Stage: The Property Details
First things first, we need to gather our inputs. This isn't about pulling numbers out of thin air; it’s about using the listing details, reliable market data, and a healthy dose of conservative estimation. Rushing this part is the fastest way to a bad investment, so getting these details right is everything.
Here’s the financial snapshot for our duplex:
- Purchase Price: $350,000
- Down Payment (25%): $87,500
- Closing Costs (3%): $10,500
- Total Cash Needed to Close: $98,000
- Gross Monthly Rent (2 units @ $1,500 each): $3,000
With our income figured out, we can now dig into the expenses—from taxes and insurance to setting aside cash for that inevitable roof replacement down the road.
Running the Numbers: The Moment of Truth
This is where the magic happens. We take our inputs and run them through the formulas to see if this property can truly stand on its own two feet and deliver a profit.
An investment property is a small business. Its success or failure is written in the numbers. This analysis is your first and most important board meeting.
Let's see what the outputs look like:
Annual Performance Breakdown:
- Gross Annual Income: $36,000
- Total Annual Expenses (Taxes, Insurance, Vacancy, Maintenance, etc.): $14,400
- Net Operating Income (NOI): $21,600
- Annual Mortgage Payments: $17,500
- Annual Cash Flow (NOI - Mortgage): $4,100
From here, we can calculate our key performance indicators:
- Cap Rate (NOI / Price): 6.17%
- Cash-on-Cash Return (Annual Cash Flow / Total Cash): 4.18%
The analysis shows the property does produce positive cash flow, but the 4.18% cash-on-cash return is on the lower side. Is it a good deal? That depends on your goals.
This entire process, which can take a good chunk of time with a spreadsheet, is where a tool like Property Scout 360 changes the game. It automates the whole thing in seconds—pulling property data, estimating rents, and spitting out a complete report. It turns a complex, manual task into an instant, clear-cut analysis, giving you the power to evaluate dozens of properties with the same level of depth and confidence.
Answering Your Top Questions About Real Estate Analysis
Even when you've got the basics down, you're bound to run into some specific questions when you're in the trenches analyzing a deal. Getting straight answers to these common questions can really solidify your understanding and give you the confidence to pull the trigger.
What’s a Good Cap Rate for a Rental Property?
This is one of the most common questions, and the honest answer is: it depends. There’s no magic number that works for every property in every market.
A "good" cap rate is all about context—the market, the property's condition, and your own appetite for risk. For a stable property in a hot, low-risk city, a cap rate of 4-5% might be fantastic. But if you're looking at a property in a smaller, more unpredictable market, you’d probably want to see 8-10% (or even higher) to make the extra risk worthwhile.
Just think of the cap rate as a quick gauge of risk versus reward. A low cap rate usually means a safer, more predictable investment. A high cap rate suggests a bigger potential payday, but it almost always comes with more risk attached.
How Much Should I Actually Budget for Maintenance and CapEx?
It's so easy to underestimate how much it costs to keep a property in good shape, and it's a mistake that can sink your returns. A good rule of thumb to start with is the 1% Rule for routine maintenance. This means you should plan on setting aside at least 1% of the property’s purchase price each year.
So, for a $300,000 house, you're looking at $3,000 a year, or $250 a month, just for the small stuff.
But that's just for routine upkeep. You also need a separate fund for Capital Expenditures (CapEx)—those big, expensive jobs like replacing the roof or the entire HVAC system. A smart move is to earmark another 5-10% of your gross rental income specifically for these inevitable big-ticket items.
Don't make the mistake of lumping maintenance and CapEx together or ignoring them entirely. Forgetting to budget for both is one of the quickest ways to watch a great investment turn into a financial nightmare. These aren't if expenses; they're when expenses.
Can I Use This Kind of Analysis for a BRRRR Deal?
Absolutely. In fact, a deep-dive analysis isn't just helpful for the BRRRR (Buy, Renovate, Rent, Refinance, Repeat) strategy—it's essential.
Your initial analysis is what validates the "Buy" phase, proving that the property is truly a good deal. Then, as you plan the "Renovate" stage, you'll need to run the numbers on the After Repair Value (ARV) to confirm your upgrades will create enough equity. That ARV calculation is make-or-break for the "Refinance" step, since that's the number your lender will use.
Every single stage of the BRRRR method hinges on running accurate numbers from start to finish.
Ready to stop guessing and start making data-driven decisions? Property Scout 360 automates every step of your real estate investment analysis, from calculating cash flow to modeling financing scenarios. Find your next profitable rental property in minutes.
About the Author
Related Articles
2026 Investor's Guide: Cost of Installing a Sewer Clean Out
Understand the cost of installing a sewer clean out for investment properties in 2026. Get expert advice on prices, ROI, & budgeting for flips. Plan smart!
15 Year vs 30 Year Mortgage: The Investor's Choice
Deciding between a 15 year vs 30 year mortgage for a rental property? Our guide analyzes cash flow, ROI, and equity to help you pick the best loan.
Real Estate Appraisal Software: Features & Limits
Discover what real estate appraisal software is, its core features, and limits. See how it differs from investment tools for profitable deals.