Build a Winning Rental Property Analyzer Spreadsheet
Create a powerful rental property analyzer spreadsheet to master cash flow, ROI, and investment scenarios. Get practical formulas and expert tips.
Before you ever think about buying a property, you need a way to figure out if it's a winner or a loser. That's where a rental property analyzer spreadsheet comes in. It's the tool that takes all the messy financial details of a potential deal and spits out a clear picture of its profitability. We're talking cash flow, return on investment, and all the key metrics that give you a straightforward go/no-go signal.
Honestly, building one from scratch is the single best way to really learn the nuts and bolts of real estate investing.
Why You Should Build Your Own Spreadsheet First
I know, I know. There are tons of templates and fancy software out there. But trust me on this—taking the time to build your own analyzer is a rite of passage for any serious investor. It's not just about plugging in numbers; it’s about forging an investor’s intuition.
When you're the one setting up the formulas and linking the cells, you get a gut-level feel for how everything connects. You see exactly how financing terms, operating costs, and rental income actually drive your bottom line. It transforms abstract ideas like Cap Rate and Cash-on-Cash Return from textbook terms into real, predictable tools you can use.

Developing Your Investor Instinct
There's no substitute for building the machine yourself if you want to understand how it works. You'll witness firsthand how a half-point jump in an interest rate sends ripples through your entire cash flow forecast. You'll see why a vacancy rate that seems insignificant can be the very thing that sinks a deal. This hands-on process forces you to question every single assumption you make.
This foundational knowledge is your ultimate advantage. You'll learn to spot a good deal—and a bad one—from a mile away, ensuring you're not just a passenger using an app but a pilot who truly understands the engine of your investment.
The Massive Opportunity in Today's Market
The rental market is absolutely on fire right now, largely because of a major housing shortage across the globe. Think about this: Over 80% of households in key developed economies are part of a global renting trend, and experts estimate we need 6.5 million more units just to keep up with current demand.
This affordability crunch has put rental properties squarely in the sights of smart investors. You can dive deeper into these global housing trends to see just how much the market is growing. An analyzer spreadsheet is your essential map for navigating this landscape.
Going through the manual process of building one prepares you to jump on these trends with real confidence. You'll stop guessing and start making decisions backed by solid financial modeling. It's the difference between hoping for a good investment and knowing you've found one—a skill that will pay dividends for your entire investing career, no matter what tools you use down the road.
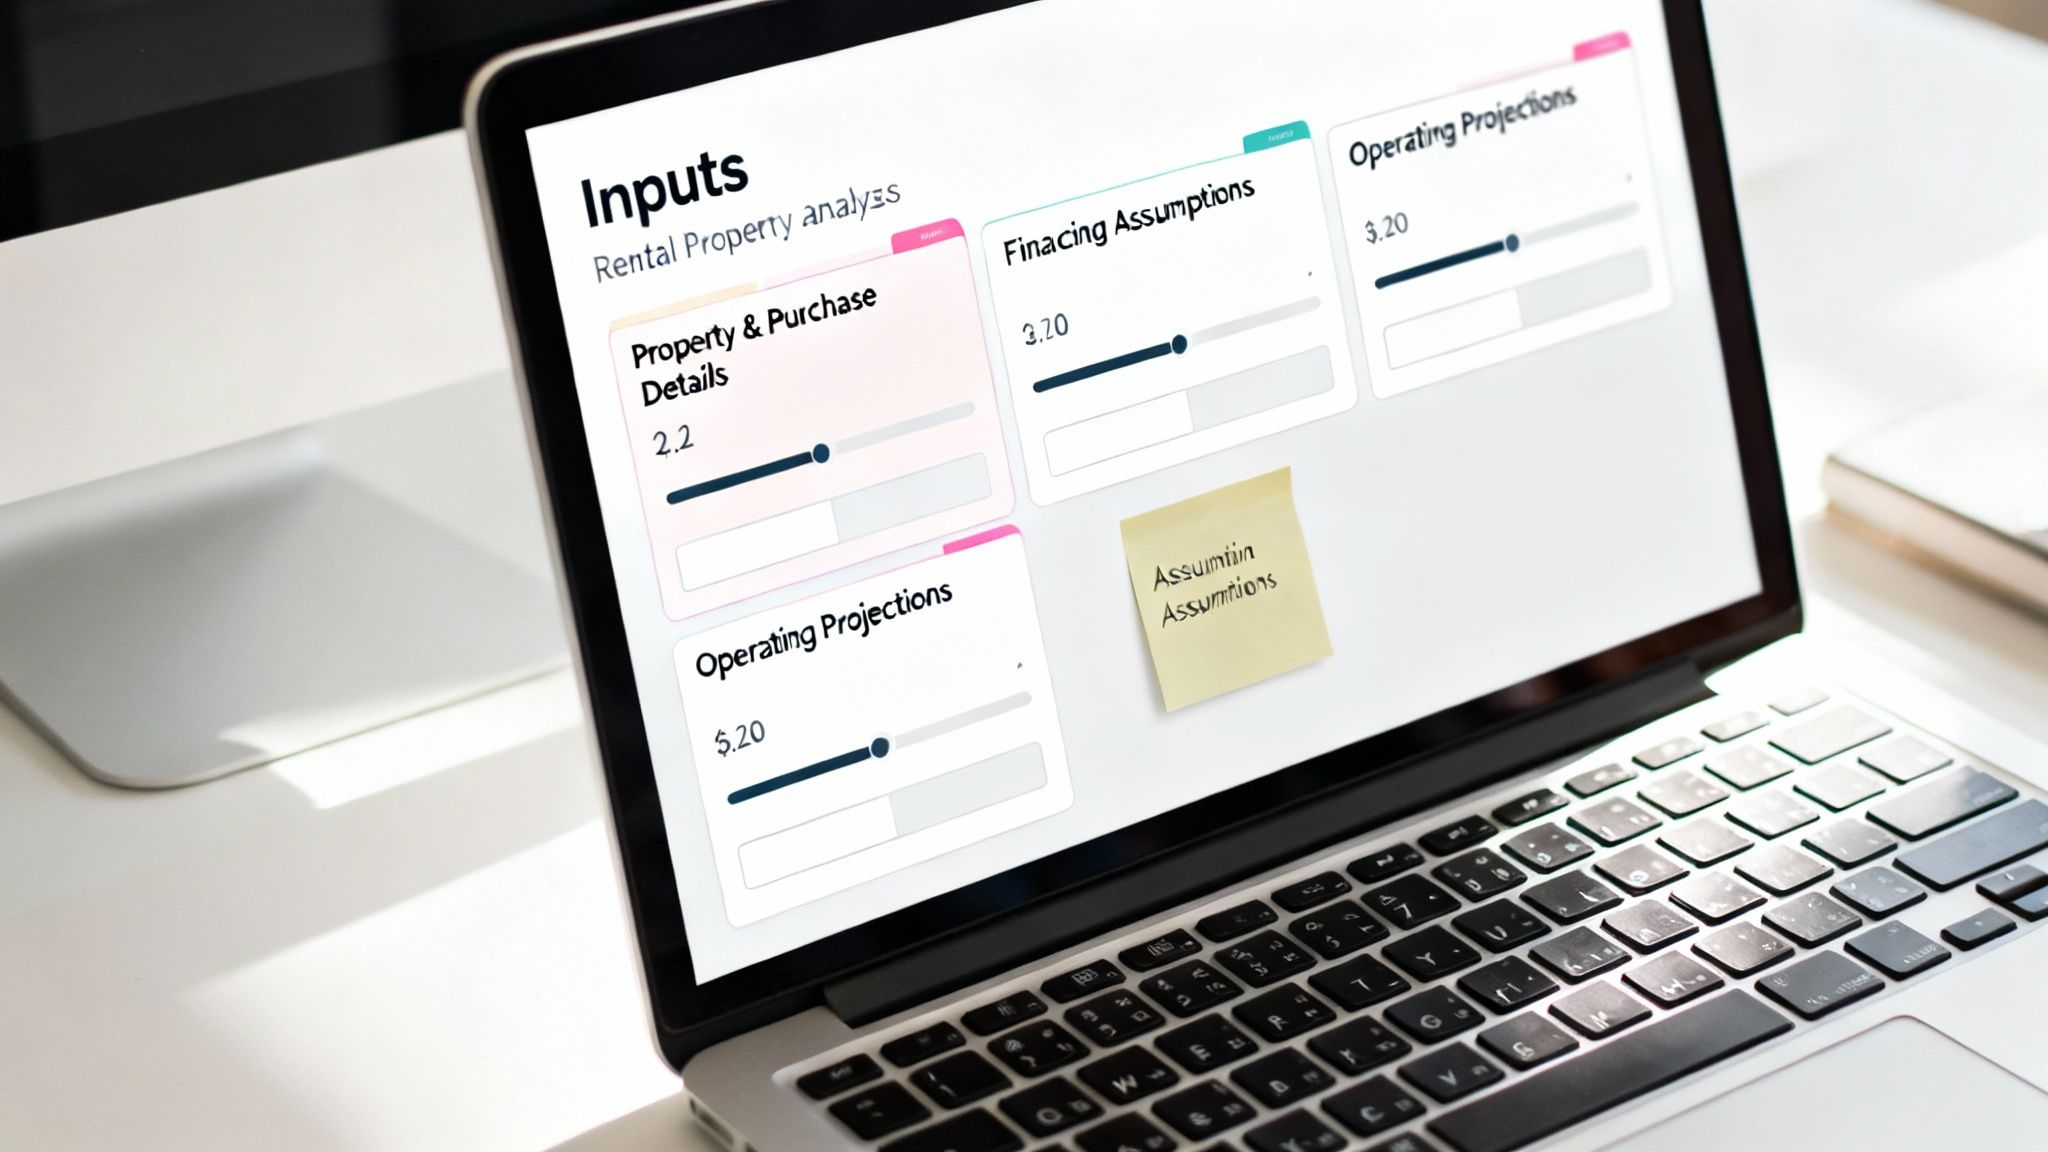
Building Your Spreadsheet's Input Dashboard
Think of this first sheet as the command center for your entire analysis. This is where you’ll plug in every variable, from the purchase price to your estimated repair budget. A well-organized input section is the secret to a powerful and flexible tool, letting you tweak assumptions and test scenarios without ever needing to touch a single formula.
Remember the old saying: garbage in, garbage out. The insights you get from this spreadsheet are only as good as the numbers you put into it. We’ll organize this dashboard into logical sections to make it intuitive and easy to update as you learn more about a potential deal.
Property and Purchase Details
First things first, let's get the core details of the property and the deal itself locked in. These are the foundational numbers that will drive everything else, from your loan amount to your closing costs. The more precise you are here, the better.
- Property Address: Give the deal a clear label. You'll thank yourself later when you're comparing multiple properties.
- Asking Price: This is the seller's list price—your starting point for all other calculations and, hopefully, negotiations.
- After Repair Value (ARV): What do you realistically think the property will be worth after you’ve completed all the planned renovations? This is your best estimate.
- Upfront Repair Budget: Be honest with yourself here. This is the total cash you'll need to get the property rent-ready. It's one of the easiest numbers to underestimate.
- Closing Costs: These fees typically run 2-5% of the purchase price and cover things like appraisals, title insurance, and loan origination. As a conservative starting point, I always plug in 3%.
Financing Assumptions
Now, let's nail down how you plan to finance the purchase. The details you enter here have a direct line to your monthly mortgage payment, which is one of the biggest factors impacting your cash flow. A small change in your interest rate or down payment can completely change the viability of a deal.
- Down Payment Percentage: How much of your own cash are you bringing to the table? For most conventional investment loans, this will be 20% or 25%.
- Loan Interest Rate: Don’t just guess. Talk to a lender and get a pre-approval so you're working with a real-world number.
- Loan Term (in Years): This is simply the length of your mortgage. The standard for investment properties is 30 years, but you might also consider a 15-year term.
Pro Tip: By keeping these inputs separate, you create a powerful what-if machine. Instantly see how a higher down payment boosts your cash flow or how a half-point increase in interest rates affects your long-term returns. This is where a spreadsheet really shines.
Operating Income and Expenses
This section is where the rubber meets the road. It’s a projection of the property’s day-to-day financial performance, and it’s also where new investors make their biggest mistakes—almost always by underestimating expenses. Be realistic, even a little pessimistic.
First, let's project the income side of the equation.
- Gross Monthly Rent: What can you realistically charge for rent? Do your homework by checking comps on Zillow or Rentometer. Don't just trust the seller's numbers.
- Other Monthly Income: Account for any extra income streams, like fees for pets, parking spaces, or on-site laundry.
- Vacancy Rate: No property stays rented 100% of the time. You need to budget for turnover. A 5-8% vacancy rate is a safe industry standard. For a property renting at $2,000 a month, that means setting aside $100-$160 every month to cover the gaps.
Next, and most importantly, come the operating expenses. For a much deeper breakdown, you can reference our guide on building a rental income and expenses spreadsheet.
- Property Taxes: Look this up on the county assessor’s website. Crucially, make sure you're estimating taxes based on your purchase price, not the seller's potentially lower, outdated assessment.
- Property Insurance: Get a real quote for a landlord policy from an insurance agent. It will probably land somewhere between $80-$150 per month, but this can vary wildly by location.
- Maintenance & Repairs: Things break. The "1% Rule" is a good starting point—budget 1% of the property's value annually for repairs. On a $300,000 house, that's $3,000 a year, or $250 per month.
- Capital Expenditures (CapEx): This is different from maintenance. CapEx is for the big, expensive stuff that wears out over time: the roof, the HVAC, the water heater. Budget another 1% of the property's value annually. Don't skip this.
- Property Management Fees: If you’re not managing it yourself, expect to pay a pro 8-12% of the monthly rent.
- HOA Fees & Utilities: List any other recurring costs, like homeowner association dues or utilities (water, sewer, trash) that you, the landlord, will be covering.
Having accurate and complete data is the lifeblood of a good deal analysis. It's often worth looking into methods for efficiently gathering real estate data to ensure your inputs are solid. With this dashboard built, you've laid the groundwork for calculating the key metrics that will tell you whether to move forward or walk away.
Formulas That Power Your Profitability Analysis
Alright, you've got your inputs neatly lined up. Now for the fun part—making the spreadsheet actually do the work. This is where we plug in the formulas that turn those raw numbers into a clear picture of a property's financial health.
Think of it as building a story. We’ll start with the property's core income, factor in the financing, and end with the actual cash that lands in your pocket. Each formula builds on the last, giving you a complete financial narrative.
Calculating Net Operating Income (NOI)
First things first, we need to figure out the Net Operating Income (NOI). This is a foundational metric in real estate. Essentially, it tells you how much profit a property generates from its day-to-day operations, completely ignoring any mortgage payments. It’s the pure, unleveraged income the asset produces on its own.
The math is simple: just subtract all your operating expenses from the total income.
Formula for Annual NOI:
=(Gross_Monthly_Rent * 12) - (Annual_Operating_Expenses)
Let’s run a quick example. Say a property brings in $2,000 a month in rent. Annually, that’s $24,000. If your total operating costs—things like taxes, insurance, maintenance, and capital reserves—add up to $9,600 for the year, your formula would look like this: =(2000*12) - 9600.
That gives you an annual NOI of $14,400. Crucially, notice we left the mortgage out of this. That's a financing cost, not an operating expense, and it comes into play later.
Determining Your Monthly Mortgage Payment
Next up is the biggest expense for most of us: the mortgage. Calculating your principal and interest payment by hand is a nightmare, but thankfully, spreadsheets have a built-in function that makes it a breeze: the PMT function.
It just needs three pieces of information, which you can pull directly from your input dashboard: the interest rate, the loan term, and the total loan amount.
Formula for Monthly Mortgage Payment:
=PMT(Interest_Rate/12, Loan_Term_in_Years*12, -Loan_Amount)
A couple of quick tips to get this right:
- Rate: The function needs a monthly rate, so be sure to divide your annual interest rate by 12.
- Nper: This stands for the total number of payment periods. Just multiply the loan term in years by 12.
- Pv: The loan amount (present value) needs to be a negative number. This tells the formula it's money you've received, ensuring the payment it calculates is a positive number.
Uncovering Your True Annual Cash Flow
With your NOI and mortgage payment calculated, we can finally get to the number that really matters: cash flow. This is the money left over at the end of the year after every single bill is paid, including the loan. This is your take-home profit. If you want to dive deeper into this, we have a complete guide on completing a rental property cash flow analysis.
The calculation itself is straightforward. Just subtract your total annual mortgage payments from your annual NOI.
Formula for Annual Cash Flow:
=Annual_NOI - (Monthly_Mortgage_Payment * 12)
Let's stick with our example. We had an NOI of $14,400. If the PMT formula gave us a monthly mortgage payment of $850 (which is $10,200 annually), our annual cash flow would be $4,200. That breaks down to $350 a month in pure profit hitting your bank account.
Evaluating Returns with Cap Rate and Cash-on-Cash
Okay, now we're moving from "Is it profitable?" to "How good is this investment?" These next two metrics are the key performance indicators (KPIs) that let you compare different properties on an even playing field.
This is what a professional-grade summary looks like. We're building a simpler version, but the goal is the same: to turn a bunch of data into a clear go/no-go decision.
First, we have the Capitalization Rate, or Cap Rate. This is a classic metric that shows you the property's rate of return before factoring in the loan. It’s the perfect tool for quickly comparing the raw profitability of different deals.
Formula for Cap Rate:
=Annual_NOI / Purchase_Price
In our example, a $14,400 NOI on a $250,000 property gives us a Cap Rate of 5.76% (14400 / 250000).
Finally, there's the Cash-on-Cash Return. This might be the single most important number for a new investor. It answers the simple, critical question: "For every dollar I pull out of my pocket for this deal, how much do I get back in the first year?" Your spreadsheet is ultimately a tool for this kind of rigorous profitability analysis.
Formula for Cash-on-Cash Return:
=Annual_Cash_Flow / Total_Cash_Invested
Your Total Cash Invested includes your down payment, all your closing costs, and any money you spent on upfront repairs. If your annual cash flow is $4,200 and your total out-of-pocket investment was $60,000, your Cash-on-Cash Return is a solid 7.0%. It means that for the $60,000 you put on the line, you earned 7.0% of it back in profit in year one alone.
Stress-Testing Your Deal With Scenario Modeling
A basic spreadsheet will tell you if a deal looks good on paper today. But the best analysis tools help you see if that deal can survive the real world tomorrow. This is where we go beyond simple calculations and turn your spreadsheet into a dynamic tool for stress-testing your investment.
Let's be honest: the numbers you first run are rarely the ones you end up with. Interest rates shift, a surprise roof repair pops up, or a unit sits vacant a month longer than you planned. By building in the ability to model different scenarios, you’re no longer just hoping for the best—you're preparing for reality. You can then make decisions based on a range of outcomes, not just a single, perfect-world forecast.
This is the core of smart rental analysis—turning income estimates into the hard numbers that define your profit.
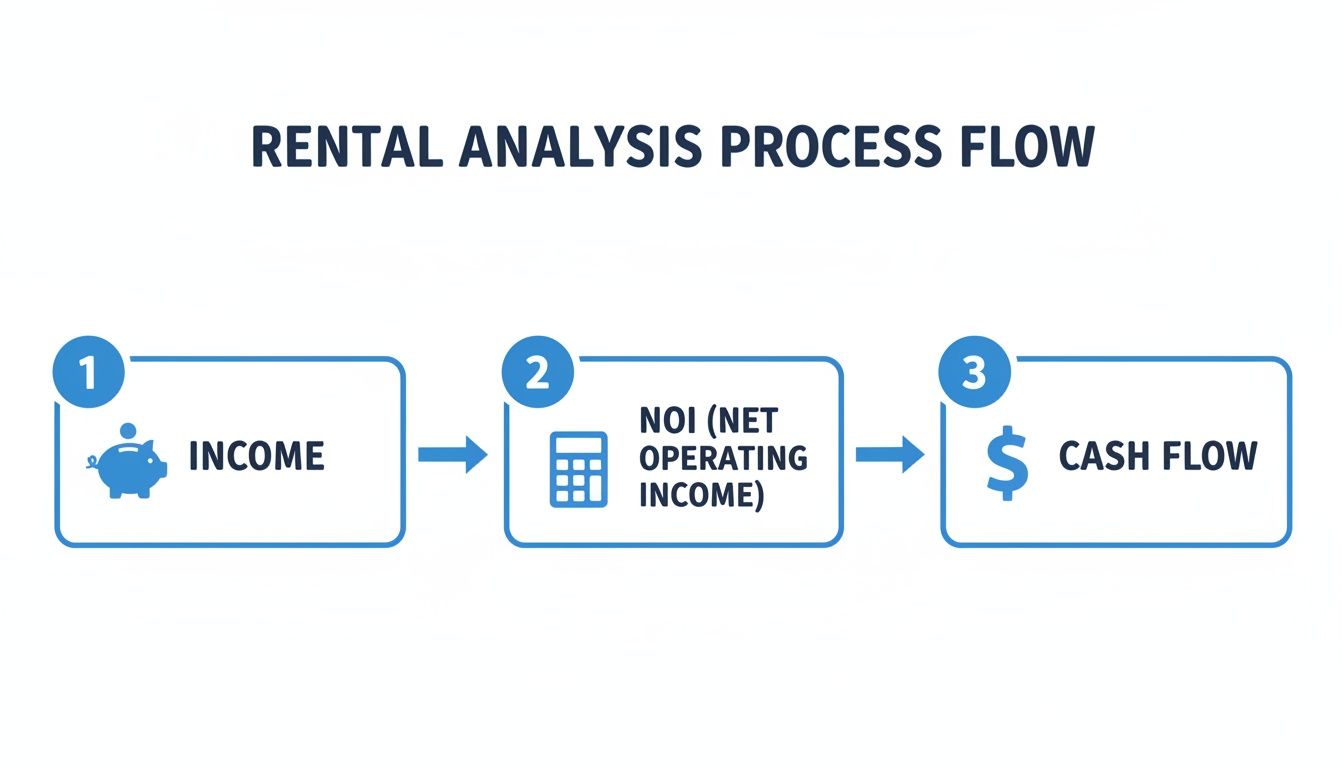
As the chart shows, every expense chips away at your gross income. What’s left after paying the bills (but before the mortgage) is your Net Operating Income, and your actual take-home cash flow comes after that.
Adding a Simple Amortization Schedule
Before we start comparing different loans, it’s incredibly helpful to see how one loan works over time. An amortization schedule does just that, breaking down every single mortgage payment into principal and interest.
When you first start paying off a loan, it can feel like you’re getting nowhere. That’s because the vast majority of your payment is going straight to interest. But slowly, that balance shifts, and more of your money starts paying down the loan and building that all-important equity.
You don't need a massive 360-month table (for a 30-year loan). A simplified version showing the first few years is plenty. In Excel or Google Sheets, you can get this done with a few key formulas:
- Principal Paid: Use the
=PPMT()function. - Interest Paid: The
=IPMT()function handles this. - Remaining Balance: This is just last month's balance minus the principal you just paid.
Seeing this breakdown is powerful. It visualizes how you're building wealth through equity, something a simple cash flow number completely misses.
Creating a "What-If" Comparison Table
Okay, this is where your spreadsheet transforms from a calculator into a strategic weapon. We're going to set up a small table that lets you compare different scenarios side-by-side. The magic is that as you tweak your assumptions in the main input area, this table will update instantly.
For example, you’re weighing your financing options. Do you put 20% down or stretch to 25%? A bigger down payment might get you a better interest rate, but it also means more of your cash is tied up in one deal. Which path leads to a better return? A scenario table will give you the answer in seconds.
Your goal is to create a section where you can change just a few key variables—like down payment, interest rate, or rent—and immediately see how it impacts your bottom-line metrics: cash flow, cash-on-cash return, and total cash to close.
This kind of rapid analysis is essential right now. As global property markets shift, opportunities are popping up for investors who can move quickly. Recent reports show places like Spain offering rental yields around 5.43% and the UAE hitting 6-7%. Investors are jumping on these deals, but only after modeling various financing options to find the smartest entry point. A flexible spreadsheet lets you explore these possibilities in minutes. For more on this, check out these insights on how global real estate trends are creating new investment opportunities.
Comparing Financing Scenarios Side-by-Side
Here’s a practical look at how you can compare two financing options. By laying the numbers out like this, you can instantly see the trade-offs between putting more money down for a better rate versus keeping more cash in your pocket.
| Metric | Scenario A: 20% Down at 6.5% | Scenario B: 25% Down at 6.25% |
|---|---|---|
| Cash to Close | $60,000 | $75,000 |
| Monthly Mortgage | $1,517 | $1,385 |
| Monthly Cash Flow | $383 | $515 |
| Cash-on-Cash Return | 7.66% | 8.24% |
In this case, Scenario B produces higher monthly cash flow and a better CoC return, but it requires an extra $15,000 upfront. This table doesn't tell you which is "right"—it gives you the data you need to decide what's right for your strategy.
The Most Important Scenarios to Model
Once your comparison table is live, you can test anything. This isn’t just for fun; it's about making practical decisions to protect your money and boost your returns. I always run these three tests on any potential deal:
Financing Variations: This is the classic 20% down at 6.5% vs. 25% down at 6.25% test. You'll quickly learn how a higher down payment crushes your cash-on-cash return, even if it boosts your monthly cash flow. It forces you to think about the best use of your capital.
Rent Sensitivity: What if the market is softer than you think and you can only get $1,900 in rent instead of $2,100? Plug that number in. See what happens. Does the deal still cash flow? Does it still meet your minimum profit goals? This tells you how much wiggle room you have.
Expense Shocks: Let’s say property taxes jump 15% next year after a reassessment. Or your insurance premium skyrockets. Model it. Does the property sink into the red, or does it stay profitable? This is how you prepare for the nasty surprises that are almost always out of your control.
Running these numbers isn't just about analyzing a property—it's about building a business plan for it. You’ll walk away knowing its strengths, its weaknesses, and exactly which levers matter most for keeping it profitable.
Knowing When to Graduate to Automated Software
Building your own rental property analyzer spreadsheet is a huge win. Seriously, that process gives you a gut-level understanding of how the numbers in a deal truly work—an instinct that will stick with you for your entire investing career.
But there comes a point for every serious investor where that trusty spreadsheet starts to hold you back. The very tool that taught you the fundamentals can become a bottleneck as you try to scale.
You'll know you're there when you start spending more time hunting for comps, verifying county tax rates, or calling around for insurance quotes than you do actually analyzing deals. This is the inflection point. It’s when moving to an automated tool isn't giving up; it's a strategic upgrade.
The Hidden Costs of Manual Analysis
The real danger of sticking with a manual spreadsheet for too long isn't just the time you lose. It's the risk of a single, hidden error costing you thousands.
A mistyped formula, an accidentally deleted cell, or an outdated tax rate can torpedo your entire analysis without you even realizing it. You might jump on a deal thinking it's a home run, only to find out months later that a broken cell reference was hiding a negative cash flow.
These manual spreadsheets have some serious limitations as you grow:
- It's a Time Sink: The hours it takes to manually pull accurate, localized data for taxes, insurance, and realistic maintenance estimates for every single property is just immense.
- Human Error is Real: A complex spreadsheet with dozens of formulas is a minefield of potential mistakes. One bad copy-paste can lead you to make a disastrously wrong decision.
- You Can't Scale: Trying to compare five, ten, or twenty properties side-by-side in a spreadsheet is a clunky, frustrating mess. You end up missing out on fantastic deals simply because your analysis process can't keep pace with the market.
A spreadsheet is fantastic for digging deep into a single deal. Automated software is built to screen dozens of deals in minutes, so you never miss a great opportunity because you were stuck wrestling with VLOOKUP.
How Software Supercharges Your Knowledge
Switching to a professional platform doesn't mean you forget everything you've learned. It means you get to amplify it. These tools are built to automate the exact tedious tasks that bog you down in a spreadsheet. They handle the data gathering and number-crunching, freeing you up to focus on the high-level strategy—making the final call.
Modern platforms plug directly into live market data, instantly pulling comps, rent estimates, and local expenses. This means you can get a complete analysis of a potential deal in minutes, not hours. For example, some tools can generate a full financial projection, including a trustworthy cash-on-cash return, in under 10 minutes.
That kind of speed allows you to vet more properties, make more informed offers, and ultimately, close more profitable deals. If you're serious about growing your portfolio, looking into the best real estate investment software is the next logical step.
The goal isn't to throw your spreadsheet away. It's to build on the incredible foundation you've created, using technology to become faster, more accurate, and infinitely more scalable. You’ve done the hard work of learning the mechanics; now it’s time to upgrade your engine.
Answering Your Lingering Questions
Even the best guides can't cover every single question that pops up when you're building a new tool from scratch. Let's tackle some of the most common questions I hear from investors about building and using a rental property analyzer. Getting these right will help you dodge common mistakes and analyze deals with way more confidence.
What’s the Biggest Mistake Investors Make With These Spreadsheets?
Hands down, the single most damaging mistake is underestimating expenses. It's a classic rookie move. You get so focused on the big, obvious costs—the mortgage payment, taxes, and insurance—that you completely gloss over the "hidden" expenses that can absolutely tank your returns.
I see it all the time: overly optimistic numbers for vacancy, wishful thinking on maintenance costs, and a total blind spot for big-ticket Capital Expenditures (CapEx).
These aren't just abstract numbers on a screen; they represent real cash that will eventually leave your bank account. If you're not budgeting for that new roof you'll need in ten years, you're just building a fantasy. A reliable spreadsheet has to account for these things with realistic percentages. If it doesn't, it's basically worthless.
Remember, the point of an analyzer isn't to make a bad deal look good. It's to give you the cold, hard truth so you can make a smart decision. Ignoring future costs just sets you up for a nasty surprise down the road.
How Do I Find Realistic Expense Numbers for My Market?
This is crucial. You absolutely have to use local data. Generic national averages are fine for a quick back-of-the-napkin calculation, but for a real analysis, you need numbers from your specific market.
Here’s my go-to checklist for digging up accurate local data:
- Property Taxes: Never, ever trust the seller's current tax bill. Go straight to the county assessor's website and pull the tax history yourself. Critically, you need to estimate your future taxes based on what you plan to pay for the property, as the assessment will almost certainly be adjusted after the sale.
- Insurance: This one's easy. Call a local insurance broker and ask for a landlord policy quote. It takes maybe 15 minutes and gets you a real number instead of a wild guess.
- Maintenance & CapEx: A solid rule of thumb is to set aside 1-2% of the property’s value for each of these categories, every single year. So, for a $200,000 property, that's $2,000-$4,000 for maintenance and another $2,000-$4,000 for CapEx.
- Management Fees: Check the websites of a few local property management companies. You'll quickly see the going rate, which is typically between 8-12% of the gross monthly rent.
- Local Investors: This is your best resource. Find other investors in your area through local meetups, BiggerPockets forums, or Facebook groups. They’ll give you the real-world scoop on everything from what a plumber costs to how long properties typically sit vacant.
Can This Spreadsheet Work for a BRRRR or House Hack?
Absolutely. You just need to tweak it a bit to fit the strategy. The core analyzer you've built is the perfect starting point.
For a BRRRR (Buy, Rehab, Rent, Refinance, Repeat) deal, you’ll need to add a few more input fields. Think about it: you need a place for your total rehab budget, the projected After Repair Value (ARV), and the details of the new loan you'll get when you refinance. The whole point is to see how much cash you can pull out and what your new cash flow looks like on the refinanced mortgage.
For a house hack, the main change is on the income side of the equation. You'll want to adjust the "Gross Rent" input so it only reflects the rent you're collecting from your tenants, not the entire property. But here's the key: your expenses should still be based on the entire property. This is how you accurately model how much your tenants are covering your personal living expenses.
Ready to analyze deals faster and with more confidence? While a spreadsheet is a fantastic learning tool, Property Scout 360 eliminates manual data entry and the risk of formula errors. Get instant, accurate projections for cash flow, ROI, and more on any U.S. property in minutes. Find your next profitable investment today.
About the Author
Related Articles
2026 Investor's Guide: Cost of Installing a Sewer Clean Out
Understand the cost of installing a sewer clean out for investment properties in 2026. Get expert advice on prices, ROI, & budgeting for flips. Plan smart!
15 Year vs 30 Year Mortgage: The Investor's Choice
Deciding between a 15 year vs 30 year mortgage for a rental property? Our guide analyzes cash flow, ROI, and equity to help you pick the best loan.
Real Estate Appraisal Software: Features & Limits
Discover what real estate appraisal software is, its core features, and limits. See how it differs from investment tools for profitable deals.