Rental Property Return on Investment Calculator: Quick ROI Insights
Use the rental property return on investment calculator to quickly analyze ROI, cash flow, and profitability so you invest smarter.
If you’re still battling spreadsheets to figure out if a rental property is a good deal, I’ve been there. And I can tell you, you’re probably leaving money on the table. A good rental property return on investment calculator completely changes the game. It takes you from slow, error-prone number crunching to getting instant, accurate analysis. Let's walk through how to use one of these tools to size up a property in minutes, not weeks.
Why Your Spreadsheet Is Costing You Deals

Most of us start our real estate journey with a spreadsheet. It feels like you're in control, right? A blank grid, ready to map out your next big win. But what starts as empowering often turns into a major bottleneck, quietly sabotaging your investment strategy with hidden risks.
The truth is, spreadsheets are incredibly fragile. One bad formula or a simple typo in an expense line can throw off your entire projection. Think about it: basing a $300,000 investment on a number that’s off by just 2% because of a tiny, hidden error. That's how a great deal on paper becomes a money pit in reality.
The Real Price of Doing It Manually
The problem isn't just about math mistakes. Every hour you spend building, fixing, and triple-checking your spreadsheet is an hour you aren't spending finding your next deal. In a hot market, the best properties disappear fast. This "analysis paralysis" is often the only thing standing between you and a killer investment.
Your DIY system also probably struggles with more complex what-if scenarios. Trying to compare different loan types or forecast returns over 10 or 20 years becomes a massive headache. You’re stuck with a static snapshot of a very dynamic asset. Instead of fighting those formulas, it’s worth seeing how experts build a calculator for ROI to appreciate what automated tools can do.
The greatest risk isn't analyzing a deal incorrectly—it's missing out on a great deal because you were too slow. In real estate, speed and accuracy give you the edge.
How to Get That Competitive Edge
This is exactly where a purpose-built rental property return on investment calculator makes all the difference. Tools like Property Scout 360 are designed to solve these exact problems. They give you a proven framework—you just plug in the numbers, and it instantly runs all the critical calculations for you. For those still on the fence, our breakdown of a rental property calculator in XLS highlights why the upgrade is a no-brainer.
By switching to an automated tool, you can:
- Analyze Deals in Minutes: Size up a property and make a confident offer while your competition is still firing up Excel.
- Trust Your Numbers: Standardized, expert-vetted calculations mean you can finally stop worrying about formula errors.
- Model Different Futures: Instantly compare various financing terms, rent scenarios, and expense budgets to find the most profitable strategy.
This guide will show you how to master the essential metrics—ROI, Cash-on-Cash Return, and Cap Rate—and turn raw data into the clear insights you need to make your next move.
Gathering Your Data for Accurate Projections
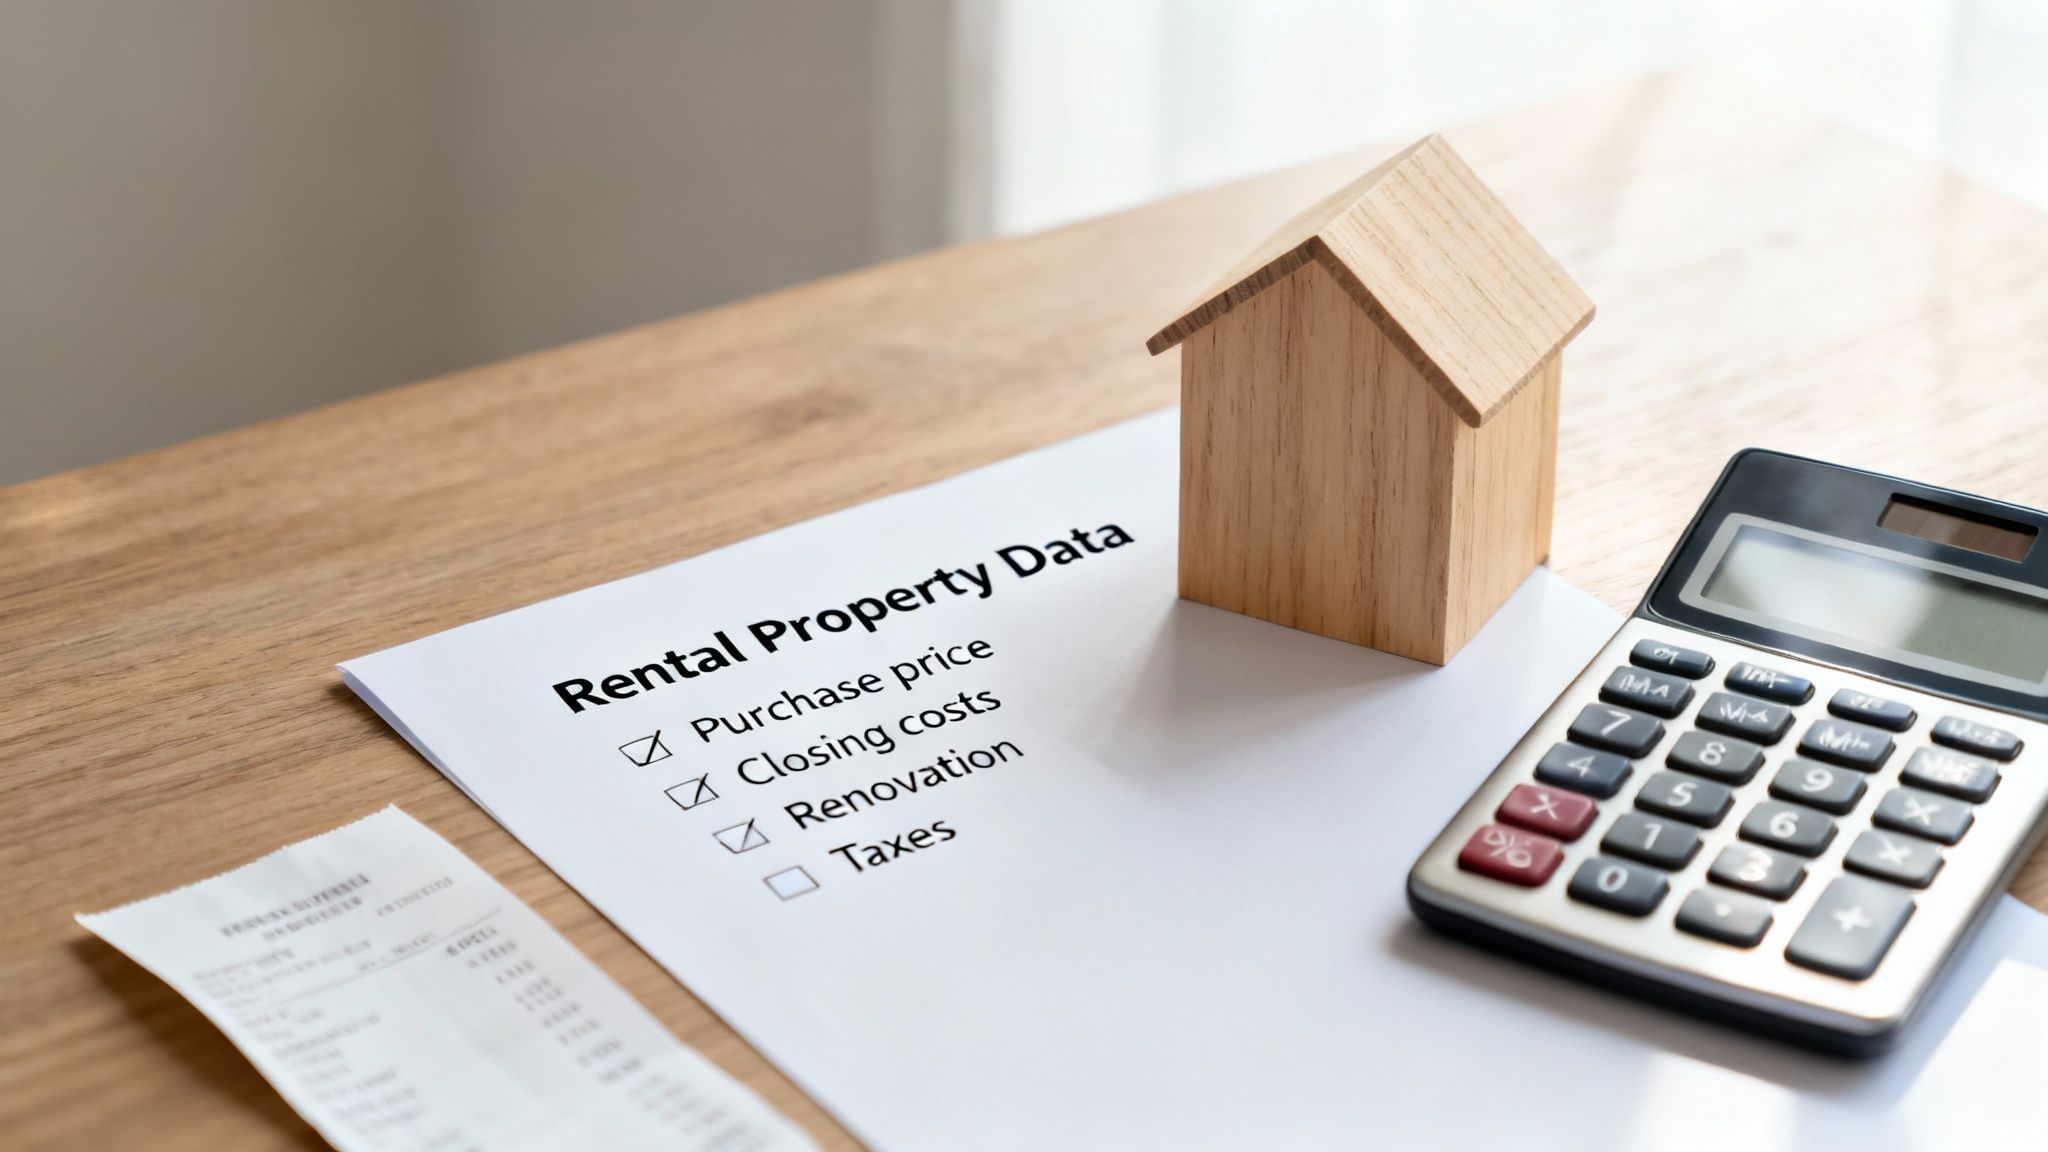
Any rental property return on investment calculator is only as smart as the data you feed it. As the old saying goes, "garbage in, garbage out"—and that's especially true when you're analyzing a real estate deal. Before you can get a clear picture of a property's potential, you have to get your hands dirty and assemble a complete list of all your costs, both upfront and ongoing.
Think of it like building the financial blueprint for your investment. If you miss just one number, it can throw off your entire projection, turning what looked like a sure thing into a costly mistake. Our goal here is to build a complete financial picture, leaving no stone unturned before you even think about making an offer.
Your Initial Investment Checklist
Your initial cash outlay is so much more than just the down payment. It’s the total sum you need to bring to the table just to get the keys and make the place tenant-ready. Forgetting even one of these costs can throw a serious wrench in your cash-on-cash return calculations down the line.
Let's break down the essential numbers you absolutely need to nail down.
- Purchase Price: This one's easy—it's the big number you offer for the property.
- Down Payment: For an investment property, you're typically looking at 20-25%. This will almost always be your single largest cash expense.
- Closing Costs: A good rule of thumb is to budget around 2-5% of the purchase price to cover lender fees, appraisals, title insurance, and all the other little things.
- Renovation & Repair Budget: This is where so many new investors get tripped up. Don't guess. Whether it's a fresh coat of paint or a full kitchen gut, get actual quotes from contractors to have a firm number.
Let’s run a quick scenario. Imagine you're eyeing a $350,000 single-family home in Austin, Texas. A 20% down payment is $70,000. Add another 3% for closing costs ($10,500) and a conservative $15,000 for initial repairs, and your total cash needed to close suddenly jumps to $95,500. That is your true starting investment.
Accounting for Ongoing Operating Expenses
Once you've bought the property, the expenses don't magically stop. These ongoing costs, what we call operating expenses, directly hit your monthly cash flow and have to be estimated accurately. Using a solid rental property return on investment calculator is a great way to make sure you don't miss these crucial details.
A common mistake I see all the time is investors focusing only on the mortgage payment. The true cost of ownership includes a dozen smaller expenses that can absolutely eat away at your profits if you don't plan for them.
Here’s what you need to project on an annual basis:
- Property Taxes: Don't guess. Look up the property’s tax history on the county assessor’s website.
- Homeowners Insurance: You'll need a landlord policy, which is different (and often more expensive) than a standard homeowner policy. Get a real quote.
- Vacancy Rate: Even in a hot market, you have to plan for downtime between tenants. A conservative estimate is 5-8% of the gross annual rent.
- Property Management Fees: If you aren't managing it yourself, budget 8-10% of the monthly rent for a property manager.
- Maintenance & Repairs: A great rule of thumb is to set aside 1% of the property’s value every year for the big stuff—that future water heater or roof replacement.
- Utilities: Will you be covering water, sewer, or trash? Factor those costs in.
Getting these numbers right is critical everywhere, but especially in a hot market like Texas. In fact, for 2025, Texas is projected to be the top U.S. state for rental property ROI, thanks to strong price growth and attractive rental yields. That makes it an ideal place for investors using tools like Property Scout 360 to analyze deals, as the state's economic stability and population growth provide a solid foundation for returns. If you're curious, you can discover more insights about top ROI markets and what makes them tick.
Getting to the Heart of the Numbers: The Four Core Metrics
Alright, you've plugged in all your numbers. Now for the fun part. A solid rental property ROI calculator won't just give you a single, generic answer. It'll lay out a dashboard of metrics, and this is where the real analysis begins. Each number tells a piece of the story, and learning to read them is what separates the casual investor from the serious one.
We're going to dive into the four metrics that matter most: Cash-on-Cash Return, Cap Rate, Total ROI, and the Break-Even Ratio. Think of them as different lenses you can use to examine a potential deal, each one highlighting a different aspect of its profitability.
Cash-on-Cash Return: The King of Cash Flow
If your main strategy is to build a stream of monthly income, then Cash-on-Cash (CoC) Return is your go-to metric. It answers a beautifully simple question: "For every dollar of my own money I put into this deal, how much cash do I get back each year?"
What I love about this metric is its purity. It completely ignores things like appreciation or tax benefits and just focuses on the cold, hard cash that lands in your bank account.
The formula is straightforward:
Annual Pre-Tax Cash Flow / Total Cash Invested
Let's stick with our Austin property example. Imagine you put in a total of $95,500 between the down payment, closing costs, and initial repairs. After paying the mortgage and all other operating expenses, you’re left with $7,100 in cash flow for the year.
Your CoC Return would be $7,100 / $95,500, which comes out to 7.44%. This tells you that for every dollar you personally invested, you're getting back about 7.4 cents annually. For anyone focused on generating passive income, a healthy CoC is an absolute must-have.
Cap Rate: The Great Equalizer
Next up is the Capitalization Rate, or Cap Rate. While CoC is all about your deal with your financing, the Cap Rate takes the loan completely out of the picture. This is huge because it lets you compare the raw income-producing power of different properties as if you bought them all with cash. It levels the playing field.
This is the metric that commercial investors and serious pros rely on to quickly size up a property's unleveraged return.
Here's the formula:
Net Operating Income (NOI) / Property Purchase Price
Your NOI is just your total rental income minus all the operating expenses—before you factor in your mortgage payment. Using our Austin example, if the property generates an NOI of $21,000 and you bought it for $350,000, the Cap Rate is 6%. Getting a handle on what is a good cap rate in real estate is key to understanding how a property stacks up against others in its market.
A higher Cap Rate often points to higher potential returns (and, let's be honest, usually higher risk). A lower Cap Rate typically signals lower risk and more stability, which you often see in premium, high-demand areas.
Total ROI: The Complete Long-Term Picture
Cash flow is king, but it's not the only way to build wealth in real estate. Total ROI gives you a much bigger, more complete picture of your investment's performance. It brings in the other powerful wealth-building engines: your tenants paying down your loan and the property (hopefully) appreciating in value over time.
This metric is for the long-game investors—the buy-and-hold crowd. It combines a few key elements into one powerful number:
- Annual Cash Flow: The profit you actually pocket.
- Principal Paydown: The equity you build each year as your loan balance shrinks.
- Estimated Appreciation: The projected increase in the property's market value.
Back to our Austin property: we add the $7,100 in cash flow to $3,500 in principal paydown and a conservative 3% appreciation ($10,500). That gives us a total annual gain of $21,100. When you divide that by our initial $95,500 cash investment, you get a Total ROI of a very strong 22.1%.
As a benchmark for 2025, investors across the globe, from Texas to Dubai, are often targeting a total return of 8-12%. This sweet spot provides a healthy mix of immediate income and long-term growth. You can see how different markets are performing against this benchmark to get a feel for the broader landscape.
Break-Even Ratio: Your Ultimate Risk Assessment
Last but certainly not least is the Break-Even Ratio (BER). This is your financial safety net. It tells you exactly what percentage of your rental income gets eaten up by expenses and debt. Put another way, it shows you how much vacancy you can handle before you start losing money.
You always want a lower BER—it means you have more wiggle room if things go wrong.
The formula looks like this:
(Operating Expenses + Debt Service) / Gross Operating Income
If your total annual costs (including the mortgage) are $28,900 and your gross income is $36,000, your BER is 80.3%. This means you need the property to be rented out just over 80% of the time to cover your nut. Knowing this number is critical for understanding a deal's true risk profile before you're locked in.
Of course, crunching all these numbers for every single property can be a huge time sink. This is exactly where tools like Property Scout 360 come in, automating all of it so you can analyze deals in minutes, not hours.
Before moving on, let's quickly summarize these four crucial metrics. Each one serves a different purpose, and knowing which one to focus on depends entirely on your personal investment strategy.
The Core Four Metrics at a Glance
| Metric Name | What It Measures | Best For Investors Focused On |
|---|---|---|
| Cash-on-Cash Return | The annual cash income relative to the actual cash you invested. | Immediate Passive Income: Maximizing monthly cash flow. |
| Cap Rate | The property's unleveraged annual return, ignoring financing. | Comparative Analysis: Quickly comparing the raw profitability of different properties. |
| Total ROI | The combined return from cash flow, equity buildup, and appreciation. | Long-Term Wealth Building: A holistic view of buy-and-hold performance. |
| Break-Even Ratio | The percentage of income needed to cover all costs. | Risk Assessment: Understanding your margin of safety and vacancy tolerance. |
Understanding this "Core Four" is fundamental. It empowers you to look beyond the flashy marketing and truly dissect the financial health of any potential rental property.
How Different Financing Scenarios Impact Your Returns
The way you finance a property isn't just about getting the keys—it's one of the most powerful levers you can pull to shape your investment returns. How you structure the deal directly impacts everything from your monthly cash flow to your long-term wealth. This is where a sharp rental property return on investment calculator really proves its worth, letting you model different scenarios in minutes.
Let's walk through how the same exact property performs under three completely different financing structures. This side-by-side comparison will show you just how much your down payment, interest rate, and loan type can change the financial outcome.
Scenario 1: The Conventional Investor Loan
This is the bread and butter for many real estate investors: a conventional loan with a hefty 20-25% down payment. It requires more cash out of pocket, but the trade-off is often a better interest rate and, crucially, no Private Mortgage Insurance (PMI).
Picture a $300,000 property. Putting 25% down means you're bringing $75,000 to the table, leaving you with a $225,000 loan. That larger down payment shrinks your monthly mortgage payment, which gives your net cash flow an immediate boost.
- Pro: Generates higher monthly cash flow and gives you a solid equity position from day one.
- Con: Ties up a significant amount of capital, which can slow down how quickly you build a portfolio.
This route is a favorite for investors who value steady, reliable monthly income over rapid expansion. Your cash-on-cash return might look lower at first because of the large initial investment, but the deal itself is on much more stable footing.
Scenario 2: The FHA Low Down Payment Option
An FHA loan can be a total game-changer, especially for owner-occupants using the "house hacking" strategy (living in one unit of a multi-family property). These government-backed loans open the door with down payments as low as 3.5%.
On that same $300,000 property, a 3.5% down payment is just $10,500. All of a sudden, getting into a property feels much more attainable. The catch? You'll have to pay PMI, and your monthly mortgage payment will be noticeably higher because you borrowed more money.
An FHA loan can send your cash-on-cash return through the roof simply because your initial investment is so small. You're using maximum leverage, but that also increases your monthly carrying costs and overall risk.
This is a fantastic approach for investors who have limited cash but are eager to get in the game. The monthly cash flow will be thinner, but the return on the actual dollars you invested can be massive.
Scenario 3: Creative Financing and Seller Notes
Once you step outside the world of traditional banks, a whole new set of possibilities opens up. One of my favorite creative tools is the seller note, where the seller essentially acts as the bank for a piece of the purchase.
For example, you could get a conventional loan for 80% of the property's value, but then negotiate with the seller to carry a note for another 10%. Just like that, your out-of-pocket down payment drops from 20% to 10%. Understanding what is a seller note can reveal some incredible strategies for getting into deals with less of your own cash. The financing choices you make will dramatically alter your ROI, especially when you start looking at different mortgage loan options.
So, how do these three scenarios really stack up on our $300,000 property? Let's assume a 6.5% interest rate and identical operating expenses across the board.
| Metric | Conventional (25% Down) | FHA (3.5% Down) | Seller Note (10% Down) |
|---|---|---|---|
| Total Cash Invested | $75,000 | $10,500 | $30,000 |
| Monthly P&I | $1,422 | $1,826 | $1,707 (Loan + Note) |
| Annual Cash Flow | $4,936 | $1,088 (after PMI) | $2,516 |
| Cash-on-Cash Return | 6.6% | 10.4% | 8.4% |
The numbers don't lie. The FHA loan delivers the highest cash-on-cash return but also leaves you with the thinnest cash flow margin. The conventional loan is the picture of stability with great cash flow, but the initial return metric is lower. The seller note strikes a fantastic balance between the two.
There's no single "best" path here—it all comes down to your personal finances and what you're trying to achieve as an investor. Using a powerful rental property return on investment calculator like Property Scout 360 lets you run these comparisons instantly, giving you the clarity to pick the financing strategy that truly fits your goals.
Putting a Real-World Duplex Deal Under the Microscope
Theory is one thing, but running the numbers on an actual deal is where the rubber meets the road. Let’s walk through a real-world analysis of a duplex I recently evaluated in a hot market. This is exactly how you’d use a rental property return on investment calculator to move from a "maybe" to a confident "yes" or "no."
This isn't just about plugging in numbers. It's about developing the instinct to know a good deal when you see one—and act on it.
Laying the Groundwork: The Property and Initial Numbers
I found a duplex listed for $425,000. It's in a solid, up-and-coming neighborhood where rental demand is fierce. A quick look at comps on Zillow and Rentometer confirmed my hunch: I could realistically get $1,600 per month for each unit. That’s a total gross monthly income of $3,200, or $38,400 a year.
With the income side sorted, it was time to build out the cost side for the calculator.
- Purchase Price: $425,000
- Closing Costs: I always budget 3% as a safe estimate, which comes to $12,750.
- Initial Repairs: The place was in decent shape, but I wanted to budget $10,000 for fresh paint, refinishing some floors, and tackling a few minor plumbing issues.
This put my total out-of-pocket cash before the down payment at $22,750.
Projecting the Operating Expenses
Getting your ongoing expenses right is everything. If you fudge these numbers, your entire analysis is worthless. I used a mix of hard data and conservative estimates.
- Property Taxes: A quick search of the county records showed last year's tax bill was $5,100.
- Insurance: I got a quote for a good landlord policy at $1,800 annually.
- Vacancy: I never assume 100% occupancy. A 5% vacancy rate is my standard starting point, which works out to $1,920 per year.
- Repairs & Maintenance: For ongoing upkeep, the 1% rule is a good baseline. That's 1% of the purchase price, or $4,250 a year.
- Property Management: Since I planned to self-manage, I put 0% for this.
My total annual operating expenses landed at $13,070. When you subtract that from the gross income of $38,400, you get a Net Operating Income (NOI) of $25,330. Now we’re ready to play with financing.
The single biggest mistake I see new investors make is underestimating expenses. A solid rental property return on investment calculator forces you to look at every single cost, from vacancy to capital expenditures. It keeps your projections honest.
Scenario 1: The Conventional 20% Down Loan
First, I ran the numbers for a standard investment property loan. This required 20% down, which is $85,000 on a $425,000 property. The loan amount would be $340,000. With interest rates at the time, I modeled a 6.5% rate on a 30-year mortgage, making the principal and interest payment $2,149 per month.
Here's how it shook out:
- Total Cash Invested: $85,000 (Down Payment) + $22,750 (Closing Costs/Repairs) = $107,750
- Annual Debt Service: $2,149 x 12 = $25,788
- Annual Cash Flow: $25,330 (NOI) - $25,788 (Debt) = -$458
Ouch. The property was immediately cash-flow negative. That gives it a Cash-on-Cash Return of -0.42%. Based on cash flow alone, this was a hard pass.
Scenario 2: The House-Hacking FHA Loan
But I had another angle: what if I lived in one of the units? By "house hacking," I could use an FHA loan and put down just 3.5%, or $14,875. The loan amount would be much higher at $410,125, and it would come with Private Mortgage Insurance (PMI), which I estimated at $240 a month. The new all-in monthly payment jumped to $2,836.
This visual breaks down how dramatically the upfront cash changes between these loan types.
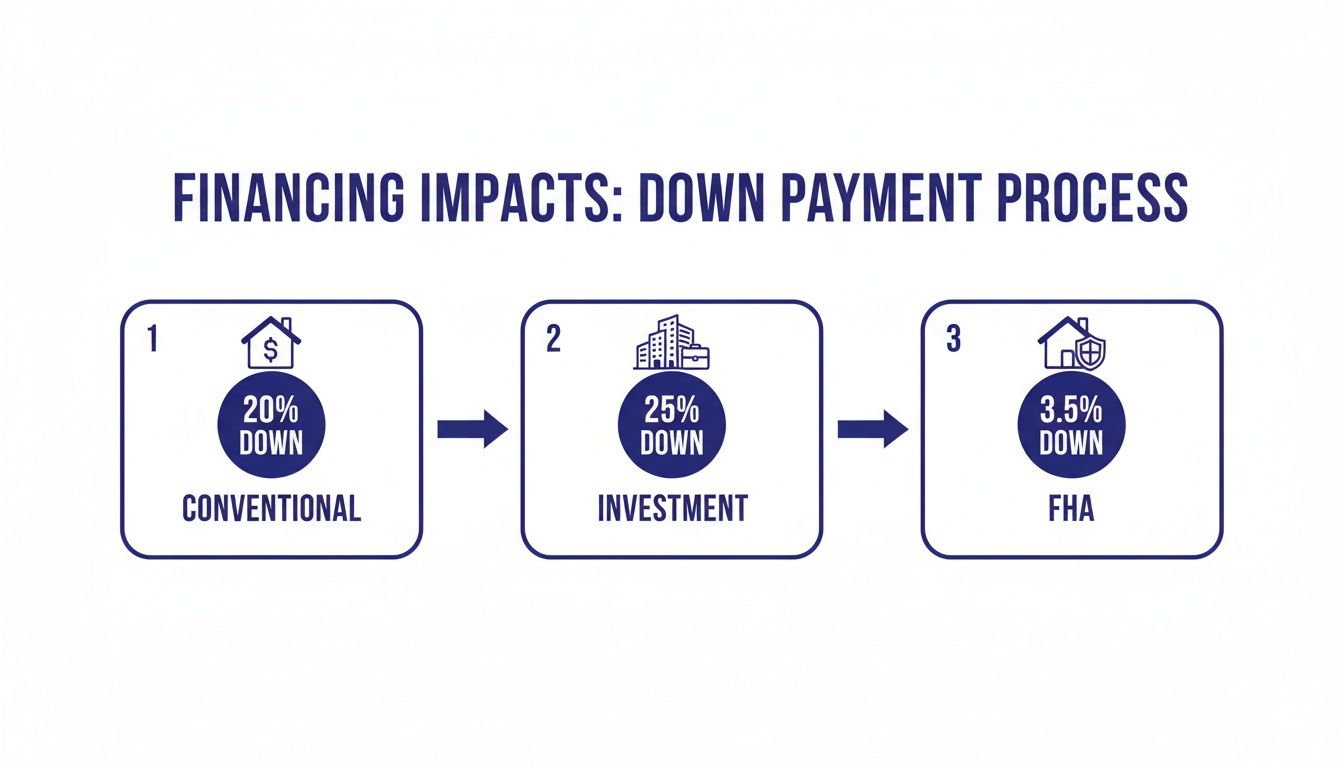
As you can see, the low down payment of an FHA loan makes the deal far more accessible, but the higher monthly mortgage payment is the trade-off you have to analyze.
Let's re-run the numbers from a house-hacker's perspective:
- Total Cash Invested: $14,875 (Down Payment) + $22,750 (Closing Costs/Repairs) = $37,625
- Gross Income: I’d only be collecting rent from one unit now, so $19,200 annually.
- Annual Debt Service: $2,836 x 12 = $34,032
- Annual Cash Flow: $19,200 (Income) - $13,070 (Expenses) - $34,032 (Debt) = -$27,902
At first glance, this looks even worse. But here's the critical difference: I'm living there. My out-of-pocket cost to live in my own unit is $2,325 per month ($27,902 / 12). Meanwhile, my tenant is paying down a massive $410,125 mortgage for me. The cash-on-cash return metric doesn't apply here; the real win is the massively subsidized living cost and forced equity creation.
This kind of strategic thinking is especially relevant with the rise of short-term rentals. With global vacation rental revenues expected to hit $105.7 billion by 2025, an investor could even model a scenario where they live in one unit and Airbnb the other. Advanced tools like Property Scout 360 make modeling these complex scenarios simple. As you can learn more about vacation rental statistics, you'll see how you can plug in higher nightly rates and seasonal demand to see if a deal works under a different model.
The Final Verdict: Is It a Good Deal?
If my goal was a passive investment with an 8% cash-on-cash return, this duplex is a "no-go" using conventional financing. The numbers just aren't there.
But as a house hack? It’s a completely different story. It becomes a fantastic opportunity to get into a prime property for a low upfront cost, have someone else pay most of my mortgage, and build serious equity over time.
This is the true power of a rental property return on investment calculator. It’s not a simple yes/no machine. It's a tool for exploring different angles and uncovering hidden paths to a profitable deal.
Got Questions About Calculating ROI? We’ve Got Answers.
Even with the best tools, you're going to have questions. Every property has its own quirks, and let's be honest, sometimes the numbers just don't feel right. Let's walk through some of the most common sticking points investors run into when running their analysis.
Think of this as your go-to guide for making sure your investment case is built on a solid foundation. We'll clear up the fuzzy math and get you reading the results like you've been doing this for decades.
How Do I Realistically Estimate Expenses Like Maintenance and Vacancy?
This is where the rubber meets the road. Getting this wrong can turn a great deal into a money pit. A classic rule of thumb is the 50% Rule, which assumes half your gross rent will be eaten up by operating expenses (everything but the mortgage payment). It’s a decent starting point, but we can get much more precise.
For bigger-ticket maintenance items—think a new roof in ten years or a water heater replacement—the 1% Rule is a solid benchmark. Just plan on setting aside 1% of the property’s purchase price each year for these capital expenditures.
When it comes to vacancy, look at your specific market. A safe, conservative estimate is usually between 5-10% of the gross annual rent, but a hot market might have a much lower rate.
Local data is your best friend here. Don't just guess. This is where a tool like Property Scout 360 really shines, because it pulls in market-specific data for these costs. It takes the guesswork out and keeps your projections grounded in reality, not just old rules of thumb.
What’s a “Good” Cash-on-Cash Return, Anyway?
This is one of the most common questions I get, and the answer is always, "It depends on your goals." That said, most investors I talk to are looking for a cash-on-cash return between 8% and 12%. A property in that range is usually a healthy, cash-flowing machine.
But your strategy might be different. If you're investing in a rapidly appreciating market like Austin or Denver, you might be perfectly happy with a lower cash-on-cash return—maybe in the 5-7% range. In that scenario, you're betting on long-term appreciation to deliver the bulk of your total return.
The key is to decide what your target is first. Then, you can use the calculator to filter out the deals that don't meet your personal criteria.
Should I Factor Appreciation into My Initial ROI Calculations?
My strong advice is to keep appreciation separate at first. Your initial analysis should focus on the here and now, using hard numbers. Metrics like Cash-on-Cash Return and Cap Rate tell you how the property performs today as a business.
Appreciation is an educated guess about the future. A great investment should pay for itself with the cash it generates, month after month.
Think of appreciation as the cherry on top. It’s a fantastic bonus that can supercharge your wealth down the road, but it shouldn't be the reason you buy the property.
Can This Calculator Work for a BRRRR Deal?
Absolutely. In fact, a good calculator is essential for the BRRRR (Buy, Rehab, Rent, Refinance, Repeat) strategy. You just need to run the numbers twice.
- Analysis #1 (The "Buy and Rent"): First, analyze the deal with the initial purchase price and all of your estimated rehab costs. This tells you if the property will work as a profitable rental before you ever think about refinancing. If the numbers don't work here, stop.
- Analysis #2 (The "Refinance and Repeat"): Next, run the numbers again. This time, use the property's After-Repair Value (ARV) and the new loan details you expect from your cash-out refinance.
This second run-through shows you the real magic of BRRRR—your final, long-term cash-on-cash return after you’ve pulled your initial investment back out. Any platform that lets you itemize your rehab costs will be a huge help in accurately modeling both phases of the deal.
Ready to stop guessing and start making data-driven decisions? The Property Scout 360 platform automates all these calculations, letting you analyze any U.S. property in minutes. Find your next profitable rental deal today with Property Scout 360.
About the Author
Related Articles
2026 Investor's Guide: Cost of Installing a Sewer Clean Out
Understand the cost of installing a sewer clean out for investment properties in 2026. Get expert advice on prices, ROI, & budgeting for flips. Plan smart!
15 Year vs 30 Year Mortgage: The Investor's Choice
Deciding between a 15 year vs 30 year mortgage for a rental property? Our guide analyzes cash flow, ROI, and equity to help you pick the best loan.
Real Estate Appraisal Software: Features & Limits
Discover what real estate appraisal software is, its core features, and limits. See how it differs from investment tools for profitable deals.