What Is Gross Rent Multiplier in Real Estate Investing
What is gross rent multiplier (GRM)? Learn how to use this simple formula to quickly analyze property values and find your next real estate investment.
The Gross Rent Multiplier, or GRM, is one of the quickest back-of-the-napkin calculations you can do in real estate. It's a simple metric that tells you how a property's price stacks up against its annual rental income. In a nutshell, it answers the question: how many years of collecting rent would it take to cover the purchase price?
When you're sifting through dozens of listings, a lower GRM is usually what catches your eye first. It signals that a property might pay for itself faster, making it a potentially more attractive investment right out of the gate.
Decoding the Gross Rent Multiplier

Think about it like this: you're at a farmers market comparing two bags of apples. One bag is cheaper, but the other one is a lot heavier. To figure out the real value, you'd instinctively calculate the price per pound. It’s the only way to make a fair, apples-to-apples comparison.
The Gross Rent Multiplier does the exact same thing for rental properties. It acts as your "price per pound" metric, stripping away the noise to give you a quick gut check on whether an asking price aligns with the income it brings in.
The Core Idea Behind GRM
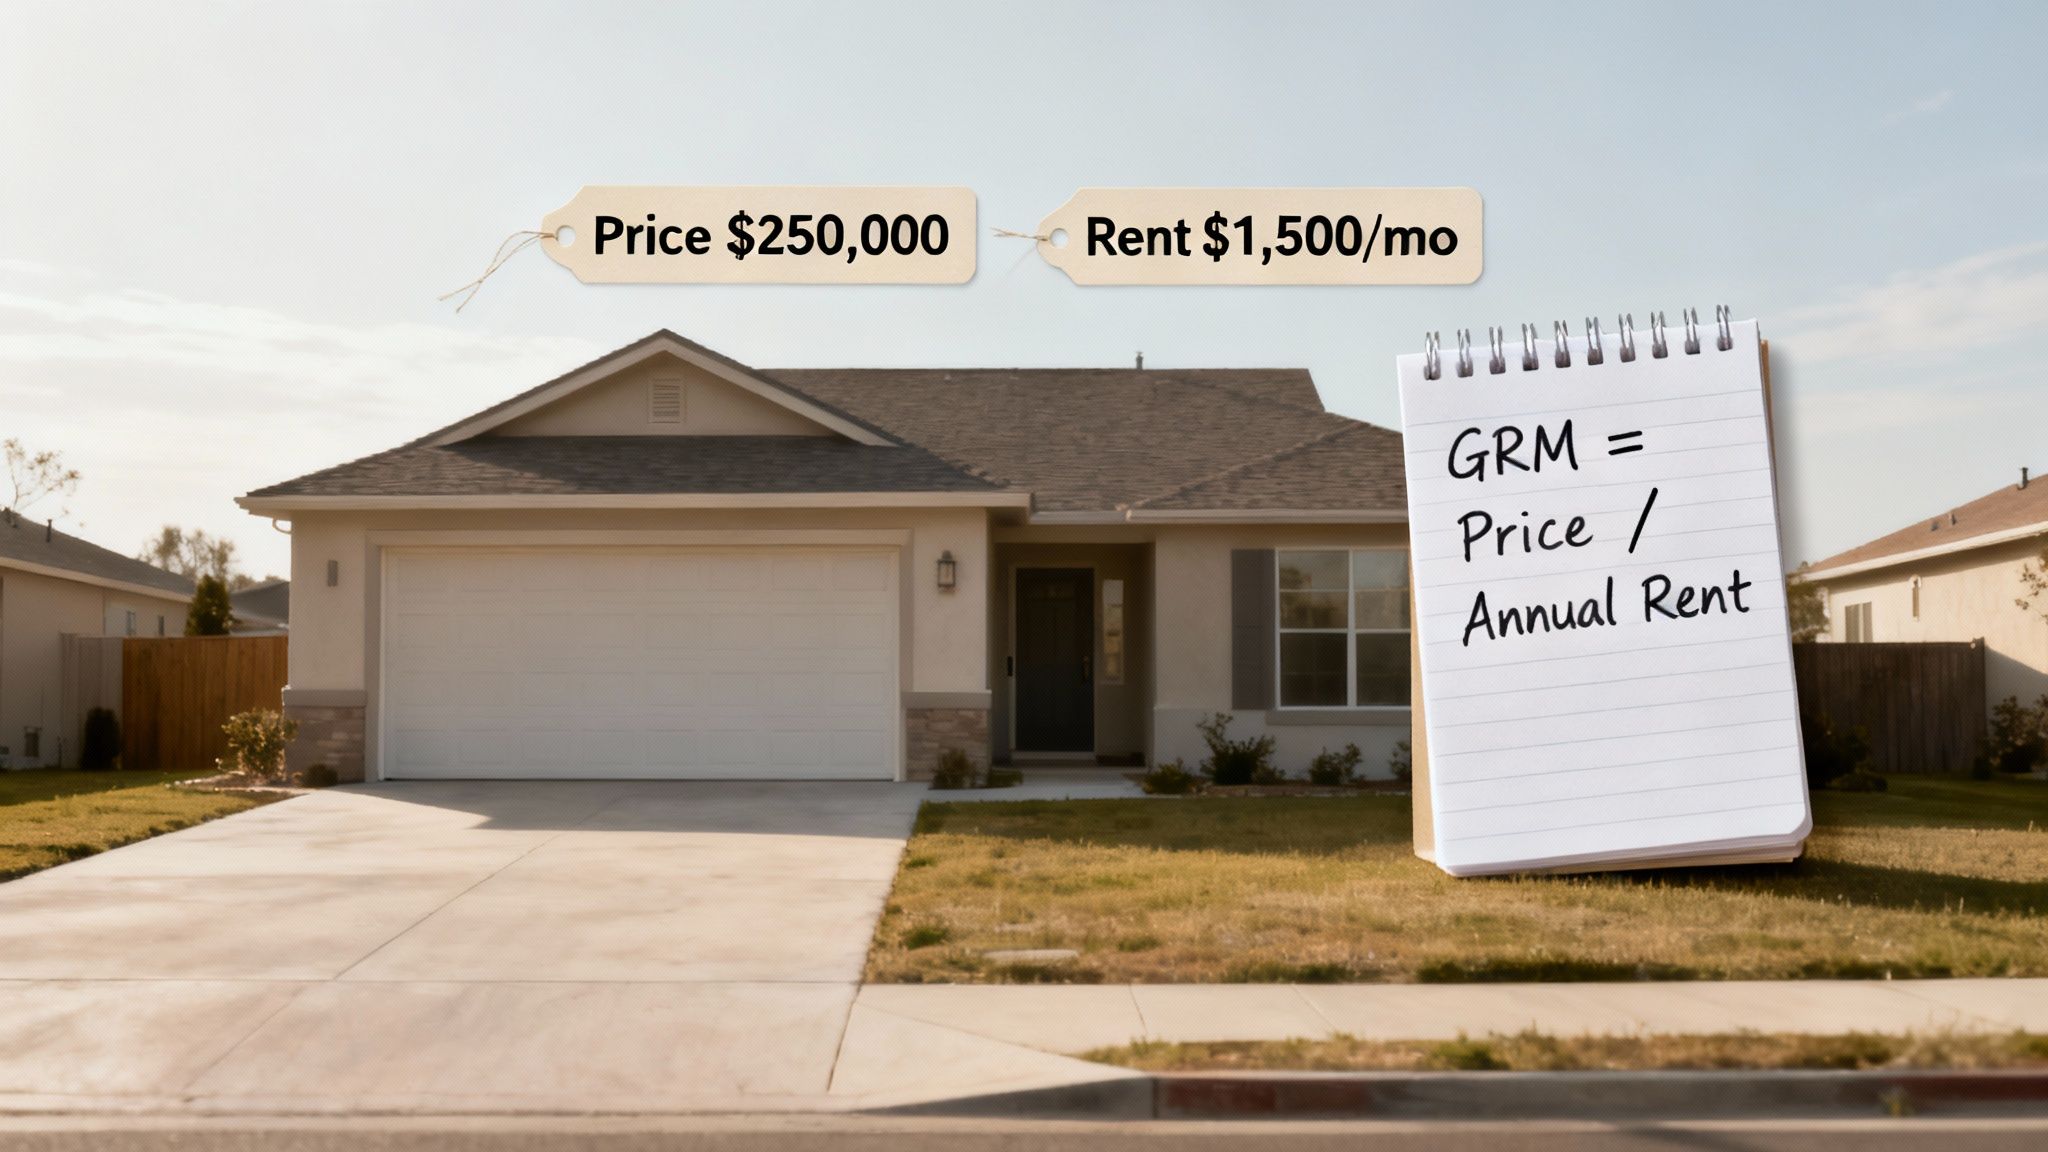
At its heart, GRM helps you answer a fundamental question: "How many years would it take for this property's gross rent to pay for the whole thing?"
The formula couldn't be simpler:
Gross Rent Multiplier = Property Price / Gross Annual Rent
The number you get back isn't a percentage or a dollar amount—it's a multiplier. A GRM of 8 means the property costs eight times what it generates in rent each year. A GRM of 12 means it costs twelve times the annual rent. This elegant simplicity is what makes it so powerful for quickly sorting through a long list of potential deals.
To help you grasp the basics, here’s a quick summary table.
Gross Rent Multiplier at a Glance
| Concept | What It Measures | Primary Use |
|---|---|---|
| Gross Rent Multiplier (GRM) | The relationship between a property's purchase price and its gross (pre-expense) annual rental income. | A rapid screening tool to compare the relative value of similar properties in the same market. |
This table shows just how focused the GRM is. It’s designed for one job: quick, high-level comparisons.
Why It's a Go-To Metric for Initial Screening
Seasoned investors and real estate pros lean on the GRM because it’s the ultimate first-pass filter. For example, if you're looking at a property listed for $1 million that pulls in $200,000 in gross rent per year, its GRM is 5. That number instantly tells you it would theoretically take five years of gross rent to cover the price. You can find more practical examples of how professionals use this metric at Trion Properties.
By focusing only on price and gross rent, you can efficiently compare properties that otherwise look completely different. Let’s say you’re weighing two options:
- Property A: A single-family home for $300,000.
- Property B: A duplex for $450,000.
Just looking at the price, you have no idea which is the better investment. But once you plug in their rental income and calculate the GRM, you can immediately see which one offers more income for your investment dollar before you ever start digging into the deeper numbers.
Throughout this guide, we'll walk you through how to calculate, interpret, and use GRM to make smarter, faster investment decisions.
How to Calculate Gross Rent Multiplier with Real Examples
Alright, you get why the Gross Rent Multiplier is a handy tool. Now let's get our hands dirty with the "how."
The best part about GRM is its beautiful simplicity. You don't need a clunky spreadsheet or a finance degree—just two numbers and a calculator.
The formula itself is just a quick division problem that pits a property's price against its raw income-producing potential.
Gross Rent Multiplier = Property Price / Gross Annual Rent
Think of the resulting number this way: it tells you how many years it would take for the gross rent to completely pay back the property's purchase price. Of course, this is a world without expenses, but as a starting point, it's incredibly useful.
The Two-Step Calculation Process
You can knock out the GRM calculation for any property in less than a minute. It’s a simple two-step dance.
Find the Gross Annual Rent: Most listings give you the monthly rent. To get the annual number, just multiply that by 12. The key word here is gross—we're talking about the total rent collected before you subtract a single penny for expenses.
Divide the Price by the Annual Rent: Take the property's purchase price (or list price) and divide it by the gross annual rent you just figured out. That final number is your GRM.
That’s it. The only real trap is accidentally using the monthly rent instead of the annual figure, which will give you a number that’s completely out of whack.
Let's run through a few real-world scenarios to see how this plays out.
Example 1: The Single-Family Rental Home
Let's say you're eyeing a classic suburban single-family home. It’s a common starting point for investors, and GRM is perfect for quickly sorting through listings.
- Property Purchase Price: $300,000
- Gross Monthly Rent: $2,200
First, we need that annual rent figure.
- Step 1: $2,200 (monthly rent) x 12 months = $26,400 (gross annual rent)
Now, we just plug it into the formula.
- Step 2: $300,000 (price) / $26,400 (annual rent) = 11.36
The GRM for this house is 11.36. On its own, that number doesn't mean much. But when you compare it to the GRM of five other similar houses in the neighborhood, you start to see which deals are priced more attractively.
Example 2: The Duplex Investment
Next up, a small multi-family property—a duplex. The only difference here is that you have to add up the rent from both units before doing the math.
- Property Purchase Price: $450,000
- Gross Monthly Rent (Unit A): $1,500
- Gross Monthly Rent (Unit B): $1,400
First, get your total annual income.
- Step 1: ($1,500 + $1,400) x 12 months = $2,900 x 12 = $34,800 (gross annual rent)
Now, let's find the GRM for the whole property.
- Step 2: $450,000 (price) / $34,800 (annual rent) = 12.93
The GRM here is 12.93. Even though that’s higher than the single-family home, it might still be a fantastic deal if the average GRM for duplexes in that market is, say, 14 or 15. It's all about context.
Example 3: The Small Apartment Building
Let's scale up one more time to a four-unit building. The process is exactly the same, you just have a little more rent to tally up.
- Property Purchase Price: $750,000
- Gross Monthly Rent (4 Units): $1,800 per unit
Time to find the total annual rent for the whole building.
- Step 1: ($1,800 x 4 units) x 12 months = $7,200 x 12 = $86,400 (gross annual rent)
And for the final calculation:
- Step 2: $750,000 (price) / $86,400 (annual rent) = 8.68
This building has a GRM of 8.68. These examples show how GRM levels the playing field, making it easier to compare an apple (a house) to an orange (a fourplex).
But remember, GRM is just the first filter. To get to the real truth of a deal’s profitability, you have to factor in expenses. For the next step in your analysis, check out our guide to calculate cash flow on a rental property and see what GRM leaves out.
What's a Good Gross Rent Multiplier, Anyway?
You just ran the numbers on a fourplex and got a Gross Rent Multiplier of 8.68. So, is that a home run or a red flag?
The only honest answer is: it depends.
There's no magic number for a "good" GRM that works everywhere. A stellar deal in a hot market like Austin might look terrible in a smaller town in Ohio, and vice versa. Your first job as an investor is to get your boots on the ground—figuratively or literally—and understand the local market. Context is everything.
Why Location Dictates the Numbers
Think of GRM as a local pricing language. A property’s location, the health of the local economy, and the demand from renters are the key factors that shape what a typical GRM looks like in that area.
High-Growth Urban Markets: In booming cities with climbing property values and strong job markets, you’ll often see higher GRMs, sometimes 10-15 or even more. Investors in these areas are often willing to pay more upfront, betting that long-term appreciation will drive their returns, not just the monthly rent checks.
Stable Suburban Markets: These neighborhoods tend to have more moderate GRMs, usually in the 8-12 range. The balance between the purchase price and rental income is a bit more even here, attracting investors who want a blend of decent cash flow and steady, reliable growth.
Cash-Flow Focused Markets: In smaller towns or less competitive areas, the name of the game is immediate income. This is where you'll find the lowest GRMs, often in the 4-7 range. These properties are priced low compared to the rent they bring in, making them potential cash-flow machines.
Key Takeaway: A lower GRM generally means the property has the potential to pay for itself faster from gross rental income. That makes it a magnet for investors focused on cash flow. But you must compare it to local averages to know if you've found a diamond in the rough or a sign of trouble.
To help illustrate this, here’s a look at how GRM ranges can vary.
Typical GRM Ranges by Market Type
| Market Type | Typical GRM Range | Investor Expectation |
|---|---|---|
| Tier 1 (e.g., NYC, LA) | 12 - 20+ | High appreciation, low initial cash flow |
| Tier 2 (e.g., Austin, Denver) | 10 - 15 | Strong appreciation, modest cash flow |
| Tier 3 (e.g., Indianapolis, Kansas City) | 7 - 11 | Balanced appreciation and cash flow |
| Rural / Small Town | 4 - 8 | High cash flow, low appreciation potential |
As you can see, what’s considered "good" is completely relative. An investor chasing appreciation won't flinch at a GRM of 15 in a top-tier city, while a cash-flow buyer would run the other way.
How to Benchmark Against the Local Market
Your goal isn't just to find a property with a low GRM. It's to find one with a GRM that's better than the average for that specific neighborhood. If most duplexes down the street are trading at a GRM of 10, finding a comparable one at 8 is a serious signal to dig deeper. It could mean the property is underpriced or pulls in higher-than-average rent.
So, how do you find those local benchmarks?
- Analyze Comps: Pull the data on similar, recently sold properties in the area and calculate the GRM for each one.
- Talk to a Pro: A good local real estate agent who specializes in investment properties can tell you the typical GRM ranges off the top of their head.
- Use Data Tools: Real estate platforms can often provide the market-level data you need to establish a solid baseline for comparison.
When you're looking at deals across different cities, the GRM becomes a handy tool to compare them on a more level playing field. Historical data shows that while strong rental markets can see GRMs as low as 5 to 8, you might see numbers well over 15 in softer markets. A figure that falls way outside the local norm is a flag—it could signal an overpriced dud or a seriously undervalued gem. To learn more about how pros use these benchmarks, you can find great insights on multifamily investments from industry experts.
At the end of the day, a "good" GRM is just a starting point. It’s the first clue that tells you a property is worth a closer look, but it’s far from the final word. To really understand if a deal will make you money, you have to look at metrics that account for all the expenses. For a truly complete picture, you also need to understand what is a good cash-on-cash-return, which will complement your initial GRM screening.
The Hidden Dangers of Relying Only on GRM
The Gross Rent Multiplier's biggest strength is its stunning simplicity. That’s what makes it so popular. With just two numbers—price and gross rent—you can quickly sift through dozens of listings and get a feel for which properties might be a bargain. It's the perfect back-of-the-napkin tool for that initial gut check, helping you decide which deals are worth a deeper dive and which you can toss aside.
But that simplicity comes at a cost. Relying only on GRM to make an investment decision is a lot like buying a car just because you love the paint job. It might look great on the surface, but it tells you nothing about what’s going on under the hood—and that’s where the expensive surprises always hide.
The GRM has one massive, glaring blind spot: it completely ignores a property's operating expenses.
The Achilles' Heel of Gross Rent Multiplier
When you calculate the GRM, you’re only looking at the gross annual rent. This is the absolute top-line income a property could theoretically generate, before a single penny is spent keeping the lights on and the toilets flushing. The metric completely overlooks every cost associated with actually owning and running a rental.
This means the GRM is blind to the real-world expenses that make or break your cash flow, including:
- Property Taxes: A huge and unavoidable cost that can vary wildly from one town to the next, or even one side of the street to the other.
- Insurance: Protecting your investment is non-negotiable, and premiums are influenced by everything from a building's age and construction type to its location.
- Maintenance and Repairs: Every landlord knows things break. From leaky faucets to replacing a whole roof, these costs are a guarantee, and older properties almost always come with a longer list of surprise repairs.
- Property Management Fees: If you hire a pro to handle the day-to-day headaches, their fee (usually 8-10% of the monthly rent) comes right off the top.
- Vacancy Costs: The GRM operates in a fantasy world where your property is rented 100% of the time. In reality, every month a unit sits empty is a month you're losing money.
Because it ignores these crucial details, the GRM can only tell you about a property's potential value, not its actual profitability. You can easily have two properties with the exact same GRM that produce wildly different results for your bank account.
Key Insight: The Gross Rent Multiplier is a tool for comparing price to potential income. It is not a tool for measuring profitability. A low GRM is simply an invitation to investigate further, not a guarantee of a good deal.
Let's walk through a real-world scenario to see just how misleading the GRM can be.
An Eye-Opening Tale of Two Duplexes
Imagine you're comparing two duplexes for sale in the same city. At first glance, they look like twins from a GRM perspective.
Duplex A: The Modern Build
- Purchase Price: $400,000
- Gross Annual Rent: $40,000
- Gross Rent Multiplier: 10 ($400,000 / $40,000)
Duplex B: The Historic Charmer
- Purchase Price: $400,000
- Gross Annual Rent: $40,000
- Gross Rent Multiplier: 10 ($400,000 / $40,000)
Based on the GRM, it's a dead heat. An inexperienced investor might flip a coin and call it a day. But now, let's pull back the curtain and look at what it actually costs to run these two places.
| Expense Category | Duplex A (Modern Build) | Duplex B (Historic Charmer) |
|---|---|---|
| Property Taxes | $5,000 | $4,500 |
| Insurance | $1,500 | $2,500 (older wiring/plumbing) |
| Maintenance & Repairs | $2,000 (newer systems) | $8,000 (aging roof, old HVAC) |
| Total Expenses | $8,500 | $15,000 |
All of a sudden, the story changes completely. Duplex B, the "historic charmer," costs an extra $6,500 every single year just to keep it running. While its taxes are a little lower, the higher insurance and constant maintenance needs chew up a massive chunk of the rental income.
To see the real financial picture, we need to calculate their Net Operating Income (NOI), which is simply Gross Rent minus all those Operating Expenses.
- Duplex A (Modern): $40,000 - $8,500 = $31,500 NOI
- Duplex B (Historic): $40,000 - $15,000 = $25,000 NOI
Even with the same price and the same rent, Duplex A is dramatically more profitable. Before you even think about a mortgage payment, it puts an extra $6,500 in your pocket each year. This is the hidden trap of the GRM. It can make a money pit look just as good as a cash-cow. That’s why you must always look past this first-glance metric and dig into the real numbers before you ever think about making an offer.
GRM vs. Cap Rate: Choosing the Right Tool for the Job
Think of the Gross Rent Multiplier as a quick scan across a crowded room. It helps you spot a few interesting prospects from a distance. It's fast, it's easy, and it gets the initial sorting done.
But once you've picked someone out, you need to walk over and have a real conversation. For real estate investors, that "real conversation" is the capitalization rate, or cap rate.
While the GRM is your wide-angle lens for scanning the landscape, the cap rate is the zoom lens you use to inspect the critical details. It pushes past the surface-level picture of gross rent and gets right to the heart of what matters: actual profitability.
The Power of Net Operating Income
The secret ingredient that makes the cap rate so powerful is a little metric called Net Operating Income (NOI). Unlike gross rent, which pretends the costs of ownership don't exist, NOI shows you how much cash a property really generates after paying its bills.
The formula is refreshingly simple:
Net Operating Income (NOI) = Gross Rental Income - Operating Expenses
Operating expenses are all the non-negotiable costs of keeping the lights on—things like property taxes, insurance, maintenance, property management fees, and maybe some utilities. By subtracting these from your gross income, you get a number that reflects the property’s true earning potential.
With your NOI in hand, calculating the cap rate is just one more easy step.
Capitalization Rate = Net Operating Income / Property Price
The result is a simple percentage that tells you the property's potential annual return if you bought it with all cash. It’s a direct measure of profitability that GRM can’t even begin to touch. Generally, a higher cap rate points to a more profitable investment.
GRM and Cap Rate: A Side-by-Side Comparison
Let's bring back our duplex example to see just how differently these two metrics see the same property. It’s a perfect way to show why you need both.
- Property Price: $400,000
- Gross Annual Rent: $53,333
- Annual Operating Expenses: $26,666 (we're using the 50% rule for a quick estimate)
First, the quick-and-dirty GRM calculation for our initial screening.
- GRM Calculation: $400,000 / $53,333 = 7.5
A GRM of 7.5 looks pretty decent in a lot of markets. It’s a green light to dig deeper. So, let’s pull out the cap rate magnifying glass.
- Calculate NOI: $53,333 (Gross Rent) - $26,666 (Expenses) = $26,667
- Calculate Cap Rate: $26,667 (NOI) / $400,000 (Price) = 0.0667, or 6.67%
See the difference? The GRM of 7.5 gives you a fast valuation benchmark, while the 6.67% cap rate gives you a much clearer picture of its profitability. This is why seasoned investors and lenders use both—GRM for fast market-level comparisons, and cap rate for the serious underwriting that follows. You can find more great insights on this topic on Stessa's real estate blog.
The Blind Spot of GRM, Visualized
If you're still wondering why GRM can be misleading on its own, this image says it all.
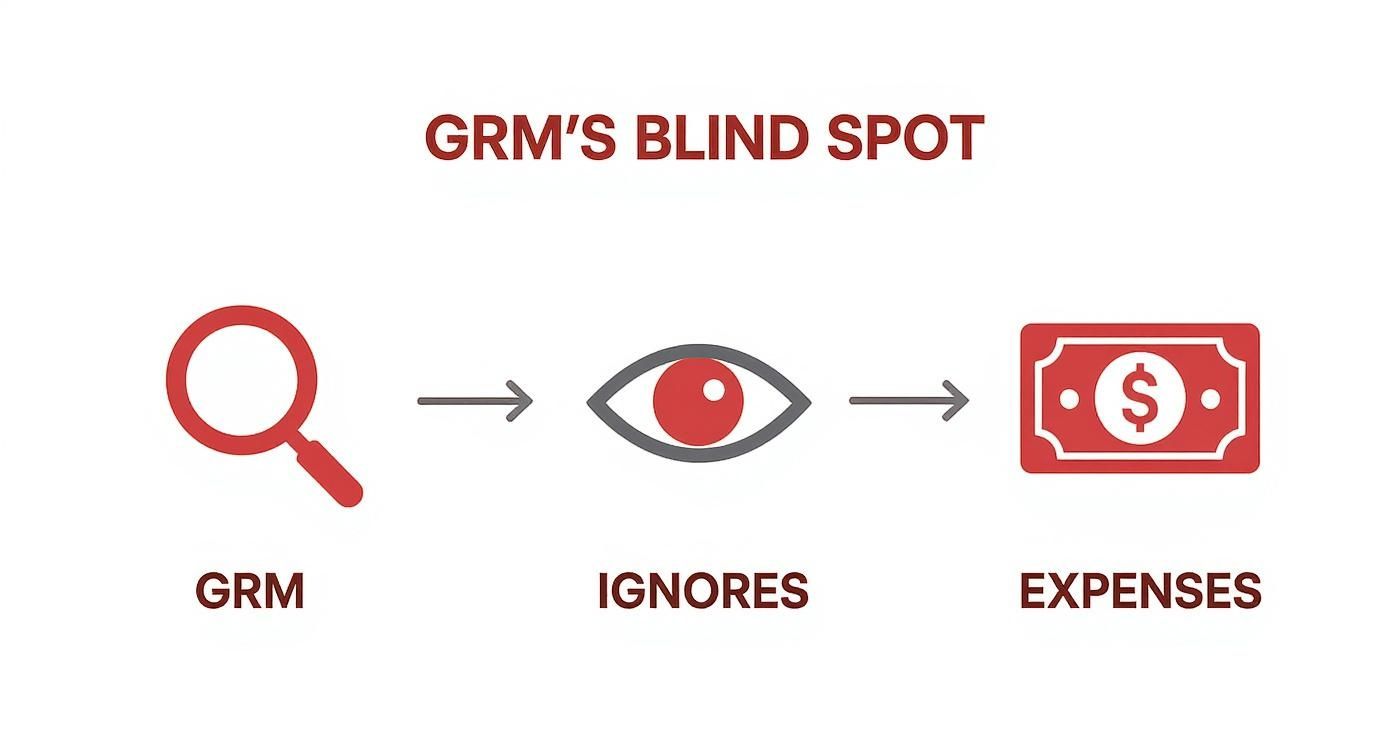
This simple diagram drives home the main point: the Gross Rent Multiplier is designed to be blind to the operating expenses that make or break a deal.
At the end of the day, the two metrics answer two very different questions. GRM asks, "How many years of gross rent does it take to pay for the property?" It's a valuation tool. The cap rate asks, "What is my potential un-levered return on this investment?" It's a profitability tool.
To really master this essential metric, check out our complete guide on how to calculate cap rate for any investment property. Using them together is the mark of a savvy investor who knows exactly when to zoom out and when to zoom in.
How to Automate Your Investment Analysis
Let’s be honest, manual calculations are a huge drag. They’re slow, tedious, and—worst of all—it’s way too easy to make a costly mistake. I've seen it happen: a misplaced decimal in a spreadsheet turns what looked like a home run into a serious financial headache. This is exactly why savvy investors don't waste time wrestling with calculators anymore.
Instead of getting bogged down in formulas, you can automate the entire initial screening process. Platforms like Property Scout 360 are built to do the number-crunching for you, instantly calculating the Gross Rent Multiplier for any property you find. This frees you up to do what really matters: think strategically about the deal.
Get Instant Clarity with Property Scout 360
The real magic happens when you see the GRM in context, right alongside other critical metrics. A good analysis dashboard tells you the whole financial story at a glance.
Take a look at how Property Scout 360 lays out the key data points for a quick, clear evaluation.

As you can see, the Gross Rent Multiplier is sitting right next to the Cap Rate and projected Cash Flow. This setup allows for an immediate, well-rounded assessment of the property's potential.
This isn’t just a time-saver; it’s about making smarter, more confident decisions. In seconds, you can see how a property's price tag lines up with its earning potential. An automated approach ensures you never miss a great opportunity or, just as importantly, overlook a red flag buried in the numbers.
When you automate your initial screening with a tool that calculates the Gross Rent Multiplier and other key metrics, you can analyze 10x more properties in the same amount of time. That dramatically increases your odds of finding a true winner.
Ultimately, automation changes the game. It takes hours of frustrating spreadsheet work off your plate and replaces it with a clear, data-driven overview. This lets you move quickly and decisively in a market where speed matters.
Got Questions About GRM? Let's Clear Them Up.
Even after you get the hang of the Gross Rent Multiplier, a few common questions always seem to pop up. Think of this as tying up the loose ends, making sure you can use this metric with total confidence out in the field.
We'll dive into the nuances of using GRM for different kinds of properties and nail down some best practices.
Can I Use GRM for Commercial Properties?
You could, but you probably shouldn't. While you can technically run the numbers on an office building or a retail strip, GRM really shines when you're looking at residential real estate—from single-family rentals to small apartment buildings.
Why the distinction? It comes down to how the money works in commercial deals.
- Leases are a different beast: Commercial leases, especially the common triple net (NNN) lease, are much more complex. With a NNN lease, the tenant is on the hook for property taxes, insurance, and maintenance, which are three of the biggest line-item expenses for a landlord.
- "Gross" means something else: Because tenants cover those major costs, the "gross" rent from a commercial property doesn't tell you the same story about income potential as it does for a duplex where the landlord pays those bills.
When you're sizing up a commercial deal, you're much better off using metrics like Cap Rate or Cash-on-Cash Return. They’re built around Net Operating Income (NOI), which gives you a far more honest picture of a property's profitability after its unique expenses are factored in.
Monthly or Annual Rent? A Classic Mix-Up
This is a big one. If you get this wrong, your comparisons will be completely useless. For GRM, you must always use the gross annual rent. Using the monthly number will throw your calculation way off.
Let's see just how different the results are.
- Property Price: $300,000
- Gross Monthly Rent: $2,500
- Gross Annual Rent: $30,000 ($2,500 x 12)
Now, watch what happens when we calculate the GRM both ways:
- The Right Way (Annual): $300,000 / $30,000 = a GRM of 10
- The Wrong Way (Monthly): $300,000 / $2,500 = a GRM of 120
That's not a small difference—the incorrect monthly calculation gives you a number that’s 12 times higher. The industry standard is annual, so stick with it. This way, you can be sure you're comparing apples to apples when looking at different deals or market data.
What About Vacancy? Does GRM Account for It?
This question zeroes in on one of GRM’s most important limitations. The simple answer is no—the Gross Rent Multiplier formula completely ignores vacancy. It’s calculated as if the property will be 100% occupied, all year, every year.
Remember, the "G" in GRM is for "Gross." That means it’s a quick snapshot taken before you subtract real-world costs like vacancies and other operating expenses.
This is exactly why GRM is a first-pass screening tool, not the final word on a deal's profitability. It shows you the property's income potential in a perfect world.
Later, when you're doing a deeper dive with metrics like Cap Rate, you'll absolutely pencil in a vacancy rate—often 5-10% of gross rent—to get a more realistic Net Operating Income. For that initial gut check, though, GRM keeps it simple by leaving vacancy out.
Stop drowning in spreadsheets and start making smarter, faster investment decisions. Property Scout 360 gives you instant access to GRM, cap rate, cash flow, and dozens of other critical metrics for any U.S. property. Find your next profitable rental in minutes, not weeks. Get started with Property Scout 360 for free.
About the Author
Related Articles
2026 Investor's Guide: Cost of Installing a Sewer Clean Out
Understand the cost of installing a sewer clean out for investment properties in 2026. Get expert advice on prices, ROI, & budgeting for flips. Plan smart!
15 Year vs 30 Year Mortgage: The Investor's Choice
Deciding between a 15 year vs 30 year mortgage for a rental property? Our guide analyzes cash flow, ROI, and equity to help you pick the best loan.
Real Estate Appraisal Software: Features & Limits
Discover what real estate appraisal software is, its core features, and limits. See how it differs from investment tools for profitable deals.