How to Calculate ROI on Rental Property to Maximize Your Profits
Learn how to calculate ROI on rental property with our guide. We cover key formulas like cash-on-cash return and NOI to help you make smarter investments.
Before you can run the numbers on a potential rental, you need a target in mind. What does a "good" return on investment actually look like?
For most rental properties, a solid total ROI—that's the combination of cash flow from rent and the property's appreciation—lands somewhere between 8% and 12% per year. This is the range many seasoned investors use as a benchmark.
What Is a Good ROI for a Rental Property?
The truth is, there's no single magic number for a "good" ROI. The right target for you really depends on your market, how much risk you're comfortable with, and what you’re trying to achieve with your investment.
Are you looking for immediate, predictable cash flow to supplement your income? You'll probably aim for a higher percentage. Or are you playing the long game, banking on appreciation in an up-and-coming area? In that case, you might be okay with a lower initial return, knowing the real payoff comes later.
To make an informed decision, you need to get comfortable with the core metrics that tell the full story of a property's financial health. These are the numbers that will help you confidently evaluate any deal that comes across your desk.
Key ROI Metrics at a Glance
To truly understand a property's potential, you need to look at it from a few different angles. The table below breaks down the must-know metrics, what they measure, and how to calculate them.
| Metric | What It Measures | Simple Formula |
|---|---|---|
| Net Operating Income (NOI) | Your property's profitability before mortgage and taxes. | Gross Rental Income - Operating Expenses |
| Capitalization (Cap) Rate | The potential return if the property was bought with cash. | (NOI / Property Price) x 100 |
| Cash-on-Cash Return | The return on the actual cash you've invested out-of-pocket. | (Annual Pre-Tax Cash Flow / Total Cash Invested) x 100 |
Each of these metrics provides a unique piece of the puzzle. Relying on just one can give you a skewed perspective, which is a common trap for new investors.
A high Cap Rate might seem fantastic on paper, but if your mortgage terms are unfavorable, your actual Cash-on-Cash Return could be disappointingly low. You have to look at all the numbers together to see the complete picture.
Setting Realistic Benchmarks
So, is that 8% to 12% ROI benchmark achievable in 2025? Absolutely, especially if you're targeting strong U.S. markets where you can get a healthy mix of rental income and property appreciation.
Let's look at a quick, real-world example. Imagine you buy a single-family home in a stable market like Memphis, Tennessee, for $180,000. It rents for $1,080 a month. After accounting for all your operating expenses, your cash-on-cash return might work out to be around 7.2%. That’s a solid start.
But don't forget appreciation. If the property value increases by a conservative 3% that year—a reasonable expectation in many growing cities—your total ROI for the year jumps to a very healthy 10.2%.
Ultimately, you're looking for that sweet spot. The great thing about real estate is that you have some control. By finding ways to optimize your rent and keeping a close eye on expenses, you can directly influence these numbers and push your returns higher.
With this foundation, you're ready to start crunching the numbers yourself.
Calculating Net Operating Income: The Heart of Your ROI
Before you can get to the exciting ROI numbers, you first have to nail down your Net Operating Income, or NOI. Think of NOI as the raw, unfiltered profitability of a property itself, completely separate from how you choose to finance it. Getting this number right is the single most important step you'll take to calculate ROI on a rental property because every other metric flows from it.
To really get a grip on NOI, you have to understand the difference between gross and net figures. You'll start with all the money the property could make, then start subtracting all the costs required to keep it running.
From Potential Rent to Realistic Income
First things first, let’s figure out the Gross Potential Rent. This is simply what you'd collect in a perfect world where the property is rented out every single day of the year. If you have a single-family home that rents for $2,000 a month, your Gross Potential Rent is a straightforward $24,000 for the year.
But we don't invest in a perfect world. Properties have vacancies. To be safe, I always budget for this. A vacancy rate between 5% and 10% is a realistic starting point, though this can vary wildly depending on your local market. When you subtract that potential loss, you get your Effective Gross Income (EGI).
- Gross Potential Rent: $24,000
- Vacancy Loss (at 8%): -$1,920
- Effective Gross Income: $22,080
This EGI of $22,080 is your real-world starting line. If you collect other income, like pet fees or coin-operated laundry, be sure to add that in here, too.
This handy flowchart shows how your NOI calculation feeds directly into the bigger ROI picture.
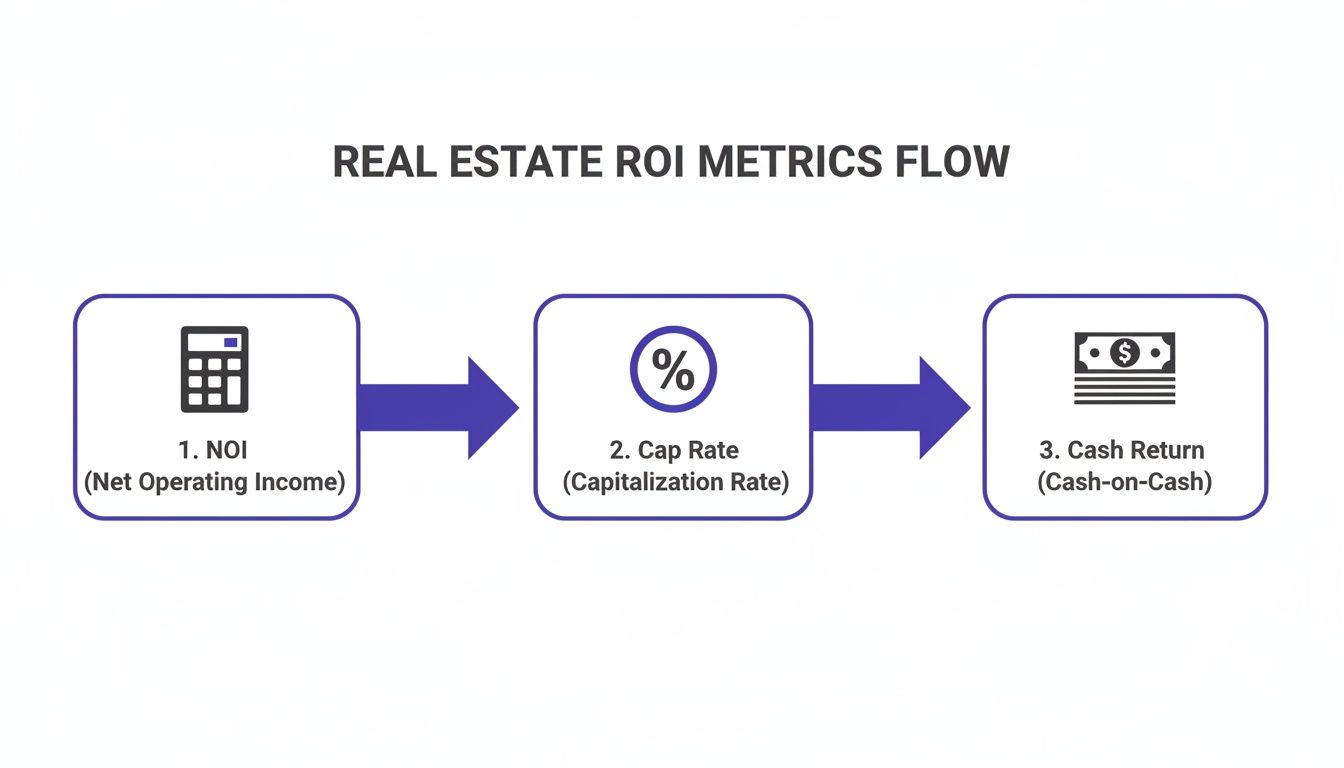
As you can see, a solid NOI is the foundation you need before you can even think about Cap Rate or your actual cash return.
Detailing Your Operating Expenses
Now that you have a realistic income figure, it’s time to subtract your operating expenses. This is where so many new investors trip up—they underestimate or completely forget major costs, which throws off all their projections. Don't make that mistake.
Your operating expenses are all the day-to-day costs of owning the property. It's critical to remember that this does not include your mortgage payment (the principal and interest). That’s a financing cost, not an operational one, and it gets factored in later.
Here are the costs you absolutely must account for:
- Property Taxes: What the city or county charges you annually.
- Property Insurance: Your landlord or hazard insurance policy.
- Repairs & Maintenance: For everything from a leaky faucet to a broken doorknob. Budgeting 1% of the property’s value each year is a common rule of thumb.
- Property Management Fees: If you hire a pro, expect to pay 8-12% of the collected monthly rent.
- Utilities: Any bills you cover as the landlord, like water, sewer, or trash.
- HOA Fees: A mandatory cost if the property is in a managed community.
- Capital Expenditures (CapEx): This is the big one people forget. You need to set aside money for major future replacements like a new roof, HVAC system, or water heater.
Forgetting to save for CapEx is one of the quickest ways to see your "profitable" investment turn into a money pit. A sudden $10,000 roof replacement can instantly wipe out years of cash flow if you haven't been putting money aside for it.
Bringing It All Together
Let's put the finishing touches on the NOI calculation for our example property. We started with an Effective Gross Income of $22,080. After doing some homework on local costs, here's what we project for annual expenses:
| Expense Category | Annual Cost |
|---|---|
| Property Taxes | $3,500 |
| Insurance | $1,200 |
| Repairs & Maintenance | $2,000 |
| CapEx Reserves | $1,800 |
| Total Operating Expenses | $8,500 |
The final calculation is simple:
NOI = Effective Gross Income - Total Operating Expenses
NOI = $22,080 - $8,500 = $13,580
This $13,580 is the magic number. It’s the annual profit the property generates on its own, before you account for any loans. This is the figure you’ll use to calculate your Cap Rate and it's a critical piece of the cash flow puzzle. If you want to go deeper, we have a complete guide on how to calculate cash flow on a rental property.
Remember, market forces like rent growth can have a huge impact on your NOI over time. A strong rental market means your income side of the equation gets a boost, which makes accurate expense tracking even more vital for projecting your true financial picture.
Using ROI Formulas Like Cash-on-Cash Return and Cap Rate
Once you've nailed down a solid Net Operating Income (NOI), you're ready to get to the good stuff. This is where we move past simply knowing if a property makes money and start figuring out how hard that money is working for you. It’s all about translating that NOI into a few key performance metrics.
For any serious investor, two formulas are absolutely essential: the Capitalization Rate (Cap Rate) and the Cash-on-Cash Return.
Think of them as two different lenses for looking at the same deal. Each gives you a unique perspective, and you absolutely need both to properly calculate the ROI on your rental property and make a smart decision.
Measuring Raw Potential with the Capitalization Rate
First up is the Cap Rate. This is your go-to metric for quickly comparing the raw, unleveraged earning potential of different properties. In plain English, it tells you what the return would be if you walked in and bought the property with a briefcase full of cash.
This is a fantastic tool because it completely ignores financing. By taking loans out of the picture, you get a clean, apples-to-apples comparison of one property's income potential versus another's.
The formula couldn't be simpler:
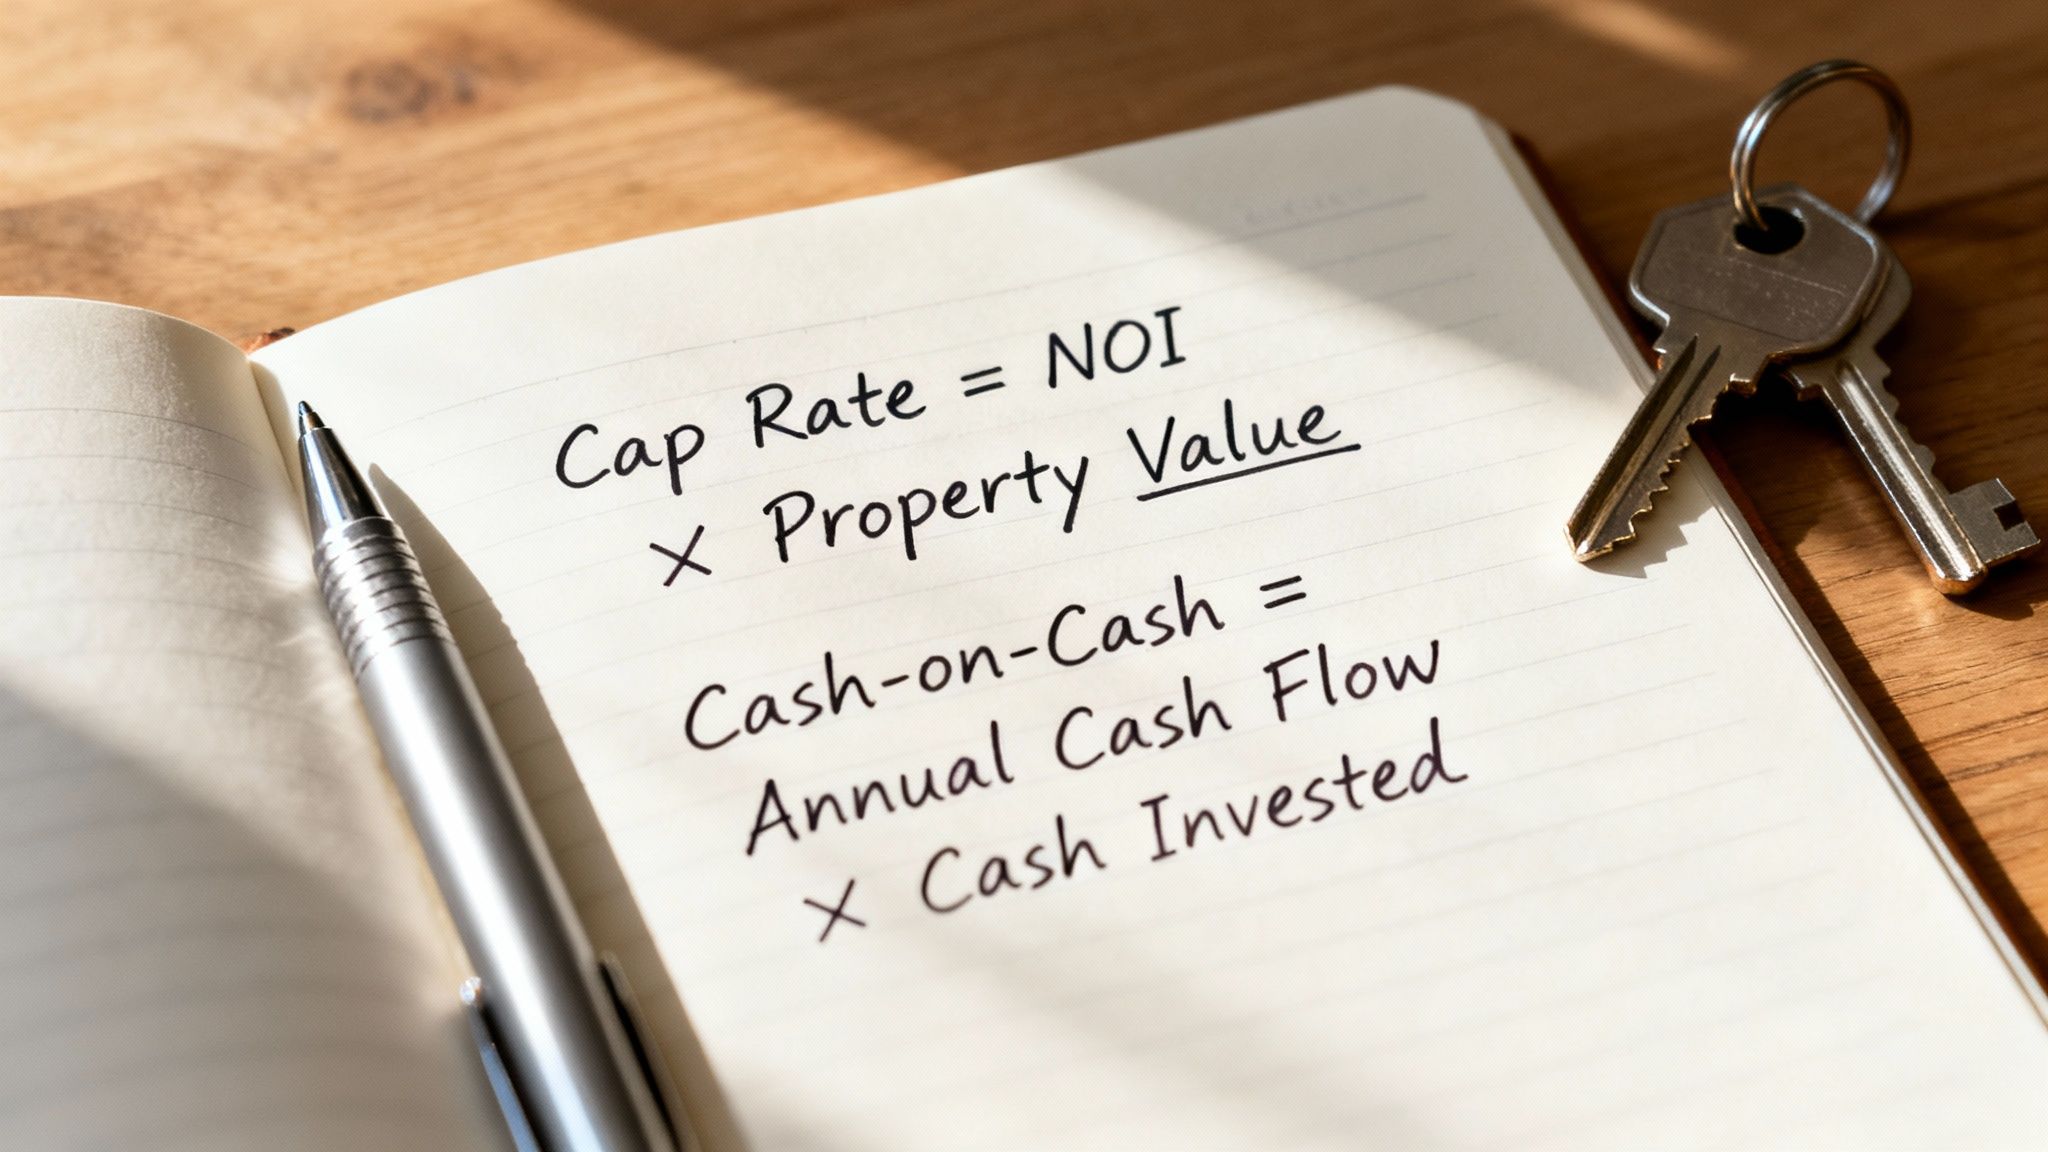
Cap Rate = (Net Operating Income / Property Value or Purchase Price) x 100
Let’s go back to our example property. We calculated an NOI of $13,580, and the purchase price is $250,000.
- Cap Rate = ($13,580 / $250,000) x 100 = 5.43%
A 5.43% Cap Rate means the property is set to generate a 5.43% return on its total value in one year, before you factor in any mortgage payments. As a market indicator, a higher cap rate can sometimes signal a riskier investment, while a lower cap rate often points to a more stable (and usually more expensive) area.
Calculating Your Actual Return with Cash-on-Cash
If Cap Rate is about a property's potential, Cash-on-Cash Return is all about your personal reality. For most of us using a loan to buy, this is the number that truly matters. It answers the most important question: "What return am I getting on the actual cash I took out of my bank account?"
To figure this out, you first need your Annual Pre-Tax Cash Flow. That’s just your NOI with your total annual mortgage payments (your debt service) subtracted from it.
Let's see how this plays out with our $250,000 property, but this time, with financing:
- Down Payment (20%): $50,000
- Closing Costs (3%): $7,500
- Initial Rehab/Repairs: $2,500
- Total Cash Out of Pocket: $60,000
We'll finance the remaining $200,000. With a 6.5% interest rate on a 30-year mortgage, the yearly principal and interest payments come out to about $15,170.
Now, let's calculate the cash flow:
- NOI: $13,580
- Annual Mortgage Payment: -$15,170
- Annual Pre-Tax Cash Flow: -$1,590
This is a crucial lesson every new investor learns the hard way. On paper, this deal is cash-flow negative. It happens, especially when interest rates are high. To make the math clearer for this guide, let’s imagine the property had a stronger NOI of $18,000.
Revised Scenario:
- NOI: $18,000
- Annual Mortgage Payment: -$15,170
- Annual Pre-Tax Cash Flow: $2,830
That's better. Now we have positive cash flow and can calculate our return.
Cash-on-Cash Return = (Annual Pre-Tax Cash Flow / Total Cash Invested) x 100
Cash-on-Cash Return = ($2,830 / $60,000) x 100 = 4.72%
That 4.72% is the real-world return on your invested capital. It shows you exactly what your $60,000 is earning you each year.
Why You Need to Use Both Metrics
So, why bother with two formulas? Because looking at just one can seriously mislead you.
Imagine you're comparing two deals:
- Property A: Has a fantastic 8% Cap Rate but it’s in a challenging area with high turnover. Once you factor in your loan and higher operating costs, your Cash-on-Cash Return is only 3%.
- Property B: Has a more modest 5.5% Cap Rate but it's in a prime location. With a good loan, your Cash-on-Cash Return is an impressive 9%.
If you were only chasing a high Cap Rate, you'd pick Property A and leave money on the table. In reality, Property B puts far more cash in your pocket relative to what you invested.
This table really drives home how much financing changes the game for the exact same property. Let's assume a $300,000 purchase price and a $20,000 NOI.
Cash Purchase vs. Financed Purchase ROI Comparison
| Metric | Scenario 1 All-Cash Purchase | Scenario 2 Financed Purchase (20% Down) |
|---|---|---|
| Total Cash Invested | $300,000 (plus closing) | $60,000 (plus closing) |
| NOI | $20,000 | $20,000 |
| Cap Rate | 6.67% | 6.67% (Unaffected by financing) |
| Annual Mortgage | $0 | ~$18,204 (on a $240k loan at 6.5%) |
| Annual Cash Flow | $20,000 | $1,796 |
| Cash-on-Cash Return | 6.67% | ~3.0% (Varies with loan terms) |
This side-by-side view shows the incredible power of leverage. In Scenario 2, the investor used the bank's money to control a $300,000 asset with only $60,000 of their own cash. Even though the annual cash flow is lower after the mortgage, they now have $240,000 left over to buy more properties. This is how you scale a portfolio—it’s a fundamental concept in building real estate wealth.
How to Calculate Total ROI for a Complete Financial Picture
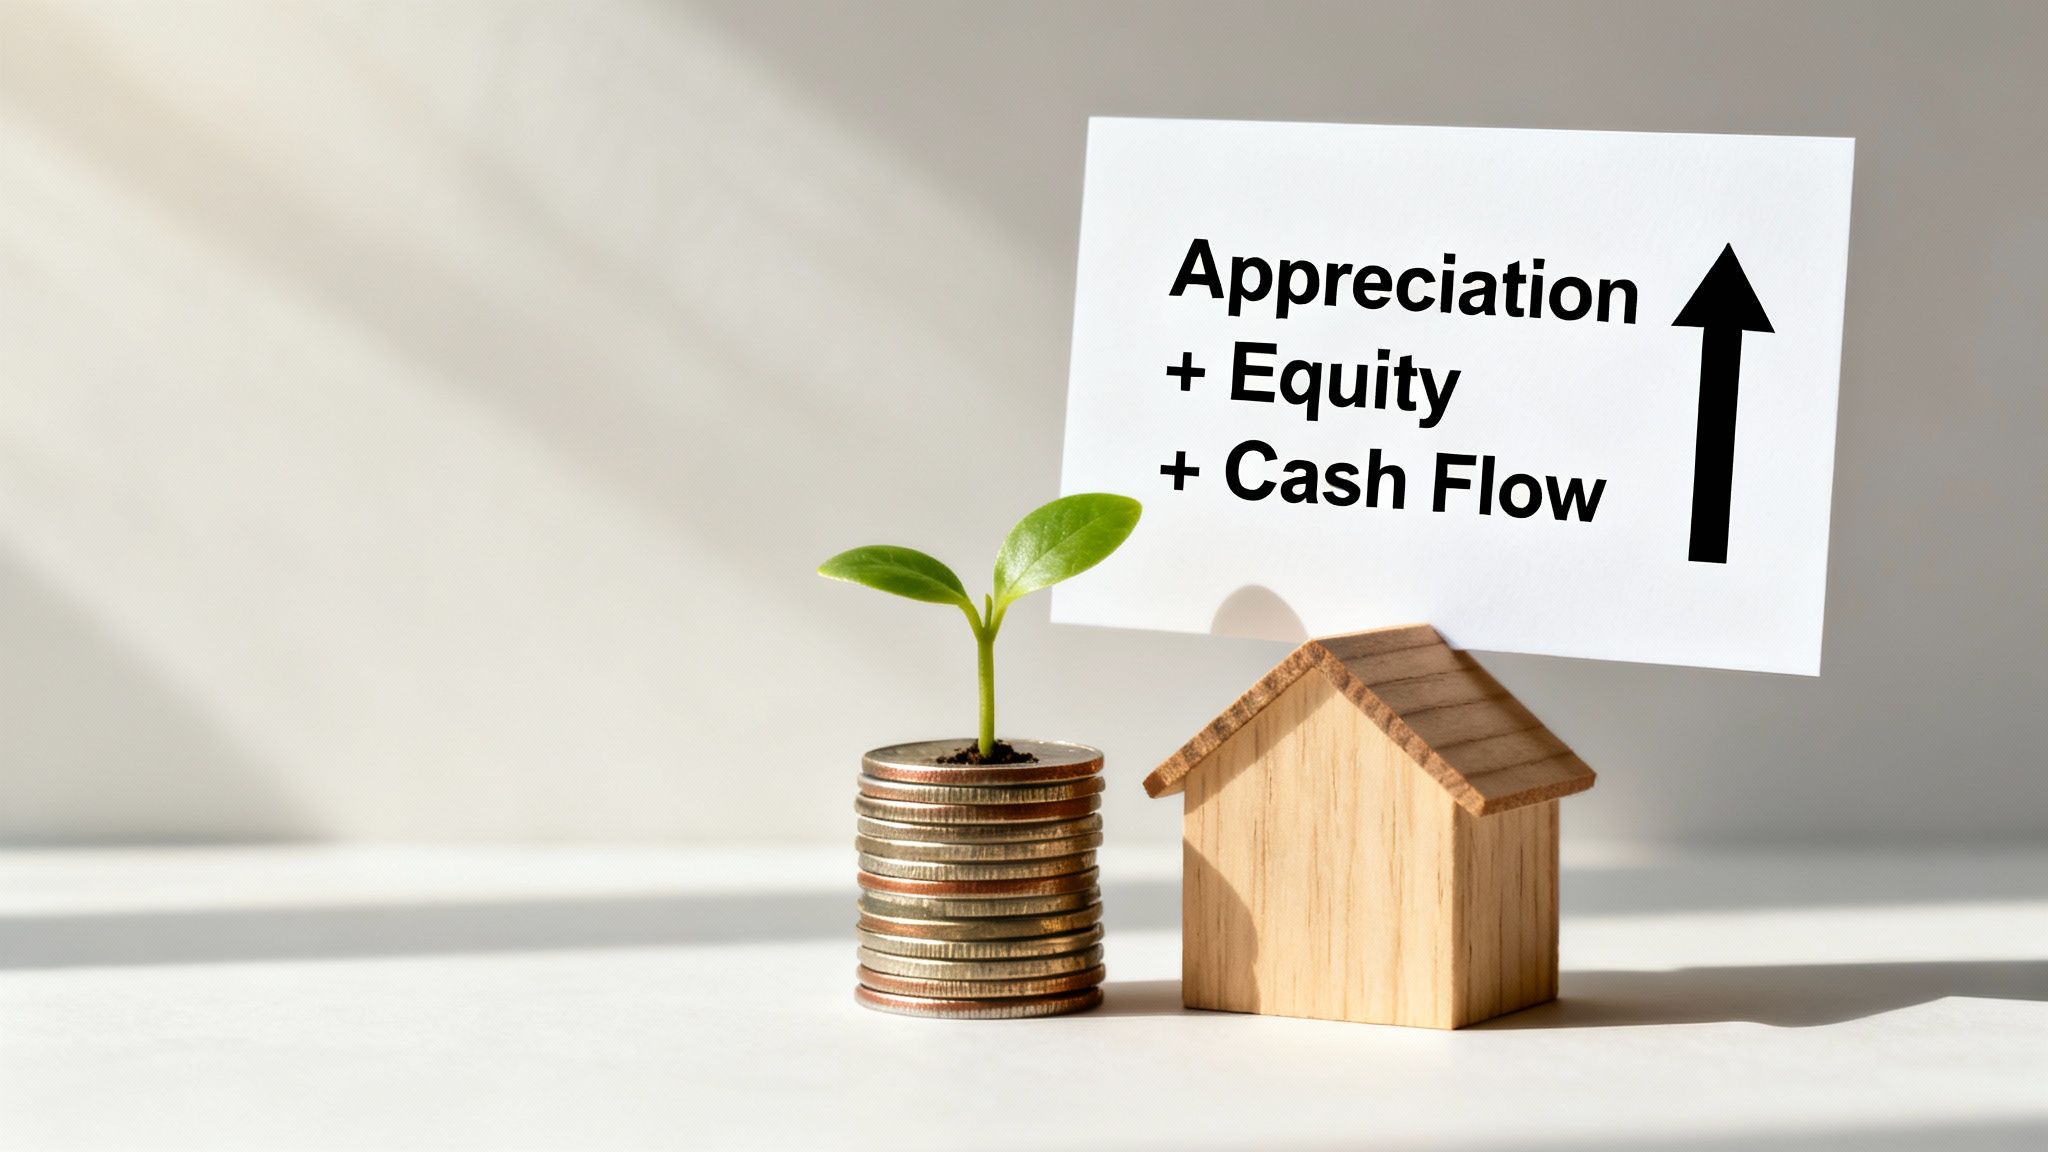
Cash flow metrics like cash-on-cash return are great for checking the pulse of your property year after year. But if that’s all you track, you're missing the two biggest reasons people get into real estate in the first place: appreciation and equity.
To really see how your investment is performing, you need to zoom out and look at the Total ROI. This metric is the real deal—it combines every way your property makes you money into one powerful number, giving you a true snapshot of how your net worth is growing.
The formula itself is straightforward and builds on what we’ve already covered.
Total ROI = (Total Profit / Total Cash Invested) x 100
Where Total Profit = (Total Cash Flow + Appreciation + Equity from Loan Paydown)
Let's unpack those new pieces to see how they come together to paint the full picture of your investment’s success.
Factoring in Property Appreciation
Appreciation is simply the increase in your property’s market value over time. It’s never a guarantee, but it’s a massive wealth-builder. For your Total ROI calculation, you'll need to project this growth, but it's crucial to be realistic.
Don’t just pull a number out of thin air. Look at the historical appreciation rates for the specific neighborhood over the last 5-10 years. I always tell new investors to stick with a conservative annual rate of 2-4% for projections, even if the market has been on fire recently. It's better to be pleasantly surprised than disappointed.
Accounting for Equity from Your Mortgage
Here’s a part of the return that many investors forget. Every single time you make a mortgage payment, a chunk of it pays down your loan principal. This is called amortization, and it directly increases your equity—the part of the property you actually own. Think of it as a forced savings account that builds your wealth on autopilot.
Your lender gives you an amortization schedule that shows exactly how much principal you pay down each year. Sure, in the early years of a 30-year loan, a lot goes to interest, but you're still building equity with every check you write.
Putting It All Together: A 5-Year Example
Let’s go back to our financed property example and calculate the 5-Year Total ROI.
The Setup:
- Purchase Price: $250,000
- Total Cash Invested: $60,000
- Loan Amount: $200,000 at 6.5% for 30 years
Now, let's project the returns over a five-year holding period.
Total Cash Flow: We already know the annual pre-tax cash flow is $2,830. Over five years, that adds up to $14,150.
Appreciation: Using our conservative 3% annual appreciation rate, the property's value climbs. After five years, that $250,000 property would be worth about $289,818. That's $39,818 in appreciation.
Equity from Loan Paydown: A quick look at an amortization schedule shows that after 60 payments (five years), the loan principal paid down is roughly $11,885.
With these numbers, we can find our total profit:
- Total Profit = $14,150 (Cash Flow) + $39,818 (Appreciation) + $11,885 (Equity) = $65,853
Finally, let’s plug that into our Total ROI formula:
- 5-Year Total ROI = ($65,853 / $60,000) x 100 = 109.76%
That’s an incredible return of almost 110% over five years. If you want to see the average annual return, just divide by five, which gives you a very impressive 21.95% per year. For a more detailed breakdown, you can use a https://propertyscout360.com/blog/real-estate-investment-calculator to model these scenarios automatically.
This is why looking at the whole picture is so important. An investment that seemed just okay with a 4.72% cash-on-cash return is actually a powerful wealth-building machine once you factor in appreciation and equity. Just remember, this growth has tax implications. It’s always smart to consult an ultimate guide to taxes on investment property to understand deductions and capital gains, which will affect your final numbers.
Watch Out for These Common ROI Calculation Traps
Even with the best formulas, your ROI calculations are only as good as the numbers you plug into them. A perfect spreadsheet means absolutely nothing if your assumptions don't hold up in the real world. This is the final gut check before you pull the trigger, ensuring your projected profits don’t vanish into thin air.
One of the biggest and most expensive mistakes I see investors make is dramatically underestimating what repairs and capital expenditures (CapEx) will actually cost. It’s so easy to walk through a property with fresh paint and think your maintenance budget will be next to nothing. That's a classic rookie mistake.
Trust me, there are always issues lurking beneath the surface. Never, ever skip a professional home inspection. That $500 you might be tempted to save could easily prevent you from buying into a $15,000 foundation problem that would torpedo your returns for years.
Don't Lean Too Heavily on Rules of Thumb
Quick screening shortcuts like the "50% Rule"—which assumes half your gross rent will be eaten up by operating expenses—are great for a first pass. They let you quickly weed out the obvious duds. But that's where their usefulness ends.
Treating a rule of thumb as your final number is a recipe for disaster. Think about it:
- Older Properties: A 60-year-old house will have far higher maintenance and utility costs than new construction, pushing expenses way past the 50% mark.
- High-Tax Areas: In some parts of the country, property taxes alone can gobble up 20-25% of your gross rent.
- HOA Fees: If you're buying a condo, the monthly HOA fee is a fixed cost you have to account for separately.
You have to do your own homework. Call a local insurance agent for a real quote. Look up the property’s actual tax history on the county assessor’s website. Get a written estimate from a local property manager. You need to ground your numbers in the reality of that specific property in that specific market, not a generic rule.
Accounting for the "Invisible" Expenses
Some of the heaviest costs are the ones that don't show up on a monthly statement. Forgetting these will paint a dangerously optimistic picture of a property's potential.
The number one offender here is the vacancy rate. No property stays rented 100% of the time, period. Even in a hot market, you have to budget for the downtime between tenants to clean, make repairs, and find a new qualified renter. A conservative 5-8% of your gross annual rent is a smart and safe number to plug in.
Another one is property management. Even if you plan to manage it yourself, you must include this fee in your calculations. Why? Because your time isn't free. Factoring in a standard 8-10% management fee forces the deal to stand on its own two feet. It proves the property is profitable and confirms the numbers still work if you ever decide to hand it off to a pro.
A deal is only a good deal if it works without your direct involvement. If the numbers fall apart the second you factor in a management fee, the investment is likely too thin to be sustainable long-term.
By sidestepping these common blunders, you can build a financial model that's both accurate and resilient. This is the kind of diligence that separates hopeful projections from real, data-driven investment decisions.
Got Questions About Rental Property ROI? We've Got Answers.
When you're digging into rental property numbers, questions always pop up. It's just part of the process. Let's tackle some of the most common ones I hear from investors trying to nail down their potential returns.
What’s a Good ROI for a Rental Property, Anyway?
This is the million-dollar question, isn't it? While there’s no single magic number, a solid industry benchmark to aim for is a total ROI between 8% and 12%. That figure is a mix of your cash flow and the property's appreciation over time.
But for most investors who are financing their deals, the more immediate and crucial metric is the cash-on-cash return. For that, a target between 6% and 10% is a healthy range.
Ultimately, "good" is personal. If you're playing the long game for wealth, you might stomach a lower initial cash flow in an area poised for major growth. On the other hand, if you need that monthly income now, you’ll want to hunt for properties with a higher cash-on-cash return in a more stable market.
How Do Taxes Change My ROI Calculation?
Taxes can completely change the game for your final take-home return. Property taxes are a straightforward operating expense you’ll bake into your Net Operating Income (NOI). But the real impact comes from income taxes and, more importantly, tax benefits.
This is where your accountant earns their keep. You can deduct a whole host of expenses, including:
- Mortgage interest
- Insurance, repairs, and management fees
- Property taxes
- Depreciation
Depreciation is the secret weapon. It’s a non-cash expense, meaning you don't actually spend the money, but you can still use it to lower your taxable income. This directly pumps up your after-tax ROI. Of course, when you sell, you'll have to reckon with capital gains tax. My advice? Always talk to a tax pro to get a clear picture of your after-tax returns.
The ROI formulas we've covered are pre-tax. A good deal on paper can become a fantastic one once you layer in the powerful tax advantages of owning real estate.
Should I Factor Appreciation into My ROI Calculation?
It depends entirely on what you're trying to measure. For some metrics, including appreciation is a huge mistake; for others, it's essential.
When you're calculating Cash-on-Cash Return or Cap Rate, the answer is a hard no. Don't do it. These metrics are all about the property's performance right now, based on its current income. Tossing in a guess about future value completely misses the point.
But when you zoom out to look at your Total ROI over a five-year hold, you absolutely have to include a conservative estimate for appreciation. It’s one of the biggest wealth-builders in real estate. The trick is to stay grounded—base your numbers on real historical data for that specific neighborhood, not some pie-in-the-sky market forecast.
Is There a Quick Way to Estimate ROI When I’m Just Browsing?
Absolutely. When you’re scrolling through dozens of listings, you need a quick filter to separate the contenders from the duds. Here are two back-of-the-napkin rules I use all the time.
The 1% Rule: This is your first gut check. Does the gross monthly rent hit at least 1% of the purchase price? A $250,000 property, for example, should bring in at least $2,500 a month to be worth a deeper dive.
The 50% Rule: This is a quick way to guesstimate your expenses. It assumes about half of your rental income will be eaten up by operating costs (this does not include your mortgage). It gives you a rough idea of your NOI in about ten seconds.
These are just filters, not a replacement for a full analysis. Their job is to help you quickly toss out the non-starters so you can pour your energy into the deals that actually have a shot.
Ready to stop guessing and start making data-driven investment decisions? Property Scout 360 eliminates the tedious spreadsheet work, giving you instant and accurate calculations for ROI, cash flow, and cap rate on any U.S. property. Run unlimited financing scenarios, compare deals side-by-side, and uncover the best investment opportunities in minutes. Find your next profitable rental at https://propertyscout360.com.
About the Author
Related Articles
2026 Investor's Guide: Cost of Installing a Sewer Clean Out
Understand the cost of installing a sewer clean out for investment properties in 2026. Get expert advice on prices, ROI, & budgeting for flips. Plan smart!
15 Year vs 30 Year Mortgage: The Investor's Choice
Deciding between a 15 year vs 30 year mortgage for a rental property? Our guide analyzes cash flow, ROI, and equity to help you pick the best loan.
Real Estate Appraisal Software: Features & Limits
Discover what real estate appraisal software is, its core features, and limits. See how it differs from investment tools for profitable deals.