How to Calculate Rental Income Like a Pro
Learn how to calculate rental income accurately with our guide. We break down NOI, cash flow, and cap rate with real-world examples to help you invest smarter.
Figuring out your rental income is pretty straightforward when you boil it down: take your total potential rent, then subtract all your operating expenses and vacancy costs to see what's really left. The trick is to look past the sticker price—that gross income number—and get to your Net Operating Income (NOI). That’s the figure that tells you what the property is actually earning.
Your Quick Guide to Rental Income Calculation
I see a lot of new investors make the same mistake. They look at a property that rents for $2,000 a month and immediately think, "Great, that's $24,000 a year!" While that math isn't wrong, it's dangerously incomplete. That simple multiplication completely ignores the real-world costs that eat into your profit margins. Learning how to calculate rental income the right way means tracking every single dollar it takes to keep that property up and running.
So, the first thing we need to do is get from a theoretical number to a real one. This boils down to understanding two core concepts:
- Gross Rental Income: Think of this as the absolute best-case scenario. It’s what your property could earn if it was rented 365 days a year with zero expenses. It's our starting line, but it's not the finish line.
- Net Operating Income (NOI): This is the number that actually matters to an investor. It’s the cash you have left after paying all the necessary operating expenses but before you've paid the mortgage.
This simple flowchart lays out the basic journey from that initial gross figure to your actual net income.
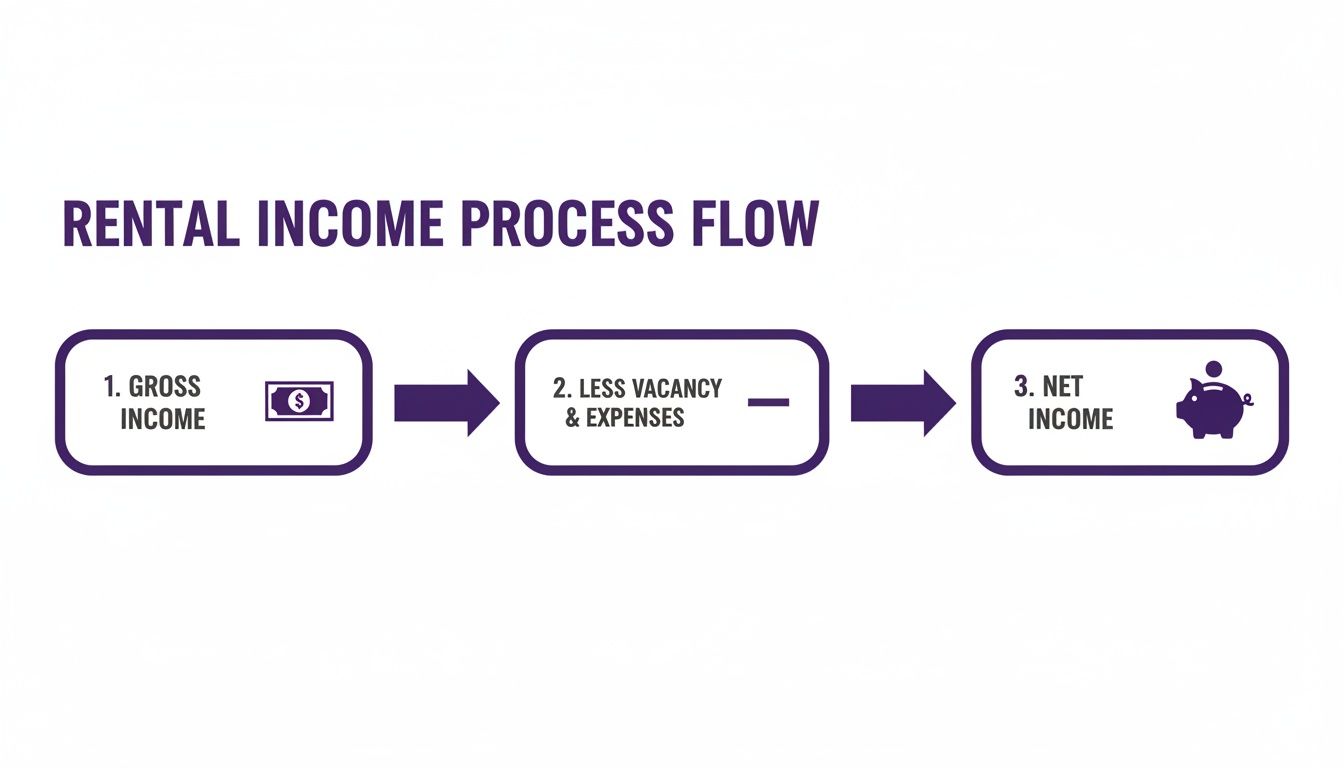
As you can see, your final take-home amount is always going to be less than what you started with. That's just the reality of a business with ongoing costs like vacancy and maintenance.
A property's financial health isn’t measured by how much rent it collects, but by how much it keeps. Mastering this distinction is the first step toward making sound investment decisions.
This quick summary table breaks down the key differences between these two foundational metrics.
Gross vs Net Rental Income At a Glance
| Metric | What It Includes | What It Excludes | When to Use It |
|---|---|---|---|
| Gross Rental Income | Total potential rent collected (monthly rent x 12). May also include other income like pet fees or laundry. | Vacancy loss, operating expenses (taxes, insurance, repairs), debt service (mortgage). | Quick, high-level screening of a property's potential earning power. It's a starting point, not a final analysis. |
| Net Operating Income (NOI) | Gross rental income minus vacancy losses and all operating expenses. | Debt service (mortgage principal and interest), capital expenditures, income taxes. | In-depth deal analysis, comparing properties, and calculating key return metrics like Cap Rate. This is your true measure of profitability. |
Getting this initial framework right is a game-changer. It shifts your thinking from just being a rent collector to being a savvy business owner. In the next few sections, we'll dive deep into each piece of this puzzle—from forecasting realistic income to uncovering every possible expense—so you can analyze any potential deal with total confidence.
Figuring Out Your True Potential Revenue

Before we can get into the nitty-gritty of cash flow and returns, we need a solid starting point. What’s the absolute most a property could earn in a perfect world? This figure is what we call Gross Potential Income (GPI). It's the total annual rent you'd collect if the property was rented out every single day of the year, with no hiccups.
The math here is simple. If you have a single-family home that rents for $2,200 a month, your GPI is $2,200 x 12, which comes out to $26,400. For a duplex where you get $1,500 from each unit, the GPI would be ($1,500 x 2) x 12 = $36,000. GPI is a great baseline, but let's be honest—it's a best-case scenario that rarely, if ever, happens.
Grounding Your Numbers in Reality
Here’s the thing: no property stays 100% occupied. Life happens. Tenants move, you need a few weeks to paint and make repairs, and then it takes time to find the next great tenant. This is where the pros separate themselves from the amateurs by using a much more realistic number: Effective Gross Income (EGI).
EGI takes that pie-in-the-sky GPI and brings it back down to earth by accounting for those inevitable empty periods.
Effective Gross Income (EGI) = Gross Potential Income (GPI) - Vacancy and Credit Losses
Making this one adjustment is the first critical step in moving from what a property could make to what it will likely make.
How to Estimate Vacancy Accurately
The fastest way to blow up your financial projections is to underestimate vacancy. I’ve seen new investors plug in a rosy number like 2% just because it sounds good, only to be shocked when their cash flow doesn't match their spreadsheet. Don't guess. Do your homework on the local market.
Here’s how you can find a realistic vacancy rate for your area:
- Call Local Property Managers: These folks are in the trenches every day. They know exactly how long units are sitting empty in the neighborhoods you’re looking at. Their insight is gold.
- Scour Online Listings: Jump on Zillow or Apartments.com. Are comparable rentals in your target area getting snapped up in a week, or have they been sitting there for over 30 days? This gives you a real-time pulse on demand.
- Dig into Market Reports: Local real estate groups and national firms often publish reports with hard data on vacancy stats.
As a general rule of thumb, using a vacancy rate between 5% and 8% is a safe bet for most markets. So, for our property with a $26,400 GPI, a conservative 7% vacancy rate means we need to subtract $1,848. This immediately drops our expected income to $24,552. See? Already a much more accurate picture.
Don't Forget About Other Income Sources
The rent check isn't the only way your property can make money. Seasoned investors are always looking for ways to boost their bottom line with ancillary income. These streams might seem small individually, but they can seriously add up and pad your EGI.
When you're running your numbers, make sure you account for any of these "other income" sources you plan to implement.
Common Sources of Other Income:
- Coin-Operated Laundry: A classic for a reason. In a multifamily building, this can easily add a few hundred consistent dollars each month.
- Parking Fees: If street parking is a nightmare in the area, charging for a dedicated spot is a no-brainer.
- Pet Fees: This is pretty much standard practice now. You can charge a one-time, non-refundable fee or add a monthly pet rent like $25-$50 per pet.
- Late Fees: You never want to collect these, but they serve as an important deterrent and compensate you for the hassle of chasing down rent.
- Storage Units: Have an unused shed or some secure space in a basement? Rent it out to tenants for extra cash.
Let’s go back to our example. Imagine that property also brings in $50 a month in pet rent and another $75 for a rented-out garage spot. That’s an extra $1,500 a year. After we’ve already accounted for vacancy, our revised EGI now looks like this: $24,552 + $1,500 = $26,052. By being realistic about vacancy and thorough about income, we've built a solid foundation for the rest of our analysis.
Getting a Handle on Your Operating Expenses

This is where the pros separate themselves from the amateurs. Once you have a solid Effective Gross Income (EGI), the next make-or-break step in figuring out how to calculate rental income is to track down and subtract every single operating expense. Missing even one small cost can throw your entire analysis off and turn a good deal into a bad one.
The goal here is to land on your Net Operating Income (NOI). Think of NOI as the property's pure, unfiltered profitability before the mortgage payment even enters the picture. It tells you exactly how much cash the asset itself is generating.
Fixed vs. Variable Expenses: Know What You're Dealing With
Not all expenses are the same. To get a true financial picture, I find it helps to split them into two buckets: fixed and variable. This little bit of organization makes budgeting worlds easier and helps you predict your monthly cash flow with far more accuracy.
Fixed expenses are your predictable, non-negotiable costs. They show up like clockwork every month or year, and you can plan for them with near-perfect confidence. They’re the financial foundation of your rental budget.
These usually include:
- Property Taxes: Your annual bill from the city or county. Just divide by 12 to get a reliable monthly figure.
- Homeowner's Insurance: This is your landlord or hazard insurance policy that protects the property.
- Property Management Fees: If you hire a pro, this is typically a set percentage of collected rent, usually in the 8-10% range.
- HOA Fees: For condos or properties in a planned community, these monthly or quarterly dues are a given.
Then you have variable expenses, the ones that can fluctuate wildly based on how tenants live, the building’s age, and life’s little surprises. These are the costs that ambush new investors if they haven't planned for them.
Budgeting for the Unpredictable
Underestimating your variable costs is probably the single fastest way to drain your profits. You absolutely have to build a buffer by setting aside a percentage of your rental income every single month for these things. It's not a matter of if they'll happen, but when.
Here are the big ones you can't ignore:
- Repairs and Maintenance: This is everything from a leaky faucet to patching drywall after a tenant moves out. A good rule of thumb is to budget 5-10% of your gross rent.
- Utilities: Even if tenants pay their own electric, you might still be on the hook for water, sewer, or trash, especially in multifamily properties.
- Capital Expenditures (CapEx): These are the major-league replacements—a new roof, an HVAC system, a water heater. You have to save for these future expenses. I recommend socking away another 5-10% of your rent each month just for CapEx.
I can't stress this enough: don't fall into the trap of thinking, "The HVAC is brand new, so I don't need to save for it yet." That system starts getting older the day it's installed. Disciplined saving for CapEx from day one is a non-negotiable habit for long-term success.
Let's Run the Numbers: A Real-World Example
Let's apply this to our single-family rental example. We already figured out our Effective Gross Income (EGI) is $26,052 a year, which comes out to $2,171 a month. Now, it's time to start subtracting.
Monthly Expense Breakdown
- Property Taxes: $250 ($3,000 annually)
- Insurance: $100 ($1,200 annually)
- Property Management (9% of EGI): $195
- Repairs & Maintenance (8% of EGI): $174
- Capital Expenditures (8% of EGI): $174
- Utilities (Trash & Sewer): $60
Total Monthly Operating Expenses = $953
With all our expenses accounted for, calculating the Net Operating Income is simple.
NOI Calculation
- Monthly EGI: $2,171
- Total Monthly Expenses: -$953
- Monthly NOI: $1,218
- Annual NOI: $14,616
That $14,616 figure is golden. It's the annual profit the property generates before you even think about your mortgage. This is the most important number for comparing different deals and calculating the key return metrics we're about to get into. For a more organized way to track all this, you can build your own system using our guide to creating a rental income and expenses spreadsheet.
The 50% Rule: A Quick Gut-Check Tool
When you’re sifting through dozens of potential properties, you don’t have time to do a deep-dive analysis on every single one. That's where the 50% Rule comes in handy. It’s a back-of-the-napkin way to quickly screen a deal.
The rule states that, on average, your total operating expenses (again, not including the mortgage) will likely be about 50% of your gross rental income. So, if a property rents for $2,000 a month, you can quickly guess that around $1,000 will go to expenses, leaving you with an estimated NOI of $1,000.
Be careful, though. This is only a first-pass filter. You should never make a final investment decision based on this rule alone. The actual expense ratio can vary dramatically depending on the property's age, location, and condition. Always follow up with a detailed breakdown like the one we just did.
The broader market matters, too. For example, while some data shows a 5.2% dip in apartment costs since 2022, multifamily rentals have still seen a massive 28.2% surge since the pandemic. For an investor eyeing a unit renting at $2,000 monthly ($24,000 gross), rising vacancy rates—which hit a high of 7.2% in late 2025—mean you’d first need to deduct $1,728 for lost rent. Only then can you dig into the specific expenses to find the true NOI.
Turning Net Income into Actionable Investment Metrics
Alright, you've done the hard work and nailed down your Net Operating Income (NOI). This is where the real fun begins. You're moving beyond simple bookkeeping and stepping into the shoes of a serious investor. That one number—your NOI—is the key to unlocking the most critical metrics in real estate. It's how you turn a basic profit and loss statement into a powerful tool that tells you whether a deal is a winner or a dud.
So, What's Your Actual Cash Flow?
The first and, for many, the most important metric is your cash flow. While NOI tells you how profitable the property is on its own, cash flow tells you what's left for you after the bank takes its share. This is the money that actually hits your bank account every month.
The calculation is refreshingly simple:
Monthly Cash Flow = Monthly Net Operating Income (NOI) - Monthly Mortgage Payment (Debt Service)
Let's stick with our running example. We already figured out the property has a monthly NOI of $1,218. If your total mortgage payment (that's principal and interest) is $985, the math is easy.
- Monthly Cash Flow: $1,218 - $985 = $233
- Annual Cash Flow: $233 x 12 = $2,796
That $233 is the "mailbox money" you hear about. It’s what you pocket every month. If you want to dive deeper into this, we've got a whole guide on how to calculate cash flow on a rental property.
But here's the thing: cash flow is personal. It’s crucial, but it doesn't give you the full picture, especially when you’re trying to compare different deals.
Using Cap Rate to Compare Apples to Apples
How do you fairly judge a $250,000 duplex against a $400,000 four-plex in a different neighborhood? This is exactly where the Capitalization Rate (Cap Rate) becomes your best friend.
Think of it as a way to measure a property's raw, unleveraged return. It completely ignores financing, which lets you compare properties on a level playing field. You're looking purely at the property's income-generating muscle relative to its price.
Here's the formula every investor knows by heart:
Cap Rate = Net Operating Income (NOI) ÷ Property Value
Using our example property, which we're buying for $250,000 and has an annual NOI of $14,616:
- Cap Rate: $14,616 ÷ $250,000 = 0.058 or 5.8%
A 5.8% cap rate gives you a clear benchmark. If another property you're eyeing has a 4.2% cap rate, you know instantly that our example property generates a better return for its price tag. As a rule of thumb, higher cap rates (think 8%+) often suggest higher potential returns but might come with more risk. Lower cap rates (3-5%) are typical for stable, high-demand areas where you pay a premium for security.
Measuring Your Real Return on Investment
Cap rate is fantastic for comparing deals side-by-side, but it doesn’t tell you how your specific investment is performing with your unique financing. For that, you need to calculate the Cash-on-Cash Return.
This metric gets straight to the point and answers the question every investor truly cares about:
"For every dollar I put into this deal, how many cents am I getting back each year?"
It focuses strictly on the return you're getting on the actual cash you pulled out of your pocket.
Cash-on-Cash Return = Annual Cash Flow ÷ Total Cash Invested
First, you have to figure out your total cash invested. This isn't just the down payment; it includes everything you paid to get the deal done and ready to rent.
Here’s a quick breakdown:
- Down Payment (20%): $50,000
- Closing Costs: $5,000
- Initial Repairs: $3,000
- Total Cash Invested: $58,000
With our annual cash flow of $2,796, we can plug in the numbers:
- Cash-on-Cash Return: $2,796 ÷ $58,000 = 0.048 or 4.8%
This 4.8% is the true measure of how hard your money is working for you. It's a deeply personal number because if you put more money down or get a different loan, this return will change, even if the property's income stays the same.
Globally, returns can be all over the map. For instance, data shows a prime location like Punta del Este might offer a gross yield of 4.8%, but that drops to just 3.1% after expenses. Meanwhile, you might find markets in Colombia that consistently deliver 7-9% net yields. Knowing these benchmarks helps you set realistic expectations and see how your potential deal stacks up.
Let Software Do the Heavy Lifting: Automating Your Analysis with Property Scout 360
If you've ever tried to run the numbers on a potential deal by hand, you know the drill. You're bouncing between spreadsheets, tax records, and Zillow, trying to piece everything together. It's a grind. Worse, it’s incredibly easy for a simple typo or a bad assumption to completely skew your results, turning what looked like a winner into a money pit. As you scale up and start analyzing more properties, this manual process becomes a serious bottleneck.
This is exactly where technology gives you a massive advantage. Why spend hours on tedious calculations when you can automate the whole process and jump straight to the decision? We built Property Scout 360 for this very reason—to turn a complex, multi-step analysis into just a few clicks.

The dashboard gives you an instant snapshot of all the key metrics we've just walked through. From your annual cash flow to the 30-year ROI, everything is laid out in one clean, easy-to-read report. The platform even pulls real-time data to get your analysis started, giving you a clear picture of a property's financial health right out of the gate.
From Manual Math to Instant Insights
Property Scout 360 takes every formula we've discussed—NOI, Cap Rate, cash flow, Cash-on-Cash Return—and handles it all for you automatically. By integrating with MLS data from over 800 regions, the platform pulls in the list price, property specs, and recent tax history to build a solid financial profile from the get-go.
This is a game-changer because it eliminates so much of the guesswork that trips up new investors. Instead of guesstimating potential rent, our platform provides smart rent estimates based on actual local comps. That data-driven approach gives you a much more reliable foundation for your Effective Gross Income (EGI).
By automating the tedious parts of rental analysis, you get to focus on what actually moves the needle: deal strategy, negotiation, and finding that next great opportunity.
A Deeper Dive into the Numbers
The real power here is the depth of the analysis. The platform doesn't just spit out a single number; it lets you play with the variables to see how different scenarios would affect your returns.
For instance, you can:
- Model Different Loan Scenarios: Instantly see the difference between a 15-year and a 30-year mortgage. Curious how putting 25% down instead of 20% will impact your monthly cash flow and Cash-on-Cash Return? You can see it in seconds.
- Visualize Long-Term Growth: The analysis isn't just about year one. You get a full 30-year projection that shows how your equity and cash flow are expected to grow over the life of the investment.
- Fine-Tune Your Expenses: The system pre-fills estimates for taxes and insurance, but you have full control to adjust your budgets for maintenance, management fees, and CapEx to match your own strategy.
This level of detail is what separates a good investment from a bad one. Consider this: a $250,000 condo that rents for $1,800 a month might look great on the surface. But once you factor in realistic numbers for vacancy, management, repairs, taxes, and insurance, the net income can be nearly 50% less than the gross. Property Scout 360 gives you that detailed breakdown instantly, so you never get caught off guard by overlooked expenses.
Ultimately, a tool like this is about making smarter, more confident decisions, faster. You can vet a dozen properties in the time it used to take to manually analyze just one. It helps you quickly weed out the deals that don't meet your criteria so you can pour your energy into the ones that do.
Ready to see it in action? Check out our guide on getting started with Property Scout 360.
Common Questions About Calculating Rental Income
Once you've got the formulas down, you'll find that real-world investing rarely fits perfectly into a spreadsheet. Life throws curveballs. When you're learning how to calculate rental income, certain scenarios always seem to pop up that require a bit more nuance. Let's dig into some of the most common questions I hear from investors, both new and seasoned, when they're running the numbers on a potential deal.
Nailing these details is what separates a pretty good analysis on paper from a truly great investment in the real world. The little things, like how you account for a utility bill or a future repair, can make or break your long-term returns.
How Should I Budget for Variable Utilities?
This is a classic, especially for multi-family properties where you, the owner, might be on the hook for water, sewer, or trash. Unlike a fixed cost like your insurance premium, these expenses can swing wildly based on tenant usage and even the time of year. So, how do you budget for something you can't perfectly predict?
The best approach is to stop guessing and start investigating. Here's what I do:
- Ask for History: Get your hands on the last 12 months of utility bills from the current owner for any services you'll be covering. This is the single most reliable piece of data you can get.
- Find Your Average: Add up the total cost for the year and divide by 12. Use that monthly average as your baseline expense.
- Add a Buffer: I always tack on a 10-15% buffer to that average. This protects you from unexpected rate hikes from the utility company or a new tenant who loves taking hour-long showers.
Doing this gives you a data-backed estimate instead of a shot in the dark, which makes your Net Operating Income (NOI) calculation far more reliable.
Do I Include Property Management Fees if I Self-Manage?
Yes. Absolutely, one hundred percent, yes. This is easily one of the most common—and costly—mistakes I see new investors make. They leave this line item blank to make their cash flow numbers look a little juicier, but they're not just fooling their spreadsheet; they're fooling themselves.
Think about it this way: your time isn't free. Even if you're the one fielding late-night calls about a clogged toilet, you are performing a job that has a real market value. You should be "paying" yourself for that work.
Key Takeaway: Always factor in a property management fee, even if you plan to manage the property yourself. A standard 8-10% of gross rent is a solid estimate. This forces the deal to stand on its own two feet, ensuring it's profitable without relying on your free labor.
Including this fee accomplishes two critical things. First, it gives you a true financial picture of the property's performance. Second, it builds in the cost of eventually hiring a pro, which gives you the freedom to scale your portfolio without torpedoing your cash flow.
What Is the Difference Between Repairs and Capital Expenditures?
This distinction is crucial, not just for budgeting but for tax purposes as well. Getting this wrong can lead to inaccurate cash flow projections and leaving serious money on the table with the IRS.
Here’s a simple way to break it down:
- Repairs: These are your routine, smaller-scale fixes that keep the property running smoothly. We're talking about things like fixing a leaky faucet, patching a hole in the drywall, or replacing a broken doorknob. This is your everyday wear-and-tear budget.
- Capital Expenditures (CapEx): These are the big, infrequent, and expensive projects that replace a major system or add significant value to the property. Think new roofs, a full HVAC system replacement, or a gut kitchen remodel.
You absolutely have to separate these two in your planning. You need a monthly budget for routine repairs, but you also need a separate savings fund for those inevitable CapEx projects. Forgetting to save for that $15,000 roof that only has five years of life left is a recipe for disaster.
Analyzing properties by hand is a slow, error-prone grind that can cost you time and money. Property Scout 360 automates every calculation we’ve talked about—from NOI to Cash-on-Cash Return—giving you instant, data-driven reports on any U.S. property. Stop wrestling with spreadsheets and start making smarter investment decisions at https://propertyscout360.com.
About the Author
Related Articles
2026 Investor's Guide: Cost of Installing a Sewer Clean Out
Understand the cost of installing a sewer clean out for investment properties in 2026. Get expert advice on prices, ROI, & budgeting for flips. Plan smart!
15 Year vs 30 Year Mortgage: The Investor's Choice
Deciding between a 15 year vs 30 year mortgage for a rental property? Our guide analyzes cash flow, ROI, and equity to help you pick the best loan.
Real Estate Appraisal Software: Features & Limits
Discover what real estate appraisal software is, its core features, and limits. See how it differs from investment tools for profitable deals.