Rent to Price Ratio: A Quick Guide to Profitable Properties
Discover the rent to price ratio and how it signals profitable investments. Learn calculation steps and practical use for smarter property decisions.
The rent to price ratio is a straightforward yet incredibly useful tool for real estate investors. It’s a simple calculation that compares a property's monthly rent to its total purchase price, giving you a quick snapshot of its income potential.
Think of it as your first filter. Before you get bogged down in detailed spreadsheets, this metric helps you quickly weed out the duds and zero in on properties that actually have a shot at being profitable.
Why the Rent to Price Ratio Is Your First Look

Imagine you're car shopping. The first thing you probably check is the miles-per-gallon (MPG) sticker. It doesn't tell you how the car handles or if the engine is sound, but it gives you an immediate idea of its fuel efficiency. A high MPG looks good, while a low one is a warning sign of future costs.
The rent to price ratio does the exact same thing for a rental property. It’s a quick efficiency check, showing how much income the property might produce for every dollar you invest in it. It’s not the whole story, but it’s a crucial first chapter.
Gauging Potential Before Deep Analysis
This is your go-to metric for a quick "back-of-the-napkin" gut check. Before you invest hours digging into operating expenses, market comps, or financing scenarios, a simple calculation can tell you whether a property is even worth a second look. A strong ratio hints at solid cash flow potential, while a weak one is an immediate red flag.
Using the ratio as a first step gives you several advantages:
- Efficient Screening: You can sift through dozens of listings in minutes, immediately flagging the ones that meet your minimum criteria.
- Market Comparison: It lets you easily compare properties across different neighborhoods or even cities. For instance, a property in a pricey market like Santa Clara County, where a mortgage payment can be 3.3 times the monthly rent, will have a completely different ratio than one in an affordable town in the Midwest.
- Avoiding Overpayment: A low ratio is often a sign that the asking price is just too high for what the property can earn in the local rental market.
This initial check is crucial because it frames your entire investment approach. It helps you focus your energy on deals that have a genuine chance of success from the very beginning.
To help you put this into practice, here's a quick reference table. It gives you some general benchmarks to see what different ratios might mean for a potential investment.
Rent to Price Ratio Quick Reference Guide
| Ratio Benchmark | What It Generally Means | Investor Action |
|---|---|---|
| Below 0.7% | Very low potential for positive cash flow after expenses are paid. | Usually not worth further analysis unless there's a strong appreciation play. |
| 0.7% - 1.0% | A common range in many markets. May produce modest cash flow. | Proceed with caution. A thorough expense analysis is critical. |
| 1.0% - 1.2% | Often considered a good target. Suggests healthy cash flow potential. | This is a strong signal to dig deeper into the property's financials. |
| Above 1.2% | An excellent ratio. Indicates very strong potential cash flow. | Prioritize these properties for full due diligence. |
Keep in mind these are just guidelines. Every market is different, and a "good" number in one city might be a "great" one in another.
A Foundation for Smarter Investing
Ultimately, the rent to price ratio is the starting line, not the finish line. It sets the stage for a more detailed investigation where you'll factor in real-world costs like taxes, insurance, maintenance, and vacancy.
Mastering this simple metric is a key part of most proven wealth building strategies. It gives you a powerful lens to view any deal, making sure you only spend your valuable time on opportunities with a solid foundation for financial success.
How to Calculate the Rent-to-Price Ratio Step by Step
One of the best things about the rent-to-price ratio is its simplicity. You don't need a complicated spreadsheet or financial calculator—just two key numbers. It's the perfect back-of-the-napkin metric for quickly sizing up a deal.
The formula itself couldn't be more direct:
Monthly Rent / Purchase Price = Rent-to-Price Ratio
The result is a simple percentage that shows you what portion of the property's price you're getting back in gross rent each month. Generally, a higher percentage points to a better potential return on your money right out of the gate.
Example One: A Single-Family Home
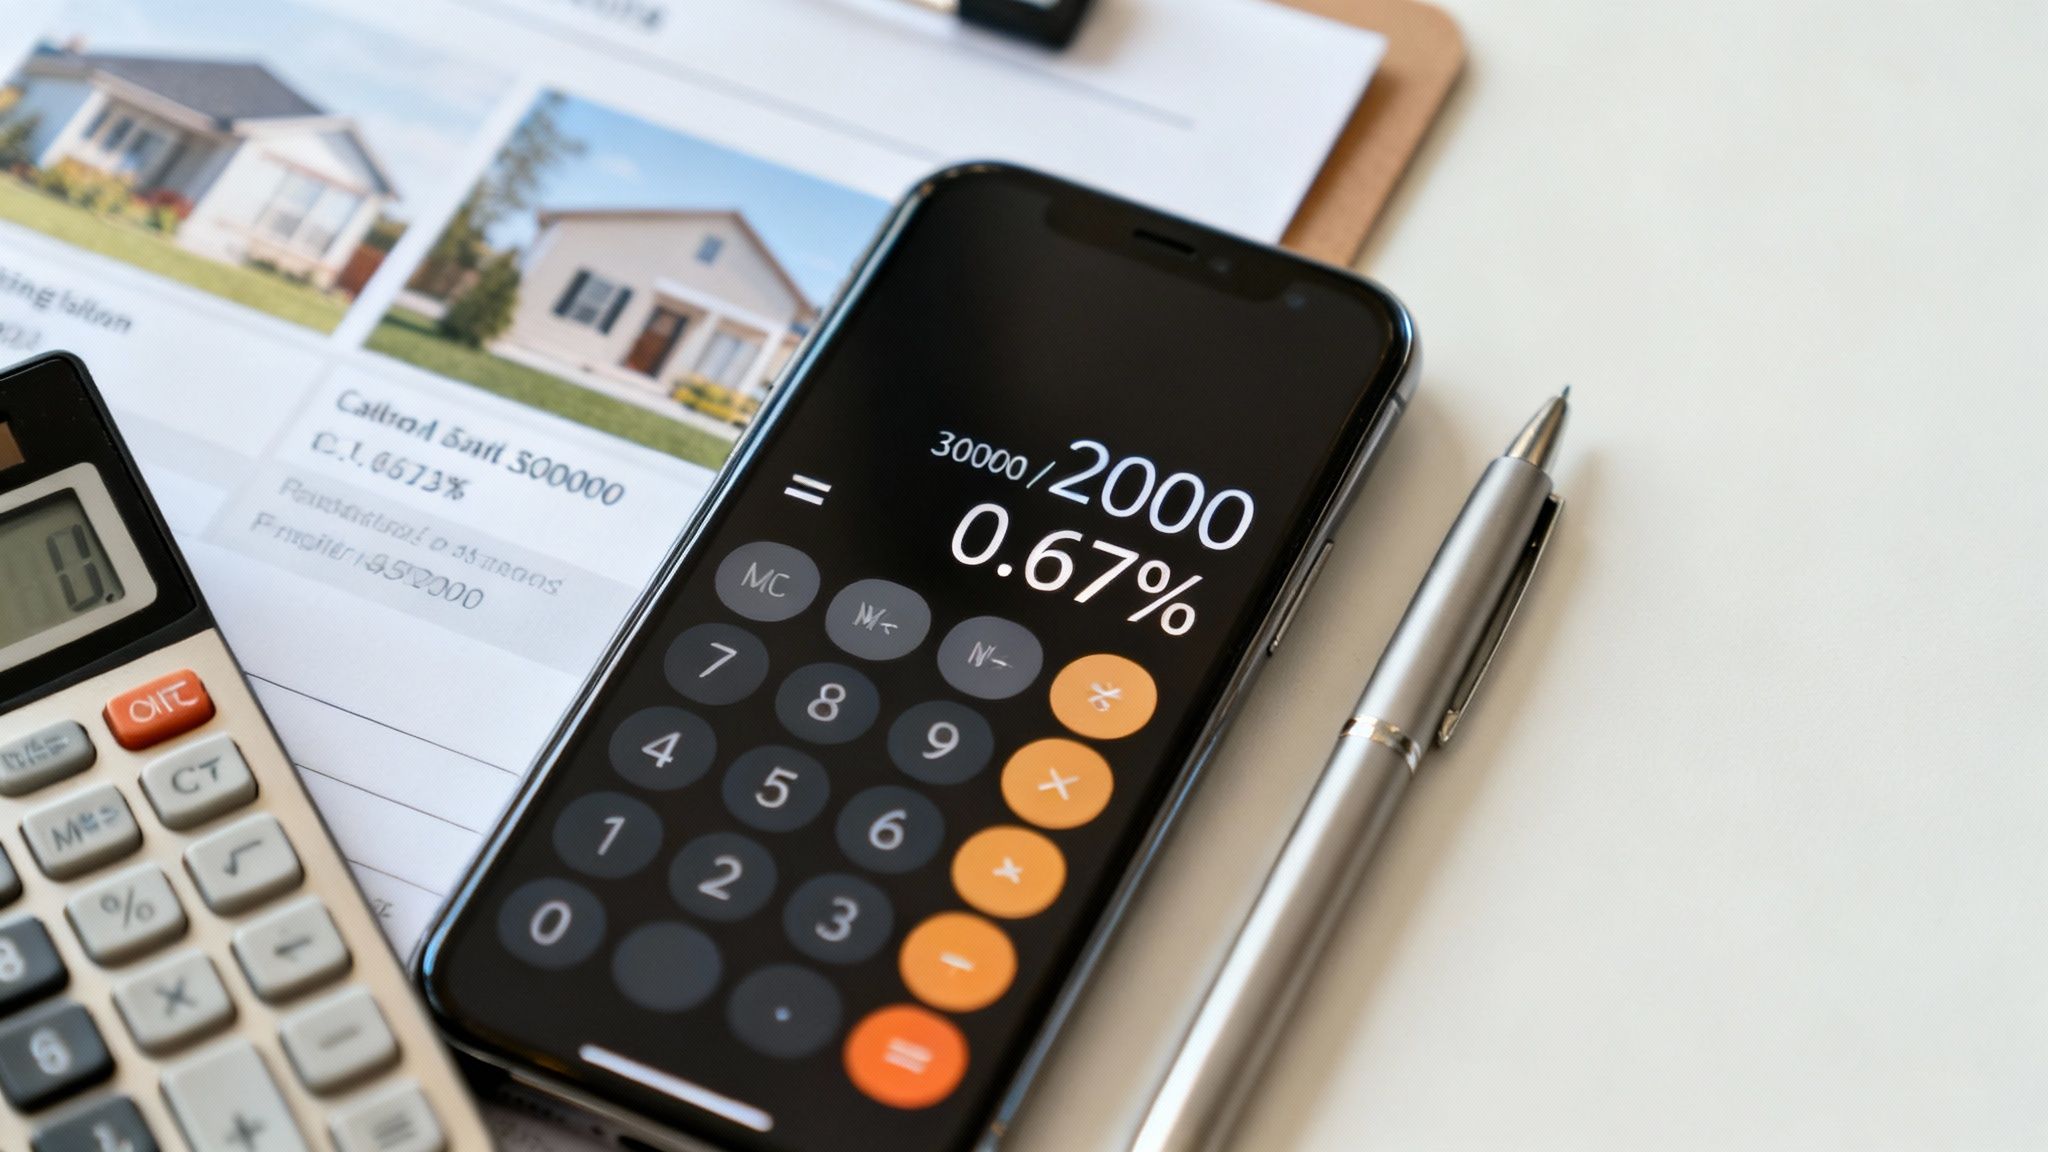
Let's put this into practice. Say you're eyeing a single-family home on the market for $300,000. After running the comps for the neighborhood, you feel confident you can rent it for $2,000 a month.
Here's how you'd break it down:
- Step 1: Grab the Monthly Rent: $2,000
- Step 2: Note the Purchase Price: $300,000
- Step 3: Divide the rent by the price: $2,000 / $300,000 = 0.00667
To turn that decimal into something more useful, just multiply by 100. That gives you a rent-to-price ratio of 0.67%. This number instantly tells you that your monthly rent is just shy of 0.7% of what you paid for the house.
Example Two: A Small Multi-Family Property
The real beauty of this metric is its versatility. It works just as well for a duplex or a four-plex, which are often the next step for investors looking to grow their portfolio.
Let’s imagine a duplex is listed for $450,000. You figure each unit can pull in $1,900 per month, giving you a total monthly rental income of $3,800.
Applying the same formula:
- Total Monthly Rent: $1,900 + $1,900 = $3,800
- Purchase Price: $450,000
- Calculation: $3,800 / $450,000 = 0.00844
- Final Ratio: 0.84%
Notice that the duplex has a considerably higher ratio than the single-family home. This is an immediate flag that it could be a stronger income-producing asset, making it worth a much deeper dive.
Pro Tip: For an accurate first look, always use the total purchase price and the gross monthly rent. The purchase price isn't just the listing price; it should also include any immediate rehab costs needed to make it rent-ready. Likewise, gross rent is the total income before you subtract expenses like taxes, insurance, or property management fees.
The Famous 1% Rule: A Popular Shortcut
If you've spent any time around other investors, you've probably heard someone mention the "1% Rule." This isn't some complex financial model; it's a rule of thumb that comes directly from the rent-to-price ratio. It states that a good investment property should have a gross monthly rent equal to at least 1% of its purchase price.
So, a $250,000 property would need to bring in $2,500 per month in rent to pass this test. Hitting that 1% mark has become incredibly tough in today's high-priced markets, but it's still a fantastic benchmark for finding deals with strong cash flow potential, especially in more affordable regions.
Once a property passes this initial sniff test, you'll want to dig deeper. Using a dedicated rental property analyzer spreadsheet is the perfect next step to go beyond this simple screening metric.
Interpreting Good vs. Bad Rent-to-Price Ratios
Okay, you've got the formula down. But a ratio is just a number until you know what it’s telling you about a property's potential. This is where experience comes in—learning to read the story behind the percentage. There’s no single magic number, but understanding the different signals is key to making smart moves.
I like to think of these ratios as traffic lights for my initial analysis. A low number is a red light, telling me to stop and seriously reconsider. A decent number is a yellow light—proceed, but with caution. And a great number? That’s the green light to put in the real work and dig deeper.
General Benchmarks for Investors
While every market is its own beast, there are some general rules of thumb that help you quickly sift through deals. These ranges are a fantastic starting point for sizing up a property that lands on your radar.
Here’s how I break it down:
- Below 0.5% (The Red Flag): A ratio this low is usually a recipe for negative cash flow. The rent is simply too low for the price tag. Once you account for the mortgage, taxes, insurance, and repairs, you're almost guaranteed to be feeding the property money every month. Hard pass.
- 0.5% - 0.7% (The Gray Area): You'll see this a lot in pricey, high-appreciation markets. Think coastal California. Investors here aren't playing for monthly cash flow; they're betting on the property's value skyrocketing over time. It’s a high-stakes game that requires deep pockets and a strong stomach.
- 0.7% - 1.0% (The Sweet Spot): This is the bread and butter for many successful investors. A property in this range usually strikes a healthy balance between a reasonable purchase price and strong rental income. More often than not, it points toward positive cash flow after all the bills are paid.
- Above 1.0% (The "1% Rule" Unicorn): Finding a property that hits the famous "1% Rule" is like finding a needle in a haystack in most markets today. These are the deals you dream about, often found in affordable Midwest or Southern cities. They represent a golden opportunity for powerful, immediate cash flow.
Why Market Context Is Everything
A "good" rent-to-price ratio isn't a one-size-fits-all metric. It’s completely relative to the local market. What’s considered a home run in Detroit might be impossible to find in Denver, simply because home prices and average rents are worlds apart.
For instance, markets in the South and Midwest, like Pittsburgh (6.02%) or Memphis (5.55%), often post high annual rent-to-price ratios. This happens because home prices are still quite reasonable compared to what you can charge for rent. On the flip side, high-cost-of-living areas have much lower ratios, where the investment strategy often pivots to long-term appreciation instead of monthly income.
The real secret is to compare apples to apples. You have to measure a property's ratio against its local peers, not against some national average. This local context is what separates a savvy investment from a costly mistake.
How National Trends Affect Your Benchmarks
It's also critical to keep an eye on how the bigger economic picture shifts these goalposts. In the U.S., the price-to-rent ratio has seen some wild swings that every investor should be aware of. From 1970 to recent years, the metric averaged 102.50. But it shot up to an all-time high of 140.23 in the second quarter of 2022. By the fourth quarter of a subsequent year, it was back up to 134.04.
What does that mean? It means homes were priced at a level requiring over 134 months of rent just to break even on the purchase price—way above historical norms. This signals that renting was a better deal for tenants, which in turn can be a great opportunity for landlords. You can explore more historical data on how U.S. housing trends have evolved on Trading Economics.
This data shows why staying informed is non-negotiable. A great ratio today could be just average tomorrow if the market moves. The rent-to-price ratio is a fantastic first look, but it’s only one piece of the puzzle. To truly get a handle on a property’s profitability, you need to bring in other, deeper metrics. If you’re ready for the next step, our guide on what is a good cap rate is a great place to continue your journey.
Don't Stop at the Rent-to-Price Ratio: A Look at its Limitations
The rent-to-price ratio is an incredible tool for quickly sizing up a deal. Think of it like checking a car's MPG rating. It gives you a fast, useful snapshot of its potential efficiency. But you wouldn't buy a car based on MPG alone, right? You'd want to know about the engine's health, repair costs, and insurance.
That's exactly how you should treat this ratio. It’s a fantastic starting point that highlights a property's gross income potential, but it completely ignores the real-world expenses that ultimately decide if you'll make money or lose it.
This is probably the most important thing to grasp: the rent-to-price ratio is a gross metric. It’s blind to the dozen or so costs that will inevitably chip away at your rental income. A property might boast a stellar ratio on paper, but if its expenses are sky-high, your actual cash flow could dwindle to nothing—or worse, go negative.
What the Ratio Doesn't See
Think of the ratio as just the tip of the iceberg. What should really concern an investor is the massive, hidden part below the waterline. These are the operating expenses that every single landlord has to deal with.
Here are the most significant costs the rent-to-price ratio completely overlooks:
- Property Taxes: These can be a huge variable, changing dramatically from one state, county, or even neighborhood to the next. They can easily add hundreds of dollars to your monthly outlay.
- Homeowners Insurance: This is non-negotiable. You need it to protect your asset, but it’s another recurring cost that eats into your profits.
- Maintenance and Repairs: Things break. It's a fact of life. From a leaky faucet to a full roof replacement, you have to be ready. A good rule of thumb is to budget 1% of the property's value each year just for upkeep.
- Vacancy Rates: No property stays occupied 100% of the time. Smart investors budget for a 5-10% vacancy rate to cover the gaps between tenants.
- Property Management Fees: If you're not managing it yourself, expect to pay a professional 8-12% of the monthly rent for their services.
- HOA Dues: A big one for condos and townhomes. These mandatory fees can be substantial and have a nasty habit of increasing over time.
These are the numbers that separate a deal that looks good from a deal that is good.
Same Ratio, Wildly Different Realities: An Example
Let's make this crystal clear with an example. Imagine you're looking at two single-family homes. Both are for sale for $250,000, and both command a monthly rent of $2,500.
On the surface, they're identical. Both have a fantastic rent-to-price ratio of exactly 1.0%. A rookie investor might jump at either one, assuming they're equally good investments. But let's pull back the curtain and look at their annual expenses.
| Expense Category | Property A (Low-Tax Area) | Property B (High-Tax Area) |
|---|---|---|
| Annual Gross Rent | $30,000 | $30,000 |
| Property Taxes | $3,000 | $6,500 |
| Insurance | $1,200 | $1,800 |
| Maintenance (Est. 1%) | $2,500 | $2,500 |
| Vacancy (Est. 5%) | $1,500 | $1,500 |
| Total Annual Expenses | $8,200 | $12,300 |
| Net Operating Income | $21,800 | $17,700 |
Look at that. Even with the exact same rent-to-price ratio, Property B’s higher taxes and insurance premiums mean it generates $4,100 less in net income every single year. This is precisely why you can't stop at the initial ratio; you have to dig deeper.
The rent-to-price ratio is your starting line, not the finish line. It helps you find promising opportunities, but a deep dive into the real numbers is what actually wins the race.
It's also worth noting how the dynamic between rent and ownership costs plays out over the long term. A fascinating study of U.S. data from 1985 to 2019 revealed surprisingly stable rent growth across various income levels. Over that period, the highest earners saw their rents rise only a modest 9 points more than the lowest earners. You can get into the weeds on these trends by exploring the Federal Reserve's analysis on rent growth disparities.
Finally, don’t forget the two other elephants in the room that the ratio ignores: appreciation and financing. It tells you nothing about a market's growth potential or how your specific mortgage terms will impact your final cash-on-cash return. Use the rent-to-price ratio for what it is—a powerful screening tool—but always be prepared to roll up your sleeves for the next level of due diligence.
Comparing Rent to Price Ratio with Cap Rate and GRM
While the rent-to-price ratio is a fantastic starting point, a savvy investor knows it’s just one tool in a much larger toolbox. To really get the full financial picture of a property, you have to see how this metric plays with its cousins: the Gross Rent Multiplier (GRM) and the Capitalization (Cap) Rate.
Think of these three as different lenses for your camera. The rent-to-price ratio is your wide-angle shot—it gives you a quick, broad overview of the scene. The GRM offers a slightly different perspective on that same wide view. But the Cap Rate? That's the zoom lens that brings the critical, money-making details into sharp focus.
The Gross Rent Multiplier: Your Inverse Cousin
The Gross Rent Multiplier, or GRM, is essentially the flip side of the rent-to-price ratio coin. Instead of showing a monthly return as a percentage, it tells you how many years it would take for the gross rental income to completely pay off the property's purchase price.
The formula is beautifully simple: Purchase Price / Annual Gross Rent = GRM.
Here, a lower GRM is what you want, as it signals a quicker payback period. So, if the rent-to-price ratio answers the "how much this month?" question, the GRM answers the "how many years?" question, all based on that same top-line gross income.
Cap Rate: The Next Level of Analysis
This is where serious analysis truly begins. The Capitalization Rate, or Cap Rate, takes a giant leap forward because it actually factors in a property's operating expenses. This makes it a far more accurate and reliable gauge of how profitable an investment will actually be.
Its formula is: Net Operating Income (NOI) / Purchase Price = Cap Rate.
Net Operating Income (NOI) is your annual gross rent after subtracting all your operating expenses—things like property taxes, insurance, routine maintenance, and property management fees. Crucially, it's calculated before your mortgage payments. Because it accounts for real-world costs, the Cap Rate gives you the true, unleveraged return of an asset. To get another perspective on this, you can learn more about how to calculate cap rate on rental property.
The image below drives this point home, showing how surface-level ratios can be misleading because they ignore the very costs that determine whether you make or lose money.
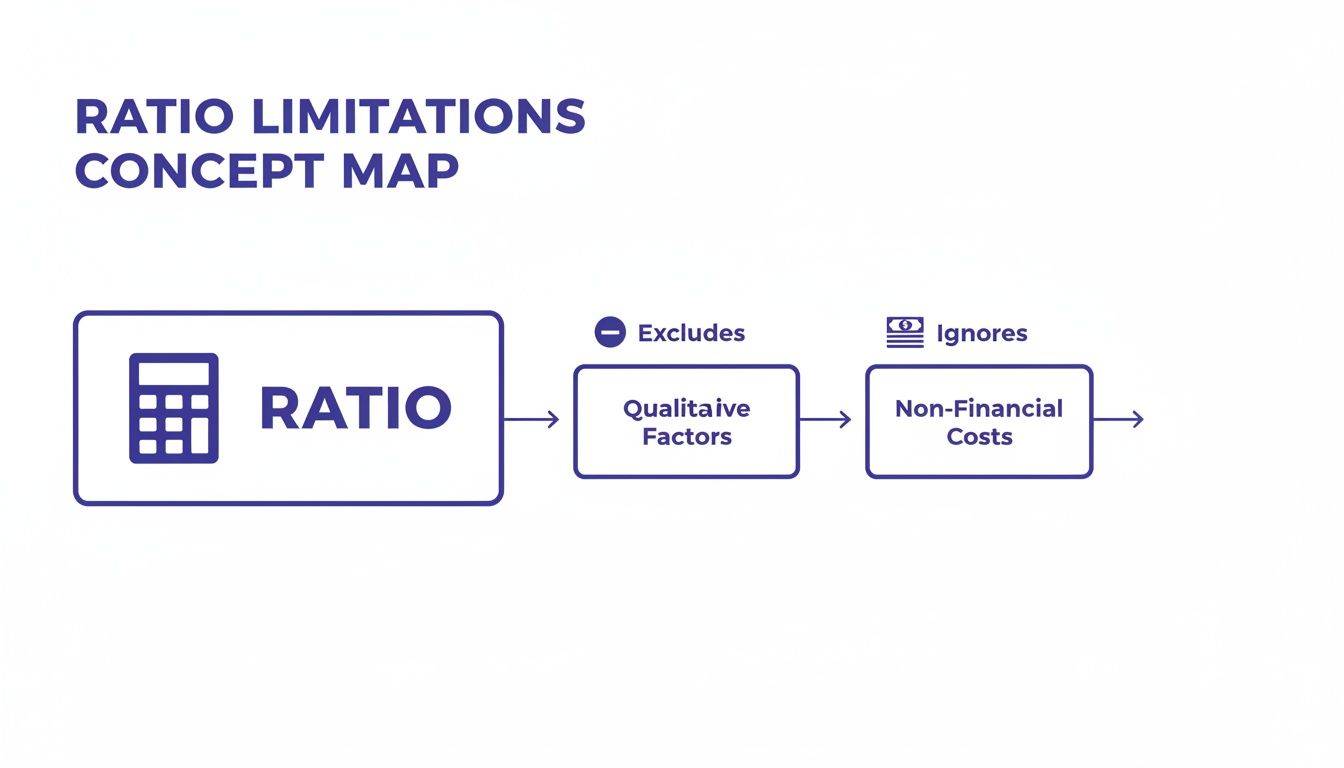
This just reinforces that while the rent-to-price ratio is a great first filter, you absolutely have to dig deeper into the numbers it overlooks.
Choosing the Right Metric for the Job
Knowing when to use each metric is what separates the pros from the amateurs. You wouldn’t use a hammer to turn a screw, and you shouldn't rely on a simple gross metric when what you really need is a detailed net-profit analysis.
Each of these metrics is designed to answer a very different question for you. The rent-to-price ratio asks, "Is the gross rent healthy for the price?" The Cap Rate, on the other hand, asks, "What is my actual, unleveraged return after my bills are paid?" Answering both is key.
This table breaks down the key differences to help you decide which tool to pull out of your belt at the right time.
Investment Metrics at a Glance: Rent to Price vs GRM vs Cap Rate
| Metric | Formula | What It Measures | Best For |
|---|---|---|---|
| Rent to Price Ratio | Monthly Gross Rent / Purchase Price | Gross monthly income potential | Quick, high-level screening of many properties. |
| GRM | Purchase Price / Annual Gross Rent | Payback period from gross income | Comparing very similar properties in the same market. For a deeper look, see our guide on what GRM is in real estate. |
| Cap Rate | Net Operating Income / Purchase Price | True profitability before financing | Accurately comparing different types of properties or markets. |
By mastering all three, you can stop making guesses and start making calculated, data-driven investment decisions that build real wealth.
Answering Your Top Questions
Once you get the hang of the rent-to-price ratio, you start running into real-world scenarios that don't quite fit the simple formula. Let's tackle some of the most common questions that pop up when you're out there analyzing deals.
Does the 1 Percent Rule Still Work Today?
Ah, the famous 1% Rule. It’s one of the first rules of thumb new investors learn: monthly rent should be at least 1% of the purchase price. But is it still relevant? Yes and no.
Think of it less as a hard-and-fast rule and more as a quick gut check. In expensive coastal cities or hot markets, hitting that 1% mark is a pipe dream. An investor in these areas might be perfectly happy with a ratio between 0.6% and 0.8%, betting more on appreciation down the road.
On the other hand, in many affordable Midwest or Southern markets, the 1% Rule is still a fantastic benchmark for sniffing out properties with strong cash flow potential. The takeaway is simple: use it to quickly sort through a list of properties, but never let it be your final word. Your detailed analysis of actual expenses is what truly matters.
How Do I Adjust the Ratio for a BRRRR Property?
This is a great question because the BRRRR method (Buy, Rehab, Rent, Refinance, Repeat) changes the math. For a BRRRR deal, the "price" in your calculation isn't just what you paid for the house—it's your all-in cost.
You have to add the purchase price to your total renovation budget to get an accurate picture. This is non-negotiable for a proper assessment.
Let's say you snag a fixer-upper for $150,000 and have a rehab budget of $50,000. Your total investment, and the number you should use for the "price," is $200,000. You'd then compare that to what you expect the property to rent for after all the work is done. This approach gives you a much clearer view of your true return before you ever pick up a hammer.
What Is the Difference Between Price-to-Rent Ratio and Rent-to-Price Ratio?
It's easy to get these two mixed up, but they're just two different ways of looking at the same relationship. They’re inverse of one another—one is a quick percentage for investors, and the other is a broader economic indicator.
- Rent-to-Price Ratio: This is what we've been talking about. It's calculated as (Monthly Rent / Purchase Price) and gives you a percentage. It’s the go-to metric for investors who are screening for cash flow. Higher is better.
- Price-to-Rent Ratio: This one is calculated as (Purchase Price / Annual Rent). The result is a multiplier, not a percentage. It's often used in market analysis reports to show how many years of rent it would take to cover the property's price. Here, a lower number is better.
A high price-to-rent ratio (say, over 20) can signal that home prices are getting frothy compared to local rents, and the market might be a better fit for renting than buying. A low ratio (under 15) often points to a market where buying is more financially sound than renting.
Ready to stop guessing and start making data-driven investment decisions? Property Scout 360 eliminates the guesswork by providing instant calculations for cash flow, cap rate, and ROI on any U.S. property. Find your next profitable rental in minutes.
About the Author
Related Articles
2026 Investor's Guide: Cost of Installing a Sewer Clean Out
Understand the cost of installing a sewer clean out for investment properties in 2026. Get expert advice on prices, ROI, & budgeting for flips. Plan smart!
15 Year vs 30 Year Mortgage: The Investor's Choice
Deciding between a 15 year vs 30 year mortgage for a rental property? Our guide analyzes cash flow, ROI, and equity to help you pick the best loan.
Real Estate Appraisal Software: Features & Limits
Discover what real estate appraisal software is, its core features, and limits. See how it differs from investment tools for profitable deals.