A Guide to Rental Property Cap Rate for Smart Investors
Unlock the true potential of real estate with our guide to rental property cap rate. Learn to calculate and analyze this key metric to make smarter investments.
The capitalization rate, more commonly known as the rental property cap rate, is one of the most fundamental metrics in a real estate investor's toolkit. At its core, it measures the raw, unleveraged annual return you can expect from an investment property.
Think of it this way: the cap rate shows you the property's earning power before you even think about getting a loan. This gives you a clean, simple way to size up the profitability of different properties and see how they stack up against each other.
Why Cap Rate Is Your Starting Point
If you were comparing two different cars, you wouldn't just look at the sticker price. You'd want to know their miles per gallon (MPG) to get a true sense of their efficiency. The cap rate for a rental property does the exact same job. It’s a standard performance metric that cuts through all the noise—like different sale prices or financing terms—to show you a property's essential income-generating potential.
This single percentage tells you what your annual return would be if you bought the property with all cash. By taking the mortgage out of the equation, it lets you make a true apples-to-apples comparison between, say, a trendy downtown condo and a quiet suburban duplex.
The Trade-Off Between Risk and Return
The cap rate also gives you a quick snapshot of an investment's risk-return profile. You'll start to notice a pattern:
- Higher Cap Rates (e.g., 8-10%+): These often signal a higher potential return, but they usually come with more risk. The property might be in a rougher neighborhood, need a lot of work, or struggle with keeping tenants.
- Lower Cap Rates (e.g., 4-6%): These typically point to a safer, more stable investment. Think properties in prime locations with high tenant demand. The trade-off? Your immediate returns will be lower.
A rental property cap rate isn’t just a number; it’s a story about the property's health and its place in the market. A high rate might scream "opportunity," but it could also whisper "caution."
A Foundation for Smarter Decisions
Getting a handle on cap rate is the first step toward making investment decisions you can feel confident about. It’s the baseline you use to analyze all the other important stuff, like cash flow, loan options, and the potential for long-term appreciation. To get a better feel for it, you can compare it to a stock's dividend yield. Both metrics show you how much income an asset generates each year relative to its price, giving you a clear picture of its performance.
Ultimately, mastering this concept helps you quickly vet deals, find properties that actually match your financial goals, and build a portfolio that works for you. It turns investing from a guessing game into a smart, repeatable process.
How to Calculate Cap Rate (with Real-World Examples)
On the surface, the cap rate formula seems simple. But its real power comes from truly understanding its two core ingredients: Net Operating Income (NOI) and the property's Current Market Value. Let's walk through how to calculate it so you can do it with confidence.
Think of NOI as the raw, unfiltered annual profit a property generates before you even think about your mortgage. It's the purest measure of the asset's performance. To find it, you simply take all the money the property brings in and subtract all the costs required to keep it running.
This quick visual breaks down the process. You're essentially feeding in the financial data to get a clear, simple percentage that signals the property's potential.
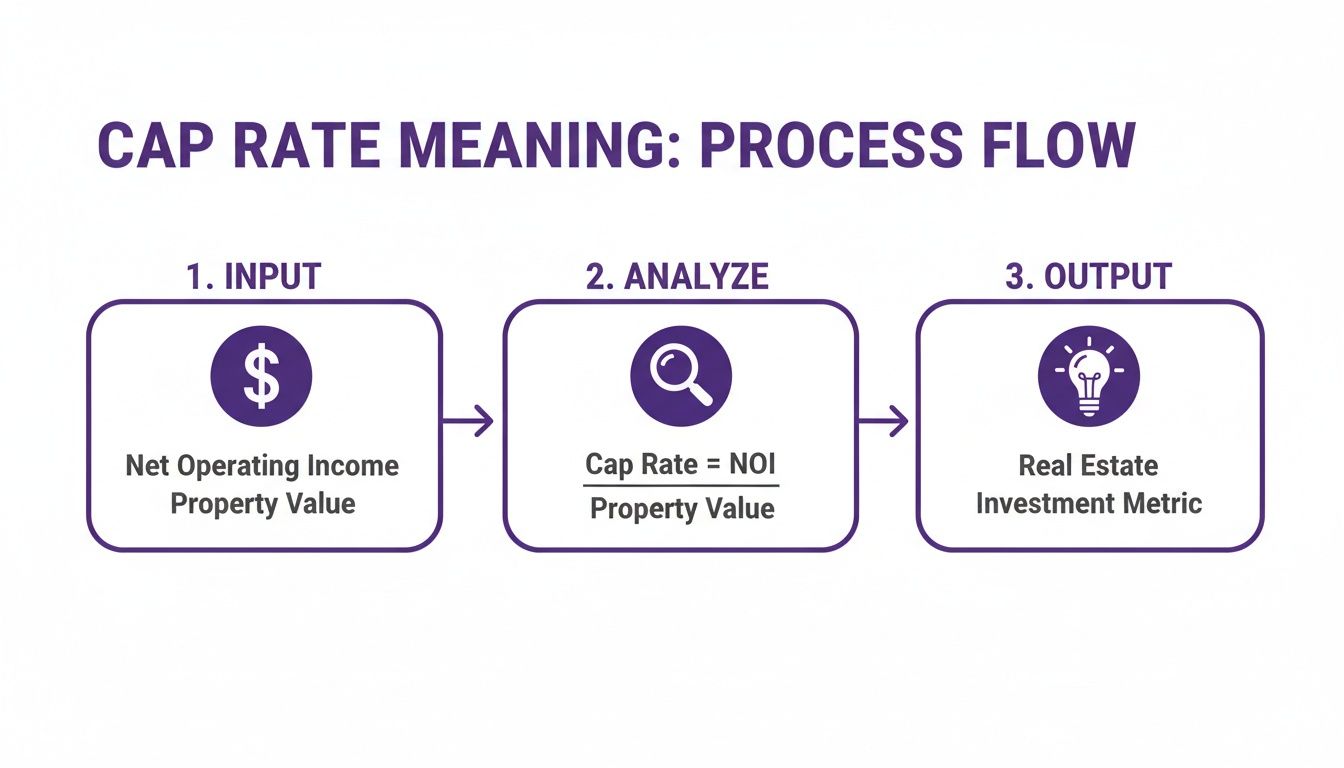
It’s a straightforward path from raw numbers to a meaningful investment metric.
Step 1: Nailing Down the Net Operating Income (NOI)
First, figure out your Gross Rental Income. This is the absolute maximum rent you could collect in a year if the property was occupied 100% of the time. For a house renting at $2,000 a month, your gross annual income would be $24,000. Easy enough.
Next, you need to add up every single one of your annual Operating Expenses. These are all the necessary costs to own and manage the property.
Don't forget these common expenses:
- Property Taxes
- Homeowners Insurance
- Property Management Fees (budget 8-10% of rent)
- Maintenance and Repairs (a good rule of thumb is 1-2% of the property value per year)
- Utilities (if you're covering any of them)
- HOA Fees
- Vacancy Loss (always set aside 5-10% of gross rent for this—it will happen!)
Crucial Point: Your mortgage payment (both principal and interest) is not part of the NOI calculation. Cap rate is meant to measure a property's profitability independent of financing. This lets you compare two properties on an apples-to-apples basis, regardless of how they are purchased.
Once you have your numbers, the NOI formula is simple:
NOI = Gross Rental Income - Total Operating Expenses
Step 2: Putting the Formula to Work on a Single-Family Home
Let's run the numbers on a real-world example. Say you're looking at a single-family home on the market for $350,000.
- Gross Rental Income: It rents for $2,200/month, so that’s $26,400 for the year.
Now, let's tally up the estimated annual expenses:
- Property Taxes: $3,500
- Insurance: $1,200
- Vacancy (5% of gross rent): $1,320
- Repairs & Maintenance: $2,500
- Property Management (8%): $2,112
- Total Operating Expenses: $10,632
With those figures, we can find our NOI:
NOI = $26,400 - $10,632 = $15,768
Finally, let’s plug that into the cap rate formula:
Cap Rate = ($15,768 / $350,000) x 100 = 4.5%
A 4.5% cap rate gives you the property's unleveraged annual return. You can now use this clean, simple number to compare it against other potential deals in the same market. To streamline this for several properties at once, a good rental property calculator spreadsheet can be a huge help in keeping your analysis organized.
Step 3: Running the Numbers on a Duplex for Comparison
What about a multi-family property? Let's analyze a duplex listed for $500,000, where each unit rents for $1,600 a month.
- Gross Rental Income: ($1,600 x 2 units) x 12 months = $38,400 per year.
Here are the projected annual expenses for the duplex:
- Property Taxes: $5,000
- Insurance: $2,000
- Vacancy (5%): $1,920
- Repairs & Maintenance: $4,000
- Property Management (8%): $3,072
- Total Operating Expenses: $15,992
Let's calculate the duplex's NOI:
NOI = $38,400 - $15,992 = $22,408
And now for its cap rate:
Cap Rate = ($22,408 / $500,000) x 100 = 4.48%
Interestingly, even though the properties are completely different, their cap rates are almost identical. This suggests a similar level of profitability before financing. For another solid walkthrough, check out this guide on how to calculate cap rate for rental property. This side-by-side comparison is exactly where cap rate proves its worth, giving you a standardized way to evaluate completely different investment opportunities.
What Is a Good Rental Property Cap Rate?
So you've run the numbers and have a cap rate staring back at you. The big question is, what does it actually mean? Is this a good deal or a dud?
The most truthful answer is also the one that drives new investors crazy: it depends. There’s no magic number that makes a cap rate “good.” It’s a moving target that shifts based on your goals, the city you're buying in, and even the type of property.
Think of it this way: is 75 degrees a "good" temperature? It's perfect for a day at the park, but it would ruin a ski trip. A 5% cap rate could be an absolute home run in a crazy-competitive market like San Francisco, but that same 5% might be a warning sign in a small Midwest town where investors expect much higher returns for their risk.
The trick is to stop hunting for a universal "good" number. Instead, you need to develop a feel for the market you're in. That's when you start spotting what a genuinely strong opportunity looks like in its own context.
How Market Dynamics Shape Cap Rates
Every real estate market plays by its own set of rules, and that directly impacts what investors expect to earn. Location is, without a doubt, the single biggest factor that defines a good cap rate.
Primary Markets (think New York, Los Angeles): These are the big leagues—high-demand, high-cost areas that are generally seen as safer bets. All that investor attention drives prices up, which naturally pushes cap rates down. Snagging a property here with a cap rate between 3% and 5% is often considered a win because you're also counting on serious long-term appreciation.
Secondary Markets (like Austin or Nashville): These are often the sweet spots. They have strong population growth and things are still relatively affordable. You can find better returns than in the primary markets without venturing into territory that feels too risky. A "good" cap rate here often lands in the 5% to 7% range.
Tertiary Markets (smaller towns and more rural areas): In these places, property prices are much lower, but the potential for rapid appreciation is less of a sure thing. To make up for that higher perceived risk, investors demand better returns right out of the gate. A solid cap rate here could easily be 8% or even higher.
Here’s the core relationship to remember: when a property is seen as stable and safe, the cap rate is usually lower. You're essentially paying a premium for a more predictable asset with less drama.
The Influence of Economic Cycles on Cap Rates
Cap rates don't exist in a vacuum. They breathe with the economy, especially when interest rates change. A quick look at history shows just how much they can swing.
For instance, after the 2008 financial crisis, investors were nervous, and multifamily cap rates were sitting around 6-8%. Fast forward to 2020-2022, when interest rates hit rock bottom, and those same cap rates plunged to historic lows of about 4.5%. Then, as the Fed hiked rates from 2022 to 2024, cap rates shot back up to an average of 5.75%—the highest they’d been since 2014.
You can dive deeper into these commercial real estate trends by checking out detailed market reports. This back-and-forth shows why having access to real-time data is so crucial. A tool like Property Scout 360 helps you decide if a 5.3% cap rate today is a smart move, given the current economic climate.
Matching Cap Rate to Your Investment Strategy
At the end of the day, a "good" cap rate is one that fits your financial blueprint.
Are you trying to build wealth as quickly as possible? You might be a "cash flow" investor, hunting for higher-cap-rate properties in up-and-coming areas. You’re willing to take on more risk for the chance of a bigger monthly check.
On the other hand, if you're nearing retirement, you might prioritize wealth preservation. A stable, low-cap-rate property in a top-tier neighborhood could be perfect. The goal isn't aggressive growth; it's steady, reliable income you can count on. The right cap rate is simply the one that aligns with your personal risk tolerance and your vision for the future.
Comparing Cap Rates for Different Property Types
Not all real estate is created equal, and the cap rate you can expect will swing wildly depending on what kind of property you buy. A single-family house in a quiet suburb has a completely different risk-and-reward profile than a ten-unit apartment building downtown. Knowing these differences is absolutely crucial for matching an investment to your actual financial goals.
For most new investors, the choice boils down to two main categories: single-family rentals (SFRs) and small multifamily properties (think duplexes or fourplexes). Each one behaves differently in the market, requires a different management style, and reacts to economic shifts in its own way—all of which gets baked into their typical cap rates.

Single-Family Rentals: The Balance of Appreciation and Cash Flow
Single-family homes often trade at a lower cap rate compared to multifamily buildings in the same neighborhood. You might be wondering why an investor would accept a lower immediate return. It really comes down to a few key advantages that SFRs have going for them.
For starters, tenant turnover in single-family homes tends to be much lower. Families often put down roots, sign longer leases, and treat the property more like their own, which can mean less wear-and-tear and fewer costly vacancy gaps for you.
On top of that, single-family homes generally have stronger potential for appreciation. Their value is directly tied to the broader owner-occupied housing market, so they can ride the wave of price growth when the market is hot.
But SFRs have one glaring vulnerability: a single vacancy means 100% of your rental income vanishes overnight. That "all or nothing" income stream makes them inherently riskier from a pure cash flow standpoint.
Recent market data really drives this point home. Single-family rental cap rates have been climbing, hitting 6.8% by the second quarter of 2024. This jump is largely a reaction to high interest rates, which are forcing investors to demand better day-one returns to make the math work. You can dig into the full story in these SFR investment trends to see just how much the numbers have shifted. For investors using tools like Property Scout 360, a 6.8% cap rate now requires a much closer look to make sure it still spits out positive cash flow after factoring in today's higher mortgage payments.
Multifamily Properties: The Power of Scale and Stability
On the other side of the coin, multifamily properties almost always offer a higher cap rate. Their main draw is the incredible stability that comes from having multiple income streams under a single roof.
Think about it: if one tenant moves out of a fourplex, you’re still collecting 75% of your gross rent. That built-in protection against vacancy makes multifamily income far more predictable and resilient.
Key Takeaway: The risk of a single vacancy in a multifamily property is spread across multiple units, providing a crucial safety net for your cash flow that single-family rentals simply can't offer.
Because of this income stability, multifamily properties are often valued more like commercial businesses—their worth is directly tied to the income they produce. You also get economies of scale; managing four units in one building is nearly always cheaper and more efficient than managing four separate houses scattered across town. The trade-off? They often have less explosive appreciation potential than SFRs in booming residential markets.
To help you see the differences side-by-side, here’s a quick breakdown:
Cap Rate Comparison: Single-Family vs Multifamily
This table contrasts the key factors that influence cap rates for Single-Family Rentals (SFRs) and Multifamily properties. It's a great way to quickly understand the unique risk and return profile of each asset type.
| Characteristic | Single-Family Rentals (SFRs) | Multifamily Properties |
|---|---|---|
| Typical Cap Rate | Generally lower | Generally higher |
| Vacancy Impact | High risk (100% income loss) | Lower risk (income partially lost) |
| Appreciation | Higher potential (tied to home values) | More moderate (tied to income) |
| Management | Less efficient (one property per location) | More efficient (multiple units, one roof) |
| Tenant Turnover | Typically lower | Typically higher |
| Financing | Residential loans (easier access) | Commercial loans (stricter criteria) |
Ultimately, choosing between a single-family and a multifamily investment really comes down to your priorities. Are you playing the long game for appreciation and are okay with lower initial cash flow? An SFR might be a perfect fit. Or do you need strong, predictable monthly income right out of the gate? In that case, a duplex or a small apartment building is probably the smarter move.
Using Cap Rate with Other Key Investment Metrics
Think of cap rate as a starting point. It’s a fantastic tool for quickly sizing up a deal, but it’s just one piece of the puzzle. Relying on it alone is like judging a car by its horsepower—you’re ignoring its fuel economy, handling, and how it actually feels to drive. The best investors know how to layer cap rate with other key metrics to see the complete financial picture.
This is more important than ever. Market conditions can turn on a dime. For example, U.S. multifamily cap rates jumped by 112 basis points between 2022 and early 2024, largely because the Federal Reserve was hiking interest rates. You can read more about how interest rates and cap rates are connected if you want to dig deeper. This shift proves that a single number is never enough to vet an investment properly.
To make a truly informed decision, you have to look past the property's raw potential and see how it performs in the real world—with a mortgage, appreciation, and all the other variables in play.
Cash-on-Cash Return: The Impact of Leverage
While cap rate deliberately ignores financing, Cash-on-Cash Return puts your mortgage right at the center of the conversation. This metric shows you the annual return you're getting on the actual cash you pulled out of your pocket for the deal—the down payment, closing costs, and all that.
Why does this matter so much? Because financing can completely change the game. You could have two properties with an identical 5% cap rate, but they could deliver wildly different cash-on-cash returns based on your loan. A great interest rate or a lower down payment can juice your returns, turning an average-looking deal into a real winner.
A property’s cap rate tells you about the asset’s potential. Its cash-on-cash return tells you about your potential with that asset.
ROI: The Long-Term View
Finally, we have the big one: Return on Investment (ROI). This gives you the most complete, long-term perspective on your investment's performance. Unlike the other two, ROI factors in every single source of profit over the entire time you hold the property.
Specifically, ROI includes:
- Net annual cash flow from rent checks.
- Property appreciation (how much the property's value grows).
- Loan paydown (the equity you build as your tenants help pay off your mortgage).
Because it includes appreciation, ROI is crucial for evaluating properties in up-and-coming neighborhoods that might not cash flow like crazy on day one but have huge long-term potential. Our guide on calculating rental property ROI breaks it all down. Ultimately, ROI is the truest measure of how much wealth an investment is creating for you.
Investment Metrics: Cap Rate vs. Cash-on-Cash vs. ROI
To get the full story on any potential investment, you need to understand how these three metrics work together. Each one answers a different, but equally important, question.
This table gives you a quick rundown of what each metric is for and when it's the right tool for the job.
| Metric | What It Measures | Includes Financing? | Best Use Case |
|---|---|---|---|
| Cap Rate | The property's unleveraged annual return | No | Quickly comparing different properties on an apples-to-apples basis before considering financing. |
| Cash-on-Cash | The annual return on your actual cash invested | Yes | Evaluating how your specific financing terms and down payment will affect your immediate returns. |
| ROI | The total return over the life of the investment | Yes | Assessing the long-term wealth-building potential, including appreciation and loan paydown. |
Think of it as a funnel. The cap rate helps you quickly scan the market and build a shortlist. From there, the cash-on-cash return tells you how the deal works with your money. And finally, ROI shows you the full wealth-building power of the asset over the long haul. Using them together gives you a 360-degree view, so you can invest with real confidence.
Common Mistakes to Avoid When Using Cap Rate
The cap rate is a fantastic tool for taking a quick temperature check on a potential investment. It lets you compare different properties on an apples-to-apples basis, which is invaluable. But here's where new investors often stumble: they treat that number as the final word.
Thinking the cap rate tells you everything is a classic rookie mistake. In reality, it’s just the first step in your due diligence. It gives you a snapshot of the property’s potential, but it doesn't show the full movie of how it will actually perform with your money on the line.
Believing Overly Optimistic Seller Projections
One of the biggest traps you can fall into is accepting the seller's advertised cap rate without a second thought. That number is usually based on a "pro forma," which is just a fancy word for a financial projection. And guess what? Projections can be easily tweaked to make a mediocre deal look like a home run.
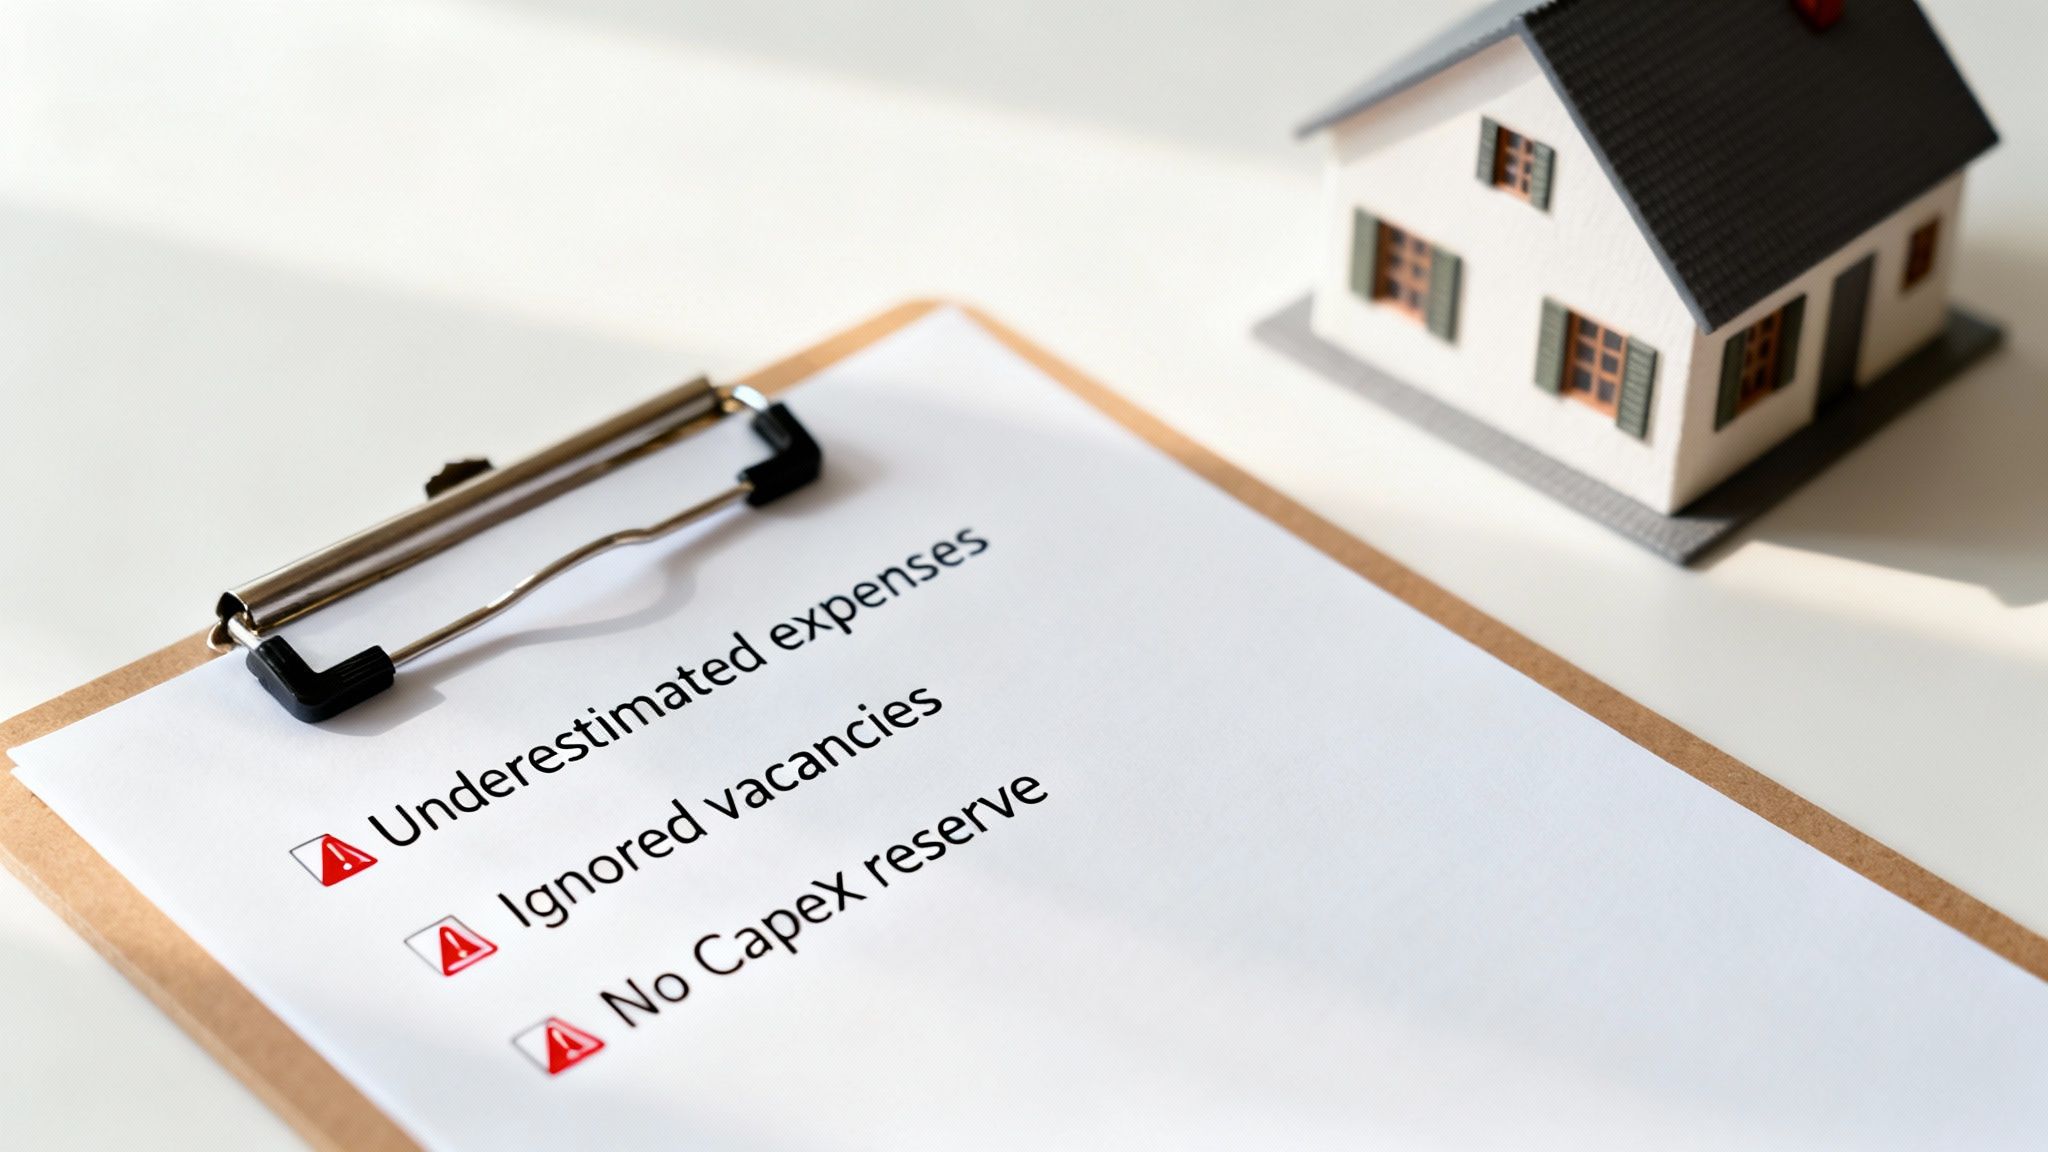
Sellers have a few common tricks up their sleeve to pump up the cap rate:
- Underestimating Expenses: They might "forget" to include line items like property management fees, landscaping, or what a realistic water bill looks like.
- Assuming 100% Occupancy: This is a huge red flag. No property is ever full 365 days a year. Ignoring vacancy is a guaranteed way to fall short of your goals.
- Using Above-Market Rents: The pro forma might list rent numbers that are way higher than what similar units are actually getting down the street.
Pro Tip: Never, ever use the seller's numbers. Build your own Net Operating Income (NOI) from the ground up. Get real insurance quotes, research comparable rents, and plug in a vacancy rate of at least 5-8% to start.
Forgetting About Capital Expenditures
Your standard cap rate calculation accounts for day-to-day operating costs, but it completely ignores the big stuff: Capital Expenditures (CapEx). These are the major, less frequent expenses that keep a property alive and well over the long haul.
We're talking about things like a new roof ($10,000+), a new HVAC system ($5,000+), or repaving the driveway. These costs don't pop up every month, but trust me, they are coming. If you don't budget for them, a single repair can vaporize an entire year's worth of profit. A smart rule of thumb is to set aside 1-2% of the property’s value each year for future CapEx.
Ignoring the Power of Financing
Here’s probably the biggest blind spot of the cap rate: it pretends you’re buying the property with a briefcase full of cash. That's almost never how it works in the real world. Most investors use leverage—a mortgage—and that changes the entire financial picture.
A deal with a seemingly "meh" 5% cap rate could turn into an amazing 12% cash-on-cash return once you factor in a good loan. On the flip side, a property with a juicy 8% cap rate could actually be a dud if your mortgage has a high interest rate.
This is exactly why your analysis can't stop at the cap rate. The next crucial step is to see how the numbers work with your specific loan. Learning to calculate cash flow on a rental property is non-negotiable, as it forces you to account for your mortgage payment.
By sidestepping these common pitfalls, you turn the cap rate from a potentially misleading metric into a truly useful tool—the starting point for a deep and accurate investment analysis.
Common Questions About Cap Rate
As you start working with the rental property cap rate, you'll find a few questions pop up again and again. Getting these sorted out is key to making this metric a truly useful part of your analysis toolkit.
Can a Cap Rate Be Too High?
It's tempting to think higher is always better, but that's a trap many new investors fall into. When you see an unusually high cap rate—maybe 12% or more—your first reaction shouldn't be excitement. It should be suspicion.
More often than not, an outlier cap rate signals high risk. That property might be in a neighborhood that's heading downhill, where tenants are hard to find and property values are dropping. It could also mean the building is hiding a money pit of deferred maintenance, like a failing roof or ancient plumbing that the seller conveniently left off the expense report.
Think of it like a used car listed for a price that seems too good to be true. Sure, it might be a diamond in the rough, but there's a good chance the engine is about to blow, and the seller knows it.
How Does Appreciation Fit into the Equation?
This is a critical point: cap rate completely ignores appreciation. It’s a snapshot in time. It only tells you about the property's income potential right now, based on its current income and market value.
Your total return from a rental property really comes from two different streams: the cash it puts in your pocket every month (which cap rate helps you estimate) and the property's increase in value over time. For example, a property in a booming tech hub might only have a 4% cap rate, but if its value is projected to double in the next decade, it could be a fantastic investment. On the other hand, a high cap rate property in a stagnant area might never build you any real wealth.
Should I Use Asking Price or Purchase Price?
This one's simple—it just depends on where you are in the buying process. You'll actually use both, just at different times.
Here’s the breakdown:
- Use the Asking Price (or what you plan to offer) when you're analyzing a deal. This gives you a projected cap rate to compare different listings and decide if a property is even worth a closer look.
- Use the Final Purchase Price after you've closed the deal. This calculates your actual cap rate based on what you paid. This is the number you'll use to track your investment's real-world performance year after year.
Ready to stop guessing and start making data-driven investment decisions? Property Scout 360 eliminates the guesswork by providing instant cap rate, cash flow, and ROI calculations for properties across the U.S. Find your next profitable rental in minutes.
About the Author
Related Articles
2026 Investor's Guide: Cost of Installing a Sewer Clean Out
Understand the cost of installing a sewer clean out for investment properties in 2026. Get expert advice on prices, ROI, & budgeting for flips. Plan smart!
15 Year vs 30 Year Mortgage: The Investor's Choice
Deciding between a 15 year vs 30 year mortgage for a rental property? Our guide analyzes cash flow, ROI, and equity to help you pick the best loan.
Real Estate Appraisal Software: Features & Limits
Discover what real estate appraisal software is, its core features, and limits. See how it differs from investment tools for profitable deals.