What is a Good Return on Rental Property? A Practical Guide
What is a good return on rental property? Learn key metrics like cap rate, cash-on-cash return, and benchmarks to guide smarter investments.
So, what’s a “good” return on a rental property? It’s a question every investor asks, but the answer isn't a single magic number. It's really about aligning a property's performance with your own financial goals.
As a quick rule of thumb, most experienced investors look for a cash-on-cash return of 5-8% or higher and a cap rate somewhere between 4-10%. When you factor in long-term appreciation, a healthy total ROI should ideally hit 10-12% or more each year.
Defining Your Target Return on a Rental Property
The truth is, a fantastic return for one investor might be just average for another. It all comes down to your strategy, the local market, and how much risk you're comfortable taking on.
To get started, you need to understand the two main ways a rental property makes you money:
- Cash Flow: This is the profit you pocket every month after you’ve collected rent and paid all the bills—mortgage, taxes, insurance, repairs, you name it. It's your immediate, tangible income.
- Appreciation: This is the long-term increase in the property's value. You don't get this money until you sell or refinance, but it's a huge part of how real estate builds serious wealth over time.
Think of cash flow and appreciation as two different engines driving your investment. Some investors are all about maximizing monthly income right now, while others are playing the long game, hunting for properties in areas poised for major growth. The sweet spot is often a healthy mix of both.
Setting Realistic Benchmarks
When you're sizing up a potential deal, you have to know which numbers to look at. Recent data shows the average gross rental yield in the U.S. is around 6.56%, but that figure is misleading because it doesn't include any expenses.
A much better metric is the cash-on-cash return. Most pros will tell you to aim for at least 5-8% to make sure the property is actually putting money in your pocket after every single cost is paid. For a deeper dive, check out our guide on what is a good cash-on-cash return.
A common trap for new investors is getting excited about a high gross yield without accounting for costs. A property's real performance is only clear after you subtract all operating expenses and the mortgage. Your true return isn't what you collect in rent; it's what you actually get to keep.
Then, there's the appreciation factor. According to the Federal Housing Finance Agency, U.S. home prices have appreciated by an average of 4.7% per year since 2000. When you combine a solid cash-on-cash return with steady appreciation, you start to see those powerful double-digit returns that make real estate such a compelling investment.
To give you a clearer picture, here’s a quick summary of the key metrics and what to aim for.
Rental Property Return Benchmarks at a Glance
This table summarizes common target ranges for key rental property metrics, helping you quickly understand what to aim for in your investments.
| Return Metric | What It Measures | Good Target Range |
|---|---|---|
| Cap Rate | A property's unleveraged annual return (before financing) | 4% - 10%+ |
| Cash-on-Cash Return | Your annual cash profit relative to the cash you invested | 5% - 8%+ |
| Total ROI | Your overall return, including cash flow and appreciation | 10% - 12%+ |
These benchmarks are a great starting point, but remember they can shift based on the market, property type, and your personal strategy. A lower cash-on-cash return might be perfectly acceptable in a high-appreciation market, for example.
The Three Pillars of Rental Return Analysis
So, you want to figure out if a rental property is a "good" deal. The truth is, you can't just look at one number and know for sure. Relying on a single metric is a classic rookie mistake. To get the real story, you need to understand three core calculations that, together, paint a complete picture of an investment's potential.
These pillars—the Cap Rate, Cash-on-Cash Return, and Total ROI—each reveal a different, crucial part of how a property will perform.
This flowchart lays out how the different pieces fit together, from immediate cash in your pocket to the long-term growth of your investment.
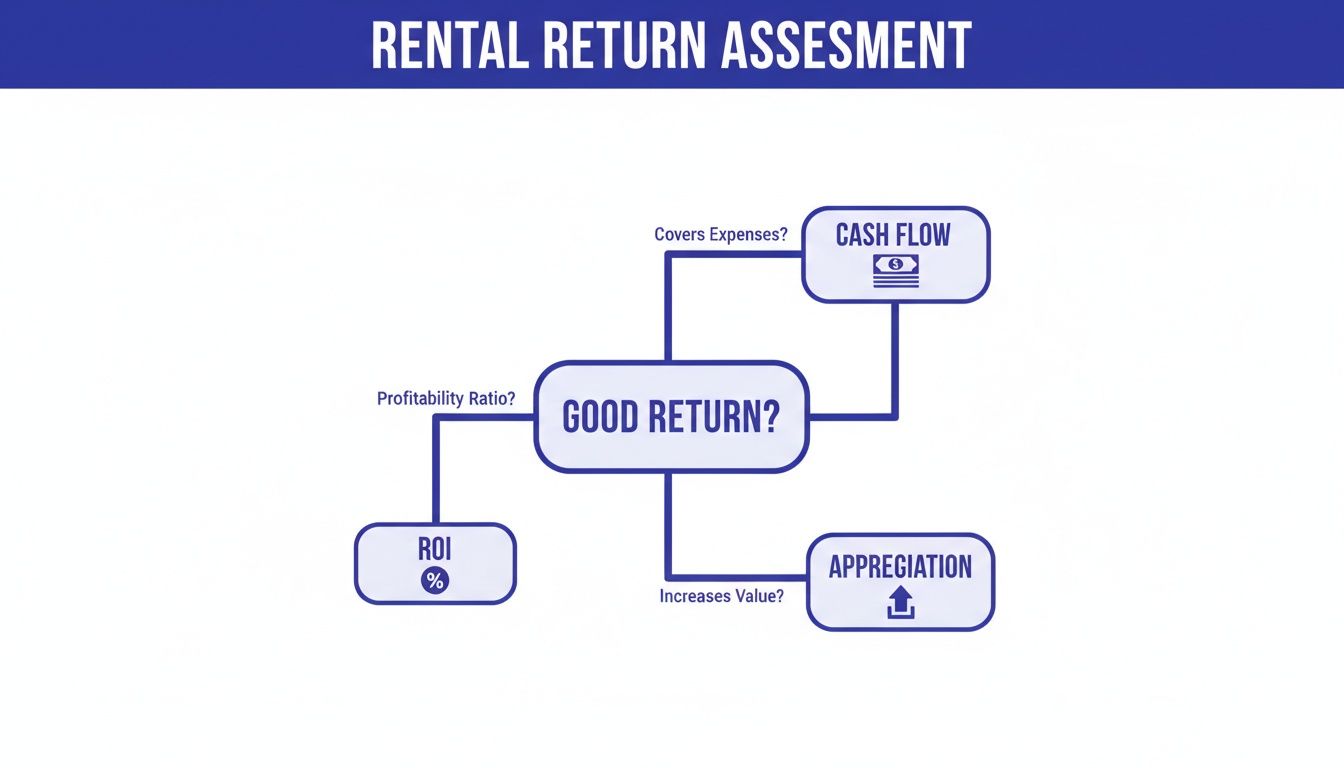
As you can see, a great return is rarely just one thing. It's a blend of cash flow, appreciation, and how efficiently your money is working.
Cap Rate: The Property's Raw Profit Engine
First up is the Cap Rate, short for capitalization rate. Think of this as a way to measure a property's pure, unleveraged earning power. It completely ignores financing and answers one simple question: "How much income does this property kick off relative to its price?"
The calculation is just the property's Net Operating Income (NOI) divided by its purchase price.
Cap Rate = Net Operating Income (NOI) / Property Price
A higher cap rate usually means a more profitable deal if you were paying all cash. It's the perfect tool for an apples-to-apples comparison between different properties because it strips out the variable of a mortgage.
Cash-on-Cash Return: Your Wallet's Perspective
Next, we have the Cash-on-Cash (CoC) Return. For most investors who use loans, this is arguably the most important number. It tells you exactly what percentage you're making back on the actual cash you pulled out of your pocket. It's your "wallet return"—the real profit you see each year based on your down payment and closing costs.
Here’s an example. Imagine two identical houses, both generating $5,000 in annual profit. You buy the first with all cash for $250,000, giving you a 2% CoC return. But you buy the second with a 20% down payment ($50,000). Your return on that $50,000 is now a much healthier 10%. That's the power of leverage in action.
The formula is just as direct:
- Cash-on-Cash Return = Annual Pre-Tax Cash Flow / Total Cash Invested
This metric shows you how hard your invested capital is actually working for you. A property might have a so-so Cap Rate but deliver an amazing CoC return thanks to great financing terms.
Total ROI: The Big Picture View
Finally, Total ROI gives you the most complete view of how your investment is performing over the long haul. It looks beyond the immediate cash flow to include all the other ways real estate builds wealth. Because let's be honest, cash flow is king, but it's not the whole kingdom.
Total ROI takes several key factors into account:
- Cash Flow: The net profit you pocket every year.
- Appreciation: The increase in the property's market value over time.
- Loan Paydown: The portion of your mortgage payment that builds your equity.
- Tax Benefits: Things like mortgage interest deductions and depreciation can seriously boost your real return.
If you only chase cash flow, you might pass up a fantastic property in a rapidly growing area where appreciation alone could dwarf your rental income in a few years. By using all three pillars, you can make a truly informed decision that lines up with your goals, whether you're after immediate income, long-term wealth, or a smart mix of both.
How Location and Property Type Dictate Your Returns
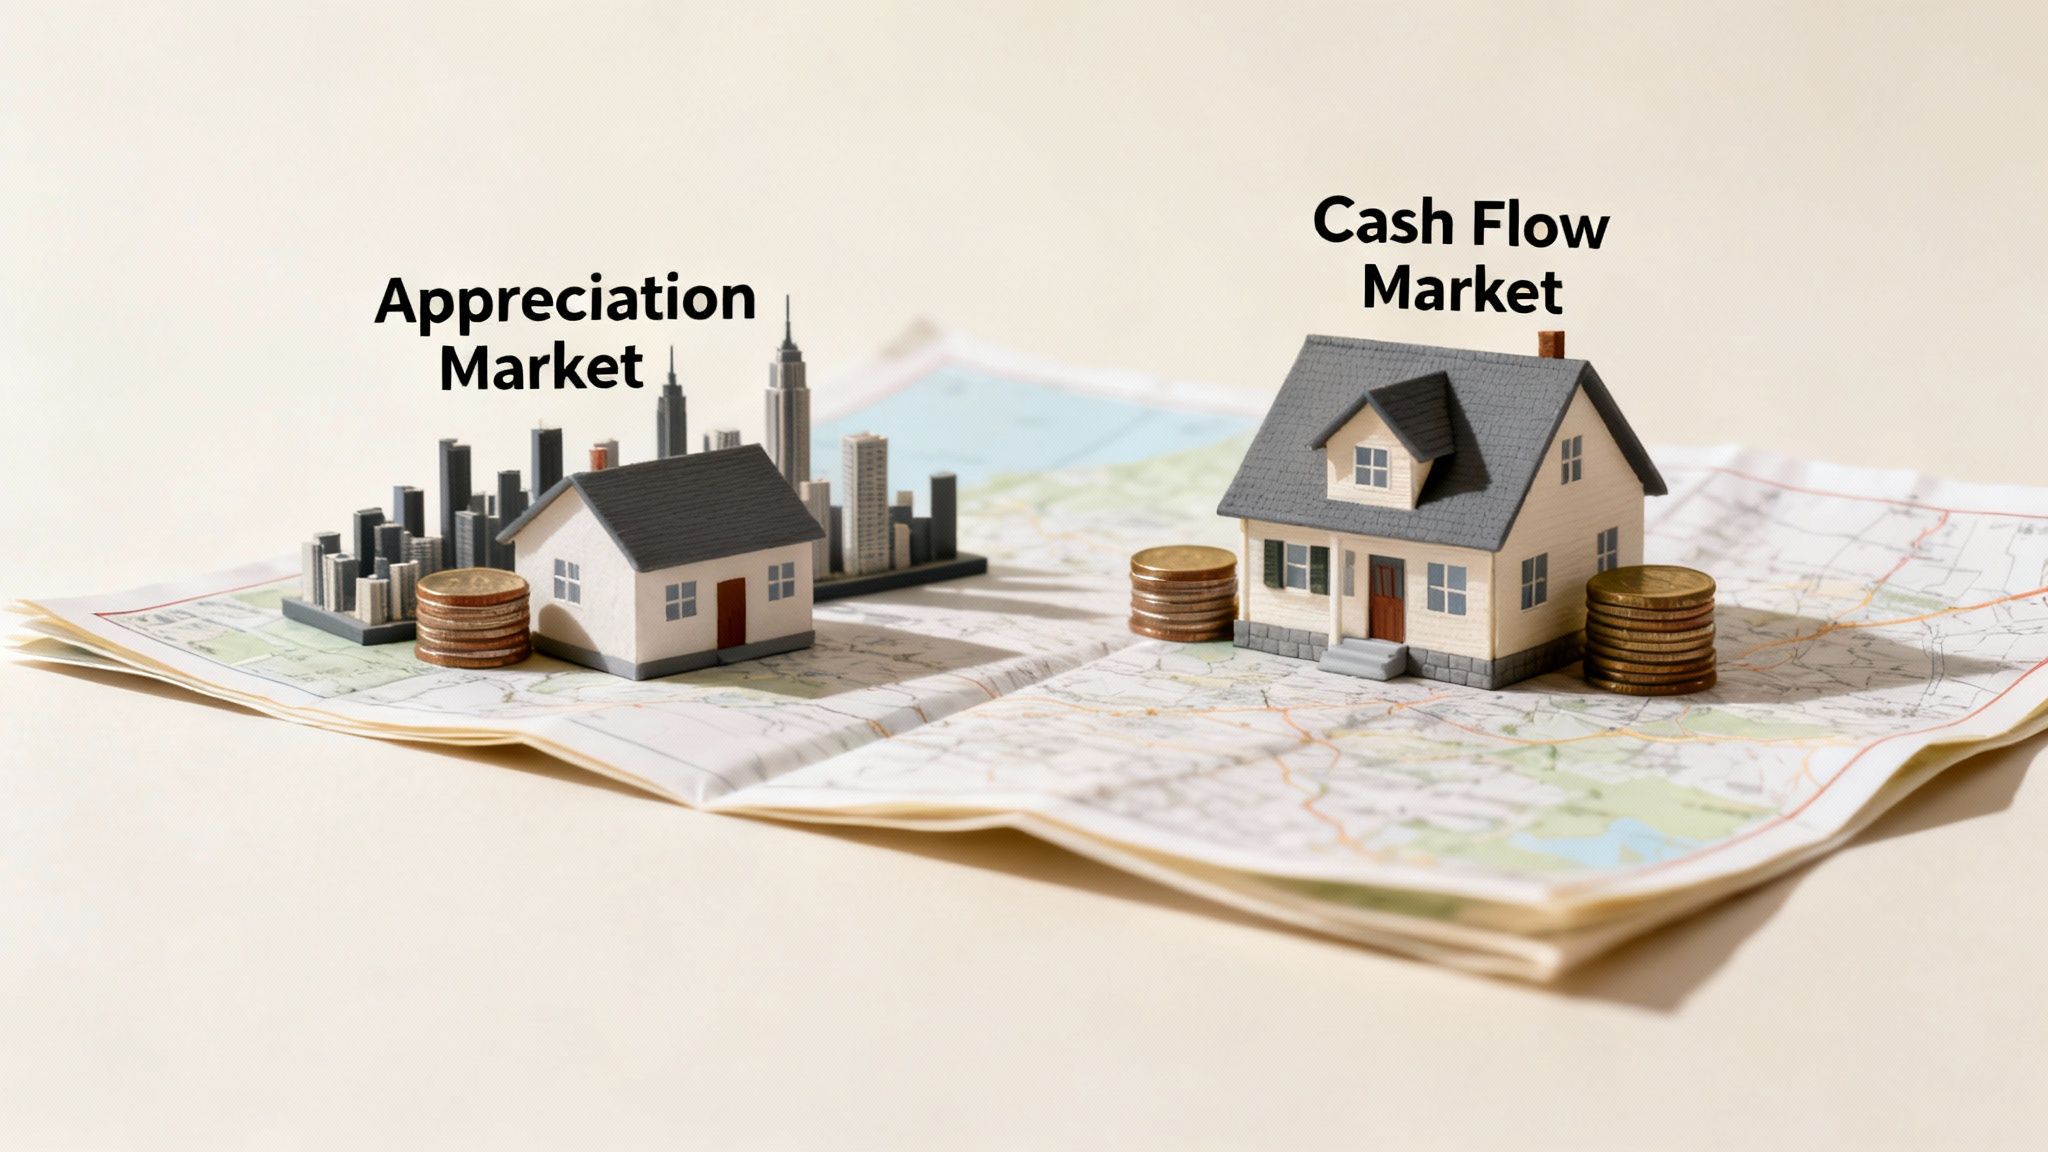
There's no magic number for a "good" return on a rental property. It’s a classic case of "it depends"—mostly on where and what you buy.
Think about it this way: a 5% return might be a home run in a rapidly growing coastal city, but that same 5% could be a serious underperformance in a stable, slow-growth town. The entire game boils down to a fundamental trade-off every real estate investor has to make: cash flow versus appreciation.
Your entire investment strategy really hangs on which side of that coin you land on. Some markets are built to put money in your pocket every month, while others are all about playing the long game for wealth growth.
Cash Flow Markets Versus Appreciation Markets
I like to think of cash flow markets as the steady workhorses of the real estate world. You'll often find these in places like the Midwest and parts of the Sun Belt, where home prices are reasonable compared to what you can charge for rent. The name of the game here is simple: generate positive income from day one.
On the flip side, you have appreciation markets. These are the high-flyers—think expensive coastal cities or bustling tech hubs where property values are expected to shoot up over time. The monthly cash flow might be razor-thin (or even negative), but the real prize is the potential for a massive payout when you eventually sell.
The key takeaway is that you can rarely have it all. Investors must choose between maximizing immediate monthly income or banking on future property value increases. Your financial goals should dictate which type of market you target.
Geography plays a huge role in what a good return looks like. In a classic appreciation-heavy market like San Francisco, you might see rental yields of only 5.34%. But in many secondary cities, it’s not uncommon to find yields topping 7-8%, which means much stronger cash returns right out of the gate.
This is why a deal promising an 8% cash-on-cash return in an up-and-coming neighborhood is fairly standard, whereas you might only see 3-4% for the same type of property in a well-established, expensive area.
How Property Type Influences Your Returns
Beyond just the city or state, the kind of property you buy shapes your return potential in a big way. Each asset class has its own financial personality. For a deeper dive into comparing different types of properties, it helps to understand what is a good cap rate, as it's the go-to metric for this.
- Single-Family Homes: These are great for attracting long-term tenants, which means less hassle with turnover and vacancies. They often appreciate well, but with only one rent check coming in, the initial cash flow can be modest.
- Duplexes and Small Multifamily: Now we're talking cash flow. With multiple income streams under one roof, you spread out your vacancy risk. If one unit is empty, you still have others paying the bills. This makes them income-generating powerhouses.
- Condos and Townhomes: These can be a fantastic way to get into an expensive market without a massive down payment. The big watch-out here is HOA fees, which can take a serious bite out of your monthly profits and potentially slow down appreciation compared to single-family homes.
At the end of the day, success comes from aligning the market you choose and the property you buy with your personal financial goals. It's all about deciding if you want cash now or a bigger payday later.
Let's Run the Numbers: A Real-World Deal Analysis
Alright, let's move beyond the theory and get our hands dirty. Abstract formulas are one thing, but nothing beats plugging real numbers into a deal to see if it holds up. This is where you separate the good deals from the money pits.
We'll walk through an analysis of a single-family home to see what these returns look like in practice.
Imagine you've found a single-family home that looks promising. The asking price is $350,000. You're planning a standard 20% down payment, which comes out to $70,000. After factoring in another $10,000 for closing costs and a few minor repairs to get it rent-ready, your total cash out-of-pocket is $80,000.
So, is it a good investment? Let's find out.
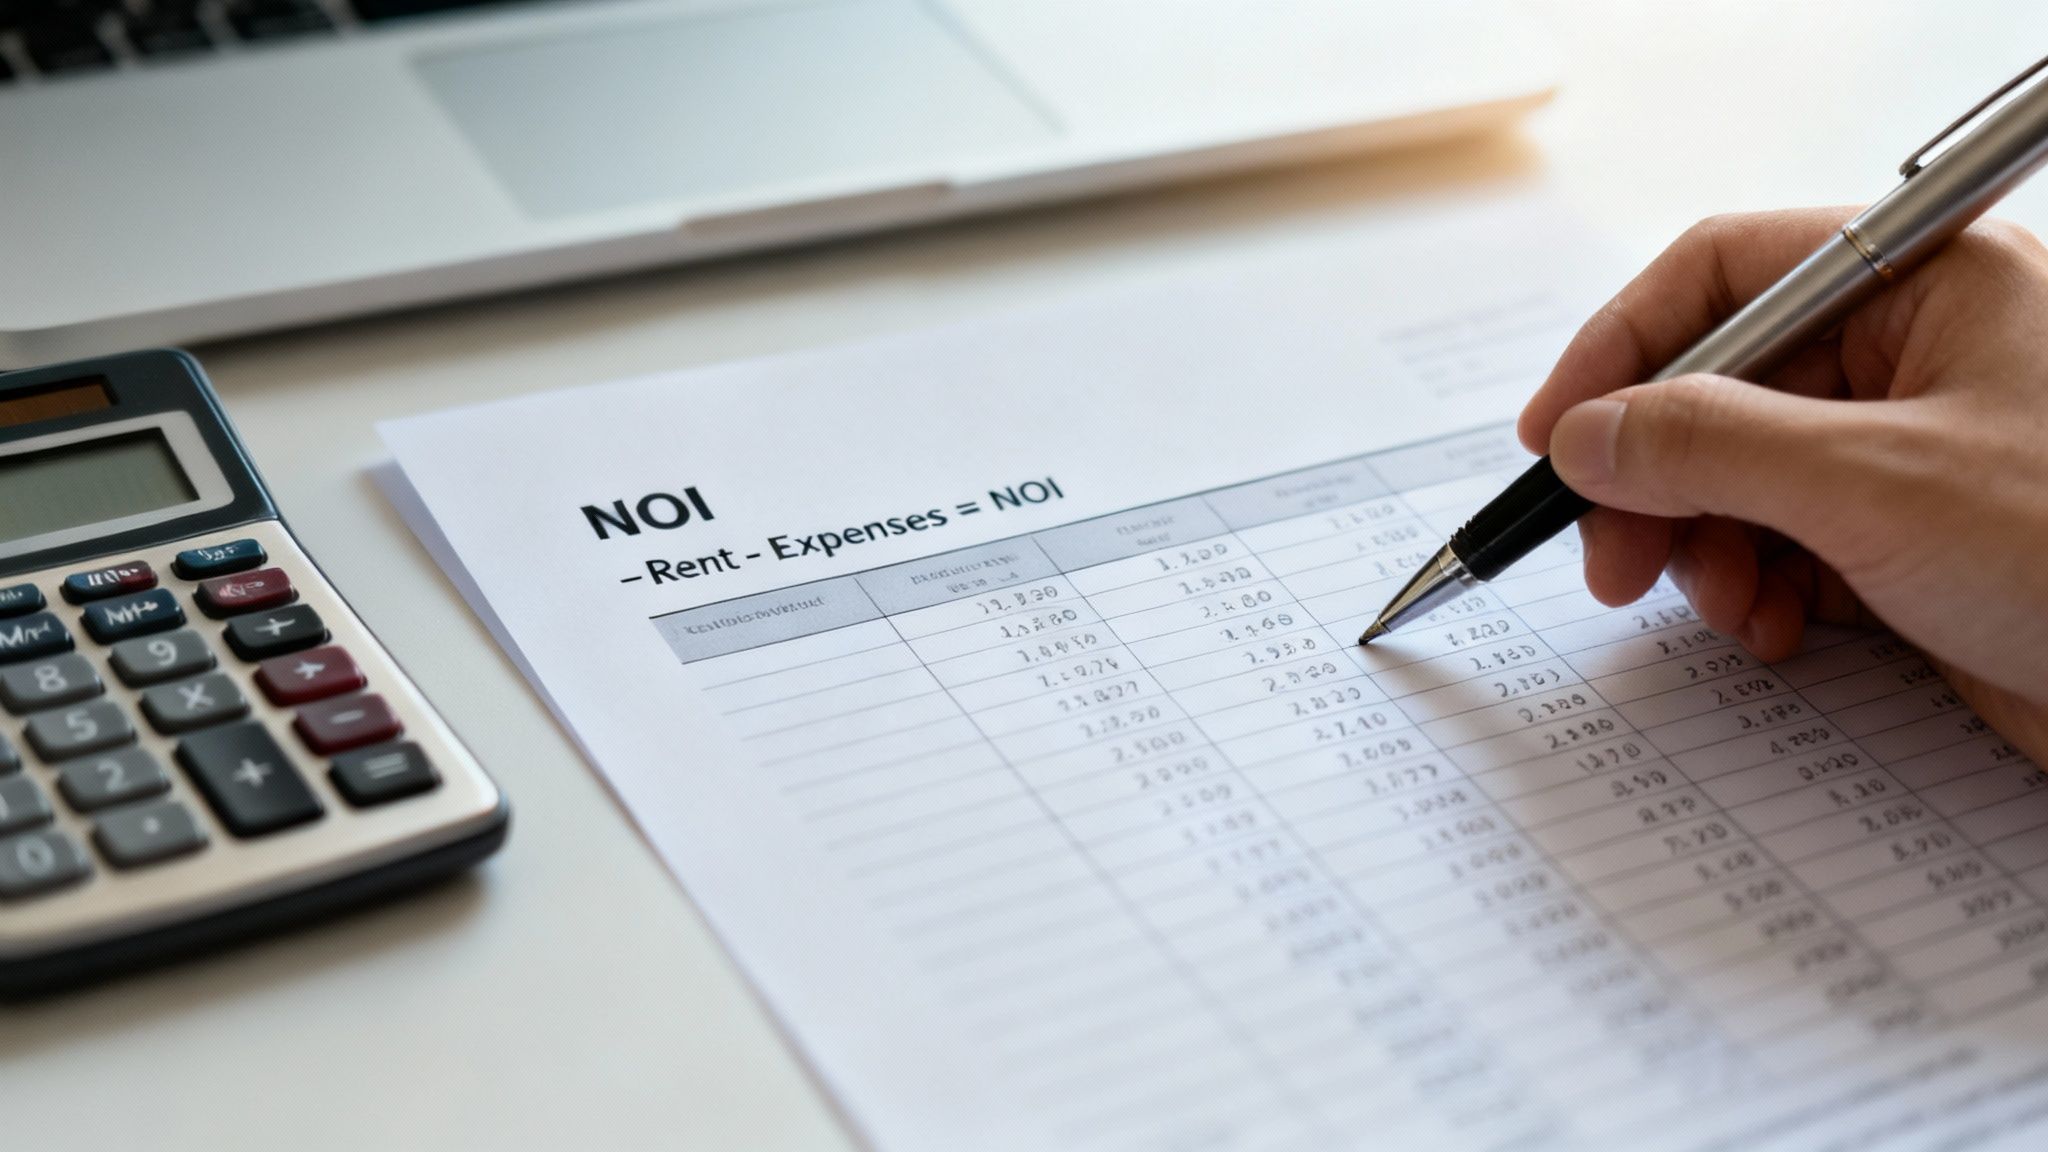
Step 1: Nailing Down the Net Operating Income (NOI)
First things first, we need to figure out the property's Net Operating Income, or NOI. Think of NOI as the property's pure, unleveraged profit potential. It's all the income it generates minus all the costs to run it—before you even think about the mortgage payment. This number tells you how well the asset itself performs.
After checking out comparable rentals in the area, you're confident you can get $2,800 per month in rent.
- Gross Annual Income: $2,800/month x 12 months = $33,600
Easy enough. Now for the expenses. This is where a lot of new investors get into trouble by underestimating costs. You have to be brutally realistic here.
- Property Taxes: $4,200 per year
- Homeowners Insurance: $1,500 per year
- Vacancy Fund (5% of gross rent): $1,680 per year (You won't have a tenant 100% of the time!)
- Maintenance & Repairs (8% of gross rent): $2,688 per year (Things will break.)
- Property Management (optional, 8%): $2,688 per year (Even if you self-manage, it's smart to include this.)
It's also crucial to remember the big-ticket items that pop up every 10-20 years. A new roof, an HVAC system, a water heater—these are capital expenditures. For a deeper dive, understanding capital expenditures is a must-read for budgeting accurately.
Let's tally it all up.
NOI Calculation:
$33,600 (Gross Income) - $12,756 (Total Operating Expenses) = $20,844 (NOI)
With an NOI of $20,844, we can quickly find our Cap Rate. Just divide the NOI by the purchase price: $20,844 / $350,000 = 5.96%. That number falls right in the middle of our healthy 4-10% range. So far, so good.
Step 2: Finding Your True Cash Flow and Cash-on-Cash Return
Okay, the property itself looks decent. But now we need to bring your financing into the picture to see what you’ll actually take home.
Your loan is for $280,000. At a 6.5% interest rate on a 30-year term, your monthly principal and interest payment works out to $1,770. Annually, that’s $21,240.
Now, let's see what’s left after paying the bank.
- Annual Cash Flow: $20,844 (NOI) - $21,240 (Annual Mortgage) = -$396
Wait a second. We’re losing $396 a year? That’s $33 out of our pocket every single month. This is something the Cap Rate completely missed.
Finally, let's calculate the metric that matters most to leveraged investors: the Cash-on-Cash Return. This tells you what kind of return you're getting on the actual money you put into the deal.
Cash-on-Cash Return Calculation:
-$396 (Annual Cash Flow) / $80,000 (Total Cash Invested) = -0.49%
A negative return. That's a deal-breaker.
This example is the perfect illustration of why you must run all the numbers. A decent cap rate doesn't automatically mean it's a good deal for you.
Doing these calculations by hand for every potential property gets old fast, which is why software is a game-changer. Our rental property return on investment calculator can help you model these scenarios in seconds.
With a tool like Property Scout 360, all of this critical data is laid out clearly, helping you spot the duds and focus on the deals that actually meet your goals.
Comparing Rental Property Returns to the Stock Market
Investors always ask: "Should I put my money in a rental property or just stick it in the stock market?" It's a fair question, but we're not always comparing apples to apples. Both can make you wealthy over time, but they get you there on very different paths.
The stock market, usually benchmarked against the S&P 500, has simplicity on its side. You can buy and sell shares with a few clicks. Real estate is different. It’s a tangible asset you can see and touch, and that physical nature comes with some powerful advantages you just don't get from owning a piece of a company.
Beyond the Headline Numbers
It’s tempting to look at historical averages and call it a day. Long-term, both have been incredible wealth-building machines. But which one comes out on top depends entirely on the timeframe you look at. One study found that from 2000-2025, both delivered nearly identical inflation-adjusted returns of about 5% annually. But if you zoom out from 1928-2023, stocks averaged 9.8% while real estate came in at 4.2%. You can discover more insights about these historical comparisons and see why the numbers can fluctuate so much.
But looking only at these top-line figures misses real estate’s biggest ace in the hole.
The single biggest advantage rental property investors have over stock market investors is leverage. You can use a mortgage to control a $300,000 asset with only $60,000 of your own money. This ability to magnify your investment power is something you simply can't do safely in the stock market.
This is a game-changer. Using leverage can take a modest 4% annual appreciation on a property and transform it into a massive 20% return on the actual cash you invested.
The Unique Benefits of Owning Real Estate
Leverage is just the beginning. Rental properties come with a whole suite of perks that stocks just can't offer, creating a more stable, tax-friendly, and controllable investment.
- Tax Advantages: This is a huge one. As a landlord, you can deduct mortgage interest, property taxes, insurance, repairs, and even depreciation. Depreciation is a non-cash "paper loss" that can shield a big chunk of your rental income from taxes.
- Inflation Hedge: When inflation drives up the cost of everything else, it also drives up rents and property values. Your investment grows alongside the economy, protecting your purchasing power.
- Direct Control: You're in the driver's seat. You can renovate the kitchen to force appreciation, meticulously screen tenants to ensure you get paid on time, and shop around for better insurance rates to cut expenses. You have a direct impact on your investment’s performance.
- Less Volatility: Real estate markets move in cycles, but they don't have the stomach-churning daily swings of the stock market. That stability provides a lot of peace of mind for long-term investors.
So, what's the right choice? It really boils down to your goals and personality. If you want totally passive growth and the ability to get your cash out quickly, the stock market is a great fit. But if you want a hands-on way to build wealth using cash flow, appreciation, loan paydown, and powerful tax benefits, rental properties are tough to beat.
Answering Your Top Questions About Rental Returns
Once you start looking seriously at rental properties, you’ll find the same questions keep coming up. They're the kind of sticking points that can cause "analysis paralysis" and stop you from ever making a move. Let’s cut through the noise and give you some straight answers from the field.
Should I Focus More on Cash Flow or Appreciation?
This is the classic investor dilemma, and the truth is, the "right" answer comes down to your personal strategy and what you need the money for.
If your goal is to generate income right now—maybe to supplement your job or start funding retirement—then you need to be a cash flow investor. Your main focus will be finding properties with a strong cash-on-cash return, shooting for 8% or higher. These deals are often found in steady, affordable markets where the rents comfortably cover all your expenses.
On the other hand, if you already have a solid income and you're playing the long game for wealth creation, you can afford to prioritize appreciation. These properties might only break even or produce a little cash flow (3-5%), but they’re in high-growth areas where you expect a big payoff when you sell down the road. Most experienced investors try to find a sweet spot: a property with decent cash flow today and a good shot at appreciating over time.
How Much Should I Budget for Maintenance and Repairs?
This is where so many new investors get burned. Underestimating what it costs to keep a property in good shape will absolutely wreck your returns. A common rule of thumb is the "1% Rule," which suggests saving 1% of the home's value each year for maintenance. So, for a $300,000 house, that’s $3,000 a year, or $250 a month.
Another way people estimate this is by setting aside 5-10% of the monthly rent. These are decent starting points, but you have to look at the actual property in front of you. A brand-new build won't need much for the first few years, but a 50-year-old house with an original roof is a completely different story.
Is a Negative Cash Flow Property Ever a Good Investment?
For 99% of investors, especially if you're just starting out, the answer is a hard no. When a property has negative cash flow, you're losing money every single month. That means you’re feeding it from your own pocket, which is a stressful, risky, and frankly unsustainable way to invest.
Now, can it ever make sense? Yes, but it's a high-stakes game for seasoned investors with deep pockets. They might buy a negative cash flow property in a market that's appreciating like crazy, betting that the future price gains will massively outweigh the monthly losses. Before even thinking about a deal like this, you have to be positive you can cover the losses for years if the market turns.
A property with negative cash flow is a speculative bet, not a foundational investment. It relies on market forces you cannot control, whereas positive cash flow provides a safety net that pays you to wait for appreciation to happen.
Is the 2% Rule for Rental Properties Still Relevant?
The 2% Rule—the idea that monthly rent should be at least 2% of the purchase price (like $2,000 rent on a $100,000 property)—is pretty much a relic of the past. In today’s market, with how much home prices have risen, finding a property that meets this standard is like finding a unicorn. If you hold out for a 2% deal, you’ll probably never buy anything.
A more realistic target today is the 1% Rule, and even that's tough to hit in pricier coastal cities. Instead of getting hung up on these old rules, you're far better off analyzing each deal individually. Run the real numbers to find the actual cap rate and cash-on-cash return—that’s what tells you if you have a winner.
Stop guessing and start analyzing. Property Scout 360 gives you the power to run these scenarios in seconds, compare deals side-by-side, and make investment decisions based on data, not just rules of thumb. Find your next profitable rental at Property Scout 360.
About the Author
Related Articles
2026 Investor's Guide: Cost of Installing a Sewer Clean Out
Understand the cost of installing a sewer clean out for investment properties in 2026. Get expert advice on prices, ROI, & budgeting for flips. Plan smart!
15 Year vs 30 Year Mortgage: The Investor's Choice
Deciding between a 15 year vs 30 year mortgage for a rental property? Our guide analyzes cash flow, ROI, and equity to help you pick the best loan.
Real Estate Appraisal Software: Features & Limits
Discover what real estate appraisal software is, its core features, and limits. See how it differs from investment tools for profitable deals.