How to Analyze Real Estate Investment Properties Like a Pro
Learn how to analyze real estate investment opportunities with our expert guide. Master cash flow, ROI, and risk assessment for smarter property decisions.
To run the numbers on a potential deal, you first have to get the numbers right. A precise analysis hinges on the quality of your inputs—the raw data you gather on the property's price, potential income, and all the little expenses that add up.
Building Your Data Foundation for Accurate Analysis
Any seasoned investor will tell you: a sharp analysis starts long before you ever open a spreadsheet. It begins with a methodical hunt for the right information. The old saying "garbage in, garbage out" is the absolute truth in real estate. Your final calculations will only be as reliable as the data you collect upfront.

Think of yourself as a detective on a case. Your job is to uncover every single financial detail tied to that property, leaving no stone unturned. Getting this part right is non-negotiable, because every calculation that follows—from cash flow to ROI—is built directly on this foundation.
The Essential Data Checklist
Before you can crunch a single number, you need a complete list of inputs. This goes way beyond just the sticker price. A proper analysis demands a granular breakdown of both the one-time costs to acquire the property and all the recurring expenses you'll face month after month.
Here’s a practical checklist to guide your data hunt:
- Acquisition Costs: This is the full "all-in" number. It includes the purchase price, your estimated closing costs (budget 2-5% of the sale price), and any cash you'll need immediately for repairs or renovations to get it rent-ready.
- Rental Income: Don't just take the seller's word for it. You have to verify the market rent by researching similar rentals nearby. Our guide shows you how to pull your own free real estate comps so you can do this yourself.
- Operating Expenses (The "Big Four"): These are your core, non-negotiable costs.
- Taxes: Pull the exact annual property tax amount from the county records online. Never rely on the seller's estimate.
- Insurance: Call an insurance agent and get a real quote for a landlord policy. Don't guess.
- Maintenance & Repairs: A good rule of thumb is to budget 1% of the home's value each year for routine upkeep. For an older property, I'd bump that up to 2% to be safe.
- Capital Expenditures (CapEx): This isn't for leaky faucets; it's for the big-ticket items like a new roof, HVAC system, or water heater. Smart investors set aside 5-10% of the gross rent specifically for CapEx.
Pro Tip: Always, always account for vacancy. No property stays rented 100% of the time. Factoring in a vacancy rate of 5-8% of your potential annual rent is a conservative and safe starting point for most markets.
Sourcing Reliable Information
Knowing what you need is one thing; finding it is another. Your mission is to replace every assumption with a hard fact. If you're considering a short-term rental, a great place to start is with the top sources for Airbnb stats by city, which can give you a real feel for local demand and pricing.
For traditional long-term rentals, these are your best friends:
- Public Records: The county assessor's website is your source of truth for property tax history.
- Local Property Managers: These folks are on the front lines. They know the true market rents, vacancy rates, and what local contractors charge for repairs. A quick phone call is invaluable.
- Insurance Brokers: A five-minute call can get you a precise quote for a landlord policy, removing a huge variable from your expense sheet.
Crunching the Numbers That Really Count
Alright, you've done the legwork and gathered all your data. Now comes the fun part—turning those raw numbers into a clear financial picture. This is where we answer the one question that matters most: "Is this deal actually going to make me money?"
Forget the fluff. We're zeroing in on the handful of metrics that successful investors live and die by. They’ll cut through the sales pitch and show you the real potential of a property. Let's walk through them with a simple, real-world example.
First, Figure Out Your Net Operating Income
Before we can even think about cash in your pocket, we have to calculate the Net Operating Income (NOI). Think of NOI as the property's pure profit before you factor in any mortgage payments. It’s the cleanest way to judge how well the property itself performs as a standalone business.
The formula is super simple:
Gross Rental Income - Total Operating Expenses = Net Operating Income (NOI)
Let's use a sample property to make this tangible. Imagine a single-family rental you expect to lease for $2,200 a month. That gives you an annual gross income of $26,400. Getting this initial rent estimate right is huge, and it's worth learning how to accurately calculate rental income for your properties.
Now, let's pull in those operating expenses we estimated earlier:
- Property Taxes: $3,600
- Insurance: $1,200
- Vacancy (5% of gross rent): $1,320
- Repairs & Maintenance (5%): $1,320
- Capital Expenditures (5%): $1,320
- Property Management (8%): $2,112
When we add all those up, our total operating expenses come to $10,872.
So, the NOI for this property is $26,400 - $10,872 = $15,528 per year. Keep that number handy; it's the foundation for everything else we're about to calculate.
Next, Find Your Actual Cash Flow
NOI is a fantastic metric for comparing one property to another, but it doesn't tell you what you'll actually bank each month. For that, we need to find the Cash Flow, which means bringing your mortgage payment (your debt service) into the picture.
If you want to go deeper on this, our guide to rental property cash flow analysis covers all the nuances.
The math is just one more step:
NOI - Annual Mortgage Payments = Annual Cash Flow
Sticking with our example, let's say your total mortgage payments for the year (principal and interest) are $12,600.
$15,528 (NOI) - $12,600 (Debt Service) = $2,928 Annual Cash Flow
That breaks down to $244 per month. This is the money left over after every single bill—including the mortgage—is paid. This is your profit. Positive cash flow is what keeps your investment portfolio afloat and growing.
Investor Insight: Don't ever confuse cash flow with appreciation. Appreciation is a speculative bonus; cash flow is what pays the bills today. A property that costs you money every month is a liability, no matter how much you hope it will be worth someday.
Finally, Judge the Deal with Key Return Metrics
Okay, we know the property makes money. But is it a good investment? To answer that, we need to calculate returns. These two metrics will help you compare this deal to any other investment, whether it's another property or just putting your money in the stock market.
To make these concepts crystal clear, here’s a quick-reference table.
Key Profitability Metrics Explained
This table breaks down the essential metrics you'll use to evaluate any rental property deal. It's your cheat sheet for moving from raw numbers to a real investment decision.
| Metric | What It Measures | Simple Formula |
|---|---|---|
| Cap Rate | The property's unleveraged return on investment. Great for an apples-to-apples comparison of different properties, ignoring financing. | NOI / Purchase Price |
| Cash-on-Cash Return | The return on the actual cash you invested. This is your personal ROI, telling you how hard your money is working. | Annual Cash Flow / Total Cash Invested |
These two metrics give you the complete picture—one shows the property's inherent profitability, and the other shows your personal return based on your financing.
Let’s apply these to our example property, which we'll say has a purchase price of $300,000.
1. Capitalization Rate (Cap Rate)
The Cap Rate shows the return if you'd paid all cash for the property. It’s a fantastic way to quickly gauge a deal's potential in a specific market.
- Calculation: $15,528 (NOI) / $300,000 (Price) = 5.18% Cap Rate
Whether 5.18% is "good" depends entirely on the market, but it gives you a solid benchmark for comparison.
2. Cash-on-Cash (CoC) Return
For most of us using a loan, this is the number that matters most. It measures the return on every single dollar you personally put into the deal.
- Let's assume you put $60,000 down (20%) and paid $7,500 in closing costs. Your total cash out-of-pocket is $67,500.
- Calculation: $2,928 (Cash Flow) / $67,500 (Total Cash Invested) = 4.34% CoC Return
This tells you that your invested cash is earning you a 4.34% return in the first year. Now you have a real number you can use to decide if this deal meets your personal investment goals.
Of course, doing this by hand for every property gets old fast. Platforms like Property Scout 360 automate all these calculations instantly. This frees you up to spend less time in spreadsheets and more time actually interpreting the results to find great deals.
Modeling Different Financing Scenarios
Finding the right property is only half the battle. How you choose to finance it can make or break the entire deal. Honestly, this is where I see a lot of new investors get tripped up. The right loan can supercharge your returns, while the wrong one can turn a promising property into a financial nightmare that bleeds you dry every month.
It's easy to get tunnel vision and just chase the lowest interest rate. But that's a rookie mistake. The loan term, the size of your down payment, and even the type of mortgage you choose all create a unique financial fingerprint for your investment. Each variable introduces a trade-off, usually between how much cash you pocket each month and how quickly you build real wealth through equity.
The Classic Trade-Off: Cash Flow vs. Equity
Let's get practical and run the numbers on this. We'll use our example property—the one with a $300,000 price tag—and model two of the most common financing strategies I see investors use. This side-by-side comparison will show you just how dramatically your loan choice can swing the outcome.
Scenario A: The Cash Flow Play
This is the go-to for investors who want to maximize their monthly income. The whole game here is to keep that mortgage payment as low as humanly possible.
- Loan Type: 30-Year Fixed Conventional Loan
- Down Payment: 20% ($60,000)
- Interest Rate: 6.5%
- Monthly P&I: $1,517
Scenario B: The Equity Acceleration Plan
In this corner, we have the investor who's playing the long game. They're okay with less cash in their pocket today because they want to own the asset free and clear much faster, turbocharging their equity growth.
- Loan Type: 15-Year Fixed Conventional Loan
- Down Payment: 25% ($75,000)
- Interest Rate: 5.75% (shorter terms usually get you a better rate)
- Monthly P&I: $1,914
Investor Insight: Look at that difference. We're talking $397 every single month. With Scenario A, that's your money. With Scenario B, that money is working behind the scenes to build your net worth. Neither is inherently better; it all boils down to your personal strategy. Are you building a cash flow machine or a long-term wealth engine?
The chart below really drives this point home, showing how these decisions impact your key metrics over a few years.
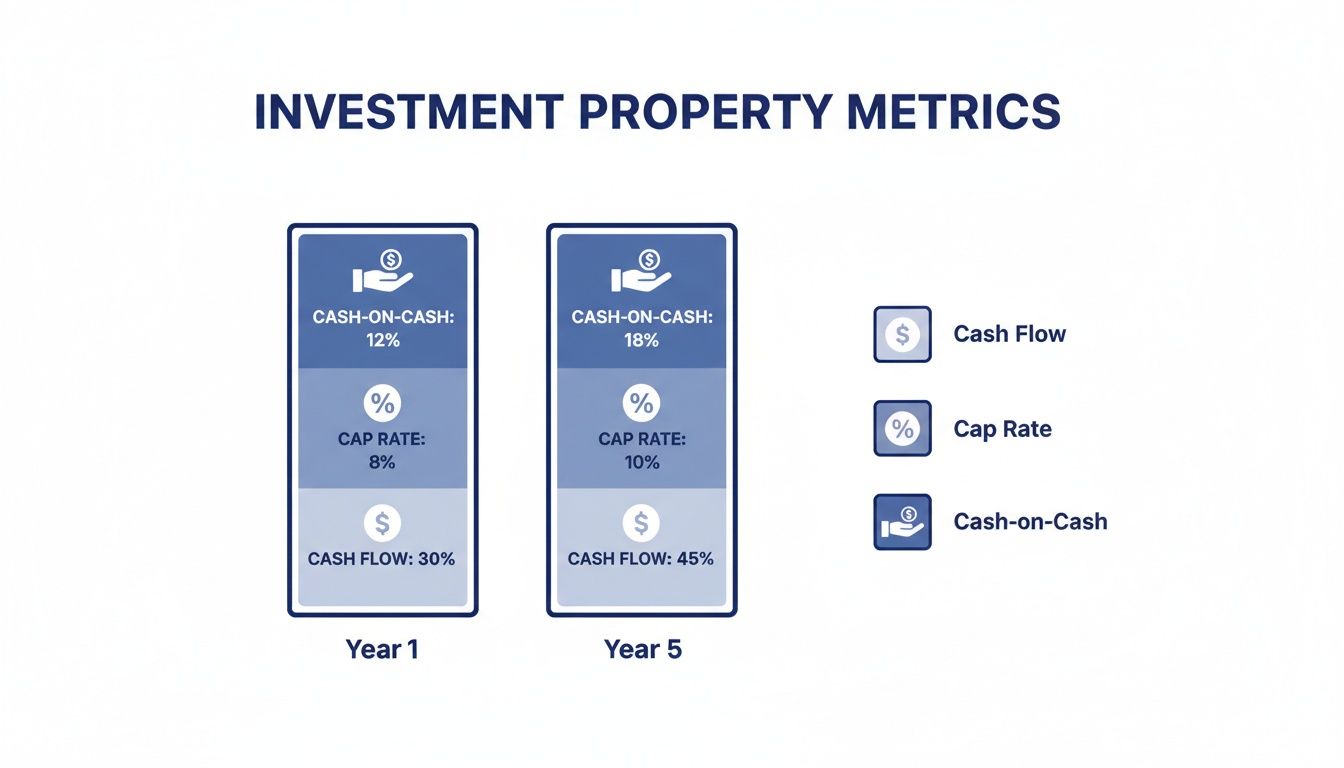
You can see that while things might look similar at the start, the path your investment takes over time changes dramatically based on that initial financing decision.
Let's See the Financial Impact
So, what happens when we plug these new mortgage payments into our analysis? If you recall, the property’s Net Operating Income (NOI) was $15,528 a year.
| Metric | Scenario A (30-Year Loan) | Scenario B (15-Year Loan) |
|---|---|---|
| Annual P&I Payment | $18,204 | $22,968 |
| Annual Cash Flow (NOI - P&I) | -$2,676 (Negative) | -$7,440 (Negative) |
| Principal Paid (Year 1) | $2,642 | $10,031 |
| Cash-on-Cash Return | Negative | Negative |
Hold on a second. Negative cash flow? This is exactly why we run the numbers. This simple exercise just proved that, with today's rates, this particular property is a loser under both scenarios. It would cost you money every month just to own it. An analysis like this is a lifesaver—it tells you that you need to either negotiate a much lower price, find a way to get significantly higher rent, or bring a much larger down payment to the table.
Looking Beyond the Standard 30-Year Mortgage
Don't think your only options are 15- or 30-year loans. The world of real estate financing is way bigger than that, and knowing your options gives you a serious edge. For a deep dive, check out our guide on how to finance a rental property.
But here are a few other structures worth thinking about:
- Interest-Only Loans: These can give your initial cash flow a massive boost since you’re not paying down any principal. They're not for everyone and carry more risk, but they can be a powerful tool for flippers or investors focused on maxing out immediate income.
- Adjustable-Rate Mortgages (ARMs): An ARM can land you a sweet, low introductory rate for a few years (think 5 or 7) before it starts adjusting. This can be a smart play if you're confident you'll sell or refinance before the fixed period ends.
- Seller Financing: Sometimes, the seller themselves will act as the bank. This can open the door to more creative and flexible terms than you'd ever get from a traditional lender, and it’s a great way to get a deal done that might not otherwise work.
The lending environment is always in flux. As interest rates find their new normal, lenders are getting more comfortable again, which is good news for us. But it also means more competition for good deals. By taking the time to model out different financing options, you stop being just a "property buyer" and become a strategic deal-maker who engineers an investment to perfectly match your financial goals.
Don't Fall in Love With Your Spreadsheet: How to Stress-Test Your Deal
Every investor has done it. You plug in the numbers, and the spreadsheet glows with potential. The cash flow looks great, the ROI is solid, and you start mentally spending the profits. But a deal that only works on paper is a fantasy, and in real estate, fantasies can be expensive.
This is where the real work begins. Before you get too attached, you have to kick the tires—hard. You need to stress-test every one of your assumptions to see how the investment holds up when things inevitably go sideways.

This isn't about being pessimistic; it's about being a professional. By building in a margin of safety, you turn potential disasters into manageable inconveniences. It’s what separates the pros who build long-term wealth from speculators who get wiped out by the first surprise.
Pushing Your Numbers to the Breaking Point
The easiest way to start is by playing a simple game of "what if?" The goal is to find the most sensitive variables in your analysis—the ones that can sink your returns—and see what happens when you push them in the wrong direction.
Here are the big ones I always challenge in my own analysis:
- What if vacancy is worse than I think? You might have penciled in a conservative 5% vacancy. That’s a good start, but what if a great tenant leaves and the property sits empty for three months? Rerun your numbers with a 10% or even 15% vacancy rate for the year. See what that does to your cash flow. You might be surprised.
- What if something big breaks? The inspector says the HVAC has "a few years left." That's code for "it could die next winter." How does an unplanned $5,000 bill for a new furnace affect your annual cash-on-cash return? Does it wipe out your entire profit for the year?
- What if I can't get the rent I want? Maybe the market softens, or a new apartment complex opens down the street. Suddenly, you have to drop the rent by $100 a month just to find a tenant. That’s a direct hit to your gross income that can quickly turn a profitable deal into a loser.
By modeling these scenarios, you stop looking at a single, perfect outcome and start seeing a more realistic range of possibilities. This is how you truly analyze a real estate investment opportunity with your eyes wide open.
Finding Your Margin of Safety
One of the most powerful numbers you can calculate is your Break-Even Point. It’s a simple metric that tells you the exact occupancy rate you need to cover every single expense, including your mortgage. It’s the tipping point between making money and losing it.
The formula is pretty straightforward:
(Total Operating Expenses + Annual Mortgage Payments) / Gross Potential Rent = Break-Even Occupancy Rate
Let’s go back to our example property. The total annual costs (with the mortgage from Scenario A) are $29,076. That breaks down to $10,872 in operating expenses plus $18,204 in mortgage payments. The absolute best-case rental income is $26,400.
Hold on—see the problem? The total expenses are higher than the maximum possible rent. This deal is already underwater. The break-even point is over 100%, which is impossible. That’s a massive red flag telling you to run, not walk, away from this deal as-is.
Let's imagine a healthier scenario where the total annual expenses were $21,120.
- Calculation: $21,120 / $26,400 = 0.80
This means the property must be rented out 80% of the year just to cover its costs. Anything above that is profit. If you project a realistic 95% occupancy, the gap between 80% and 95% is your margin of safety. The wider that margin, the more turbulence the investment can handle before it starts costing you money.
Building Your "Good, Bad, and Ugly" Scenarios
A static spreadsheet is a rookie mistake. A professional analysis is a dynamic model. I like to build out separate tabs or columns in my workbook to compare different outcomes right next to each other. Some software, like Property Scout 360, can make this easier by letting you toggle inputs on the fly to see the immediate impact.
Here's a simple way to lay it out:
| Scenario | Vacancy Rate | Major Repair Cost | Monthly Rent | Annual Cash Flow |
|---|---|---|---|---|
| Best Case | 3% | $0 | $2,250 | $5,150 |
| Expected Case | 5% | $1,500 | $2,200 | $1,428 |
| Worst Case | 10% | $5,000 | $2,100 | -$4,908 |
Laying it out like this transforms your analysis from a math problem into a powerful decision-making tool. You're no longer just hoping for the best; you're preparing for the worst, which is the key to investing with confidence.
Connecting Property Numbers to Market Trends
You've stress-tested the numbers, modeled the financing, and the spreadsheet looks fantastic. But here’s the hard truth: even the most perfect on-paper deal can go south if it's in a declining market. A great property in a bad neighborhood is, at the end of the day, still a bad investment.
This final step is all about lifting your head from the calculator and looking at the bigger picture. It’s where you connect your property-level data to the powerful currents of the local market. This is how you figure out not just if a deal is good today, but if it’s positioned to become a great one over the next decade.
Ground-Truthing Your Rent Estimates
First things first, let’s bridge your analysis to reality by confirming your rental income assumptions. Your entire cash flow calculation hinges on hitting a specific rent number, so you have to be absolutely sure it's achievable. This is where you dive deep into local rental comparables, or "comps."
Don't just take the seller's rent roll or Zillow's "Zestimate" at face value. Those can be outdated or wildly optimistic. You need to become a mini-expert on what similar places are actually renting for right now.
- Scour the big rental sites: Check out active listings on Zillow, Apartments.com, and Realtor.com. Look for properties in the immediate area with a similar bed/bath count, square footage, and condition. Crucially, pay attention to how long they’ve been on the market. A property that’s been sitting vacant for 60 days is a huge red flag that the asking rent is too high.
- Call on "For Rent" signs: This is an old-school tactic that still works wonders. Driving the neighborhood and calling the numbers on yard signs connects you directly with local landlords and property managers. They'll give you priceless, on-the-ground intelligence you can't find online.
- Talk to local Property Managers: Even if you plan to self-manage, property managers are a goldmine of information. Call a few and ask them what they think your target property could realistically rent for. Their answer is based on direct, daily experience, not some algorithm.
This whole process does more than just validate a number on a spreadsheet. It gives you a genuine feel for the local rental demand and what you're up against.
Interpreting Broader Market Dynamics
With your rent number confirmed, it's time to zoom out even further. Think of your property as a boat and the local market as the tide. A rising economic tide lifts all boats, but a receding one can leave even the best-looking ship stranded. When you invest in a piece of real estate, you are fundamentally placing a bet on the future of that specific town or city.
A thriving market can forgive a few minor analytical mistakes, but a declining market will punish even the most carefully calculated investment. Understanding the direction of the local economy is your ultimate margin of safety.
To get this right, focus on the three core drivers of real estate value:
- Job Growth: Are companies moving in or packing up and leaving? A market with a diverse and growing job base creates a steady stream of new residents who all need a place to live. Check out data from the U.S. Bureau of Labor Statistics or the websites for local economic development agencies.
- Population Shifts: Is the city's population growing, shrinking, or staying flat? Census data and reports from city planning departments can reveal the long-term trends. Consistent population growth is a powerful tailwind for both rental demand and property values.
- Housing Supply vs. Demand: This is where the macro trends hit home. Globally, we're seeing a massive housing supply shortage, which is one of the most compelling long-term drivers for real estate returns. This structural imbalance creates powerful momentum for residential investors, especially as over 80% of households in many developed economies are shifting toward renting. You can get more details in this fantastic global living report from Hines.
When you find a market with strong job creation, positive population growth, and a housing shortage, you’ve hit the trifecta. That’s the ideal environment for an investment, as it supports both rising rents and long-term appreciation. It’s what turns your good deal into a truly great one.
Answering the Tough Questions in Real Estate Analysis
Even with a dialed-in process and the best software, you're going to have questions pop up as you dig into a potential deal. That's normal. Getting a handle on these common sticking points is what separates the pros from the rookies and gives you the confidence to act decisively.
Let's tackle some of the most frequent questions I hear from other investors.
What’s a Good Cash-on-Cash Return for a Rental?
Everyone wants a magic number, but the honest answer is: it depends. That said, a solid starting point for many experienced investors is a Cash-on-Cash Return between 8% and 12%. This range usually signals a property that can comfortably pay its own way while leaving you with a decent return on your invested capital.
But your market and personal strategy are everything.
- In a hot, high-appreciation market like Austin or Denver, you might be thrilled to find a deal with a 5-7% CoC return. You're making a trade-off, sacrificing some immediate cash flow for the potential of massive long-term appreciation.
- On the flip side, if you're investing in a stable Midwest market known for cash flow, you might not even glance at a property unless it’s projecting 12% or higher from day one.
The real question is, what's a "good" return for you? If you need the income now, you'll chase a higher CoC. If you're playing the long game for wealth-building, you can afford to prioritize appreciation potential.
How Does the 1 Percent Rule Actually Help?
Think of the 1% Rule as a quick and dirty filter, not a full-blown analysis tool. The rule of thumb suggests that a property's gross monthly rent should be at least 1% of the purchase price. So, a $250,000 house should rent for $2,500 per month to pass the initial sniff test.
It’s incredibly useful for culling a long list of potential deals. If a property is hitting that 1% mark, it’s probably worth your time to run the full numbers. If it’s way off, you can likely toss it aside and move on to the next one without a second thought. Just be warned: in many expensive coastal cities, this rule is a unicorn—almost impossible to find.
What are the Most Commonly Overlooked Expenses?
I see new investors make the same mistakes over and over, and it almost always comes down to underestimating three key expenses. Get these wrong, and your "profitable" deal will quickly become a money pit.
- Capital Expenditures (CapEx): This isn't for a running toilet; it's for the big-ticket items that eventually fail. We're talking a new roof ($10,000+), an HVAC system ($7,000+), or a hot water heater. If you aren't setting aside 5-10% of your gross rent for these inevitable costs, you're not analyzing a deal—you're gambling.
- Vacancy Costs: No property is rented 365 days a year, forever. Tenants move out. It takes time to clean, repair, and find a new one. A conservative estimate is to budget for one month of lost rent per year, which works out to an ~8% vacancy rate. This cushion protects you from the cash-flow crunch between tenants.
- Property Management Fees: "But I'm going to manage it myself!" I hear this all the time. Great, but you should still budget for the expense (8-10% of gross rent). Why? First, it ensures the numbers still work if you ever want your time back and decide to hire a professional. Second, it pays you for your own labor. Your time isn't free.
Should I Chase Cash Flow or Appreciation?
This is the classic debate, and there’s no single right answer. It all comes back to your personal financial picture and what you want to achieve.
- Prioritize Cash Flow If: You’re looking for income to cover your bills, you’re nearing retirement, or you want your portfolio to become self-sufficient as quickly as possible.
- Prioritize Appreciation If: You have a long investment horizon (10+ years), you’re in a high tax bracket where more monthly income isn't critical, and your main goal is building transformational long-term wealth.
Of course, the holy grail is finding a property that does both. Many savvy investors look for a hybrid—a property in a market with strong growth potential that still produces at least some positive cash flow from the very beginning.
Ready to stop guessing and start analyzing deals with confidence? Property Scout 360 eliminates the spreadsheet headaches by delivering instant ROI, cash flow, and market analysis for any U.S. property. Find your next profitable investment in minutes.
About the Author
Related Articles
2026 Investor's Guide: Cost of Installing a Sewer Clean Out
Understand the cost of installing a sewer clean out for investment properties in 2026. Get expert advice on prices, ROI, & budgeting for flips. Plan smart!
15 Year vs 30 Year Mortgage: The Investor's Choice
Deciding between a 15 year vs 30 year mortgage for a rental property? Our guide analyzes cash flow, ROI, and equity to help you pick the best loan.
Real Estate Appraisal Software: Features & Limits
Discover what real estate appraisal software is, its core features, and limits. See how it differs from investment tools for profitable deals.