Calculating Equity Multiple A Real Estate Investor's Guide
Learn how calculating equity multiple reveals an investment's true profit potential. This guide offers practical examples and expert insights for investors.
Calculating the equity multiple is a simple yet powerful way to answer a single, vital question for any real estate deal: how many times over will I get my initial investment back? This metric shows the total cash you receive divided by the total cash you invested over the entire life of the project.
What Is Equity Multiple and Why Does It Matter?
At its core, the equity multiple is one of the most intuitive metrics in real estate investing. It cuts through the complex financial jargon to give you a single, clear number representing the total return on your invested capital.
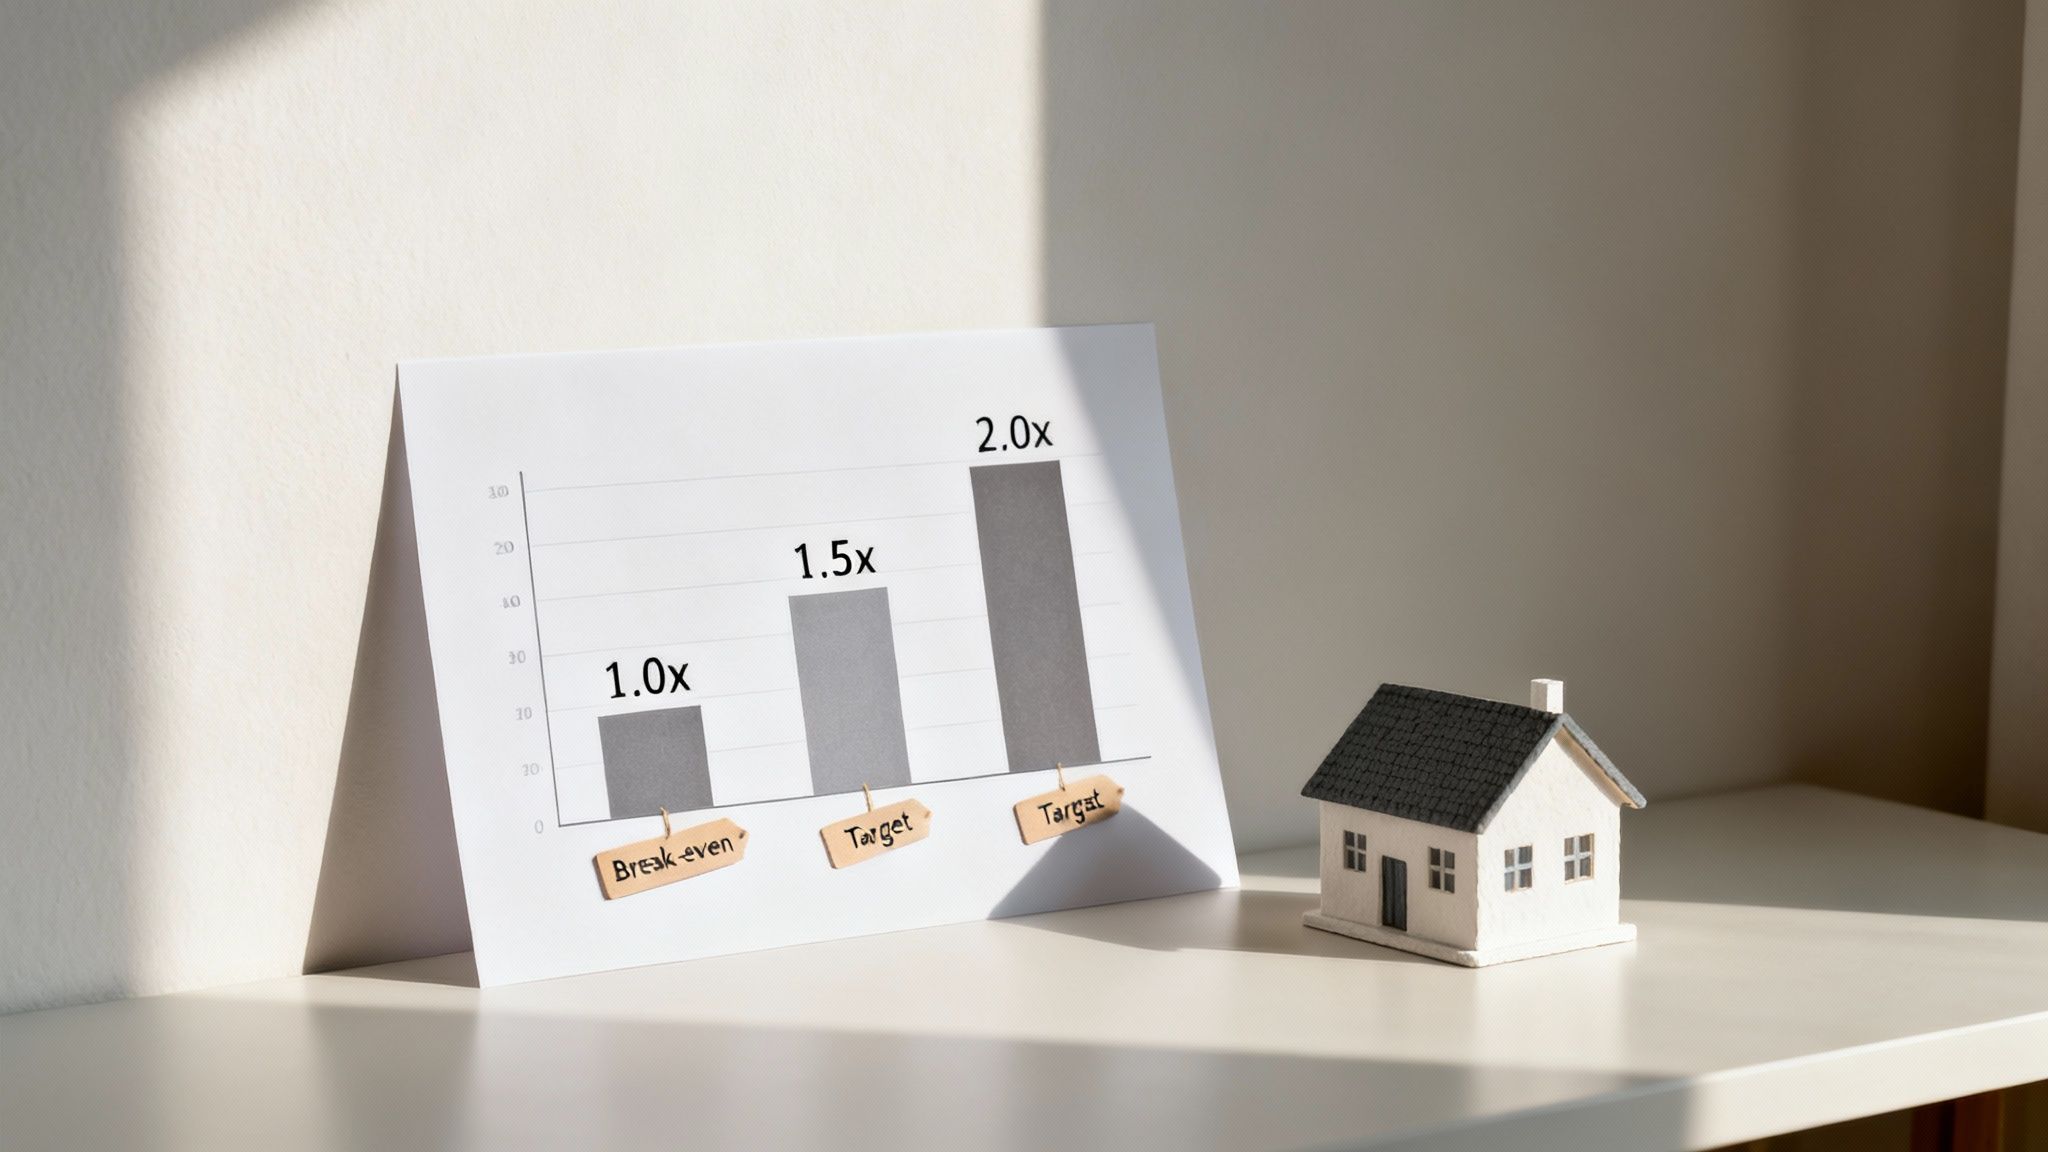
Think of it this way: a multiple of 1.0x means you broke even. You got back exactly what you put in.
Anything less than 1.0x means you lost money, while anything greater signals a profit. So, if you see a 2.5x equity multiple, it means that for every dollar you invested, you got $2.50 back—that's your original dollar plus another $1.50 in profit. This kind of clarity makes it an indispensable tool for quickly sizing up the lifetime profitability of a deal.
The Core Formula Explained
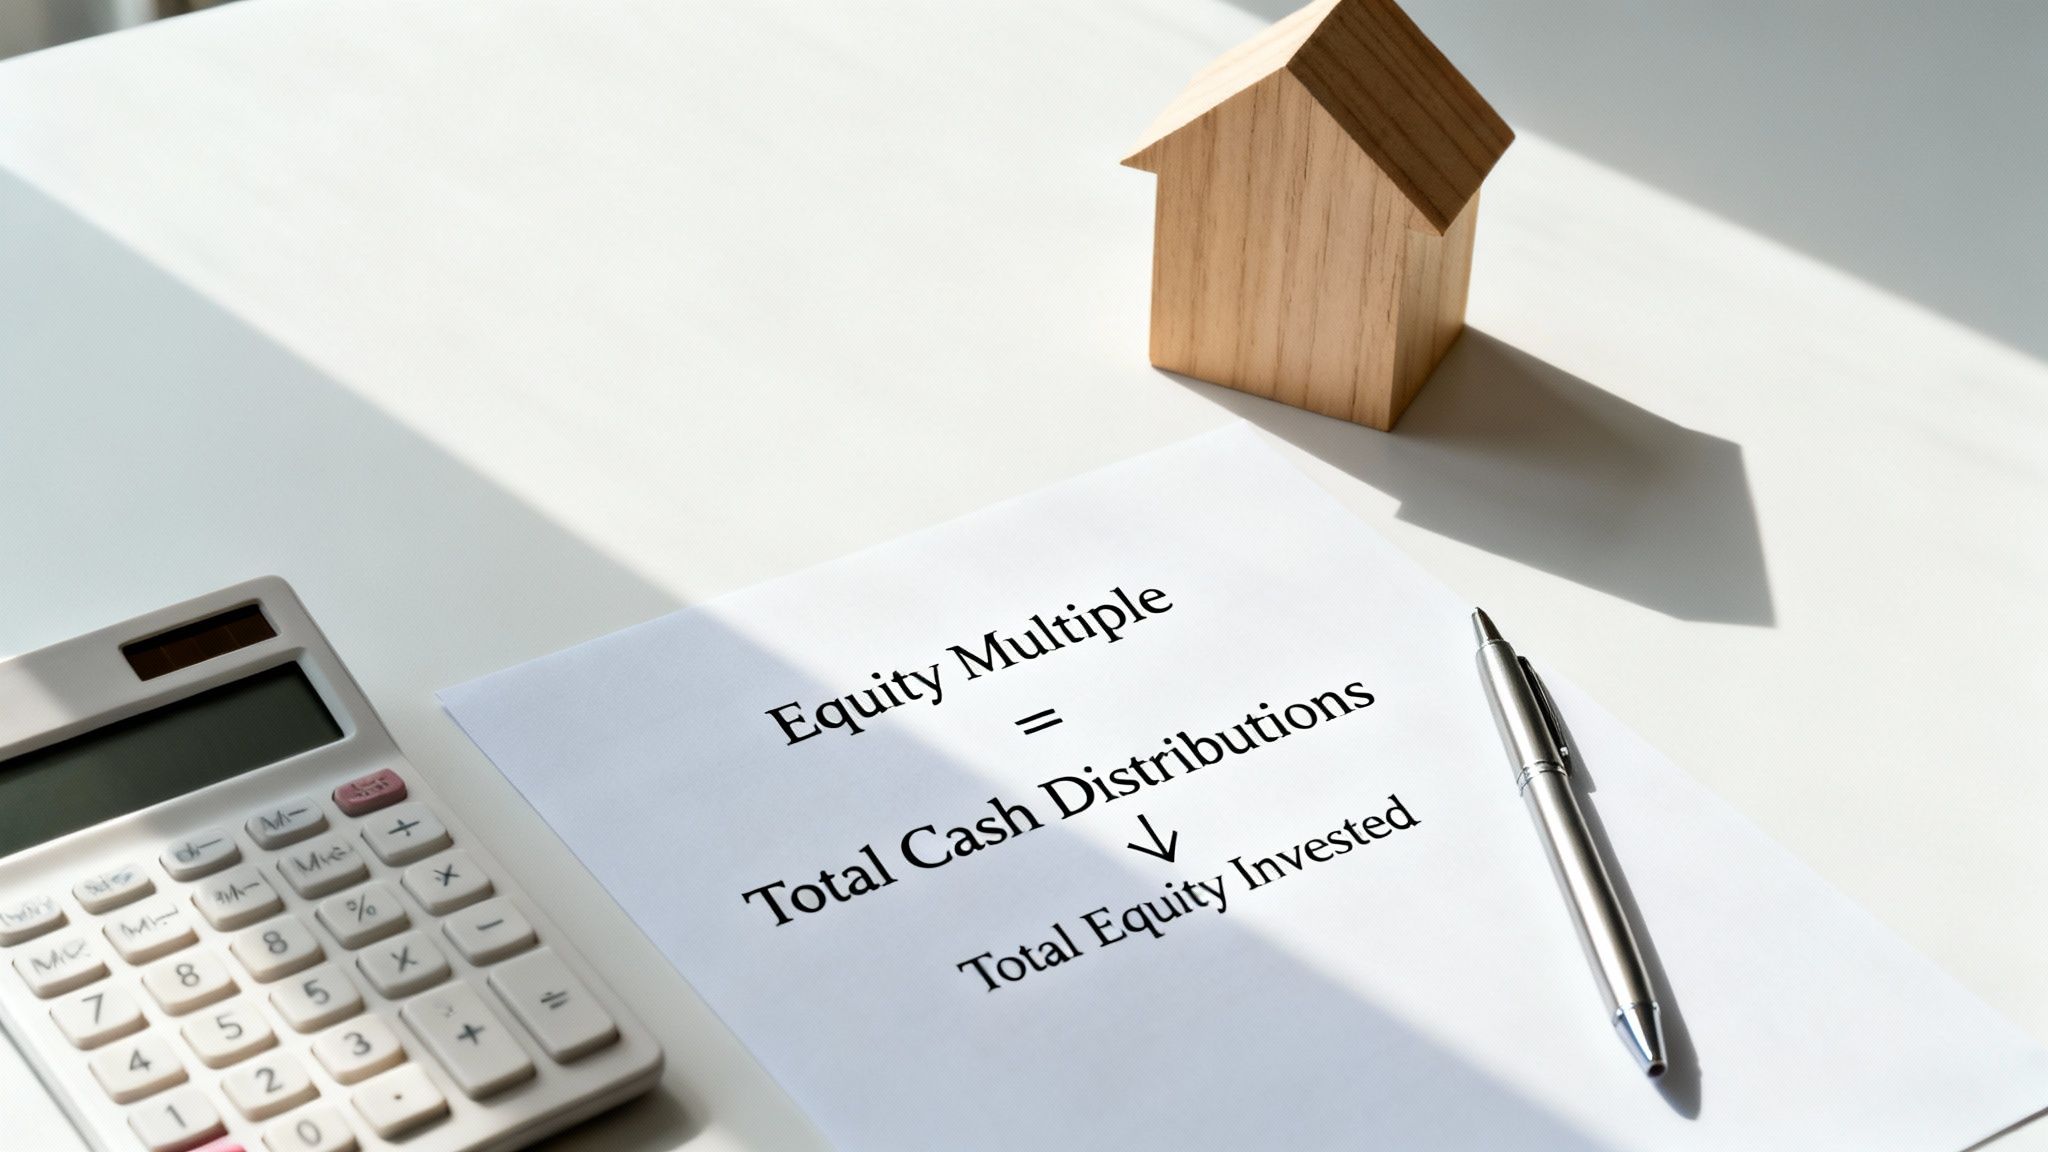
The formula itself is refreshingly simple:
Equity Multiple = Total Cash Distributions / Total Equity Invested
Let's quickly unpack these two components. Getting the inputs right is everything, as a miscalculation here can throw off your entire analysis.
The table below breaks down exactly what to include in each part of the formula.
Equity Multiple Calculation Components at a Glance
| Component | What It Includes | Example |
|---|---|---|
| Total Cash Distributions | The sum of all cash you receive from the investment over the entire holding period. | Net rental income, proceeds from a cash-out refinance, and the final net profit from the sale of the property. |
| Total Equity Invested | All the cash you've put into the deal from day one. | The down payment, closing costs, renovation budgets, and any additional capital you contribute later on. |
By capturing the entire lifecycle of an investment—from the first check you write to the final wire you receive—the equity multiple provides a complete picture of performance. It tells the story of how much wealth an asset generated relative to the capital it took to acquire and run it. For that reason alone, it's an essential metric for any serious investor.
Getting the Right Numbers for the Equity Multiple
The equity multiple calculation is incredibly straightforward, but it has one major weakness: it's only as good as the numbers you plug into it. The old saying "garbage in, garbage out" is especially true here. To get a realistic picture of a deal's potential, you need to be precise.
This is why seasoned investors always start with a deep dive into the property's financials, often through a detailed STR property evaluation, to make sure every projection is based on solid ground, not just wishful thinking.
The process boils down to tracking every single dollar that goes into the deal and every dollar that comes out over the entire time you plan to own it. Let's break down exactly what you need to track.
Identifying Your Total Equity Invested
This is the denominator of the equity multiple formula—every dollar of your own cash you put into the investment. A lot of new investors make the mistake of thinking this is just the down payment. That's a huge oversight and will absolutely give you a misleading, inflated multiple.
To get the real number for Total Equity Invested, you have to include everything:
- The Down Payment: This is the obvious one, the initial chunk of cash to buy the property.
- Closing Costs: Don't forget these. Fees for title insurance, lawyers, appraisals, and loan origination can easily add up to 2-5% of the purchase price.
- Initial Renovation Budget: If you're planning any upfront repairs or improvements to add value, that cash is part of your initial investment.
- Future Capital Calls: Are you setting aside cash for a new roof in year five? Or might you need to inject more capital for other big projects? That's part of your total equity, too.
If you miss any of these, you’re understating your actual investment and making the deal look better on paper than it really is. If you need help keeping all this straight, a good spreadsheet can be a lifesaver. You can find out more in our guide on using a rental property analyzer spreadsheet.
Tallying Up Your Total Cash Distributions
Now for the fun part—the numerator. Total Cash Distributions represents every dollar the investment returns to you over its entire life. This is your total take-home, and it’s about a lot more than just what you pocket when you sell.
A classic rookie mistake is to only focus on the profit at sale. A sharp analysis accounts for every dollar the property generates, from the monthly rent checks to any cash you pull out along the way.
To get this number right, you need to add up a few key streams of cash:
- Cumulative Net Operating Income (NOI): This is your rental income after paying all the property’s bills, summed up for every single year you own it.
- Cash-Out Refinance Proceeds: If you refinance and pull equity out of the property, that’s a tax-free distribution and a major part of your total return.
- Net Sale Proceeds: This is what's left after you sell the property, pay off the remaining mortgage, and cover all selling costs like agent commissions and taxes.
By keeping a close eye on both the cash you put in and the cash you get back, you’re ready to calculate an equity multiple that gives you a true, unvarnished look at how your investment is performing.
A Practical Walkthrough of Calculating Equity Multiple
Theory is one thing, but running the numbers on a real deal is where it all starts to click. Let’s walk through two common scenarios to show you exactly how the equity multiple calculation works in practice. We'll start with a simple all-cash purchase and then move to a more realistic leveraged deal using a mortgage.
Before we dive in, this visual lays out the typical lifecycle of a real estate investment, highlighting the key moments where money moves in or out.
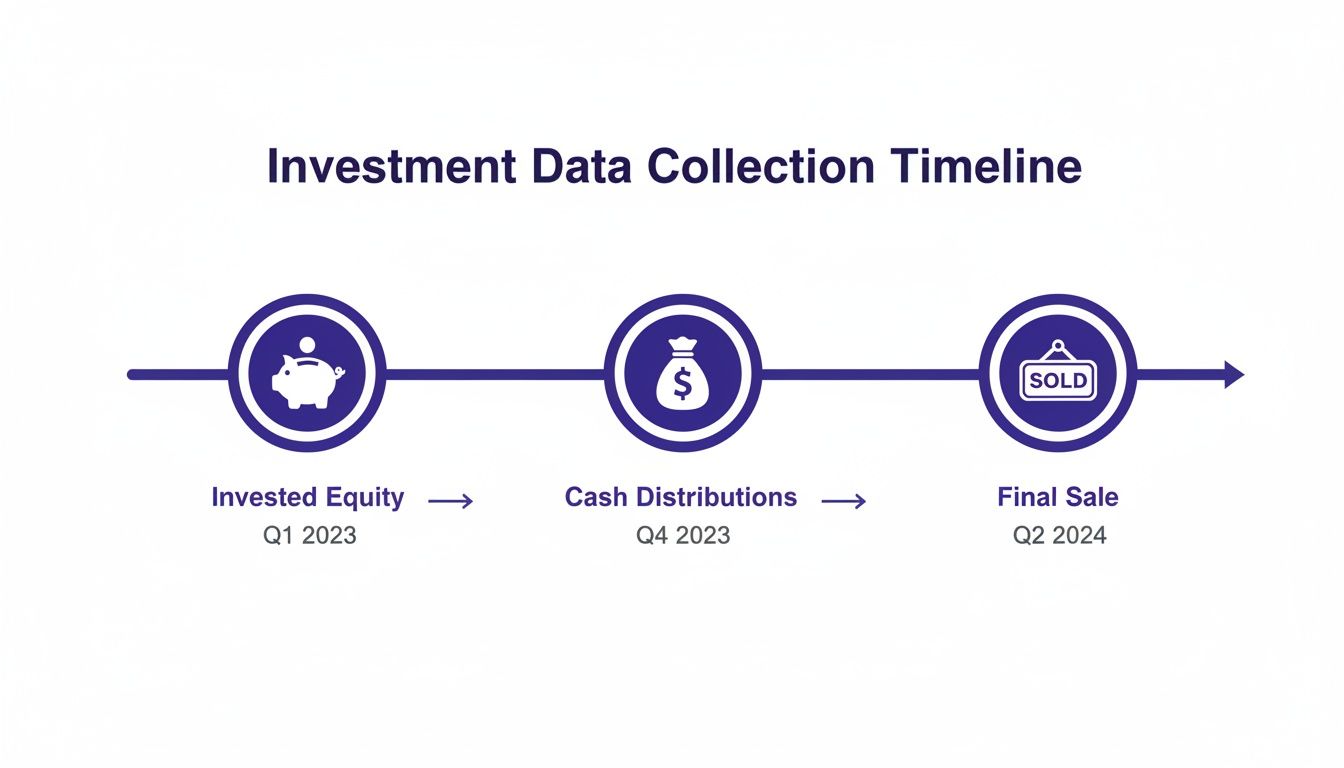
As you can see, the journey starts with your initial equity, continues with cash distributions during the hold period, and ends with the final payout from the sale. All three are essential for our calculation.
Scenario 1: The All-Cash Purchase
Let's say you buy a small commercial property outright for $500,000 in cash. After factoring in $20,000 for closing costs, your Total Equity Invested comes to $520,000.
Over the next five years, the property performs well, generating consistent net cash flow after you've paid all the bills.
- Year 1: $30,000
- Year 2: $32,000
- Year 3: $34,000
- Year 4: $36,000
- Year 5: $38,000
At the end of year five, you decide to sell for $650,000. After paying $40,000 in commissions and closing costs, your net proceeds from the sale are $610,000.
To get your Total Cash Distributions, you just add up all the cash you received: the annual cash flows plus the final proceeds from the sale.
($30,000 + $32,000 + $34,000 + $36,000 + $38,000) + $610,000 = $780,000
Now, we can plug these two main figures into our formula.
Equity Multiple = $780,000 / $520,000 = 1.5x
A 1.5x equity multiple means that for every dollar you put into the deal, you got that dollar back plus an extra $0.50 in profit. Simple as that.
Scenario 2: The Leveraged Purchase
This is where things get interesting. Using a mortgage, or leverage, dramatically changes the numbers because your initial cash outlay is much smaller. Let's use the same $500,000 property, but this time with financing.
You put down 25% ($125,000) and still cover the $20,000 in closing costs. Your Total Equity Invested is now only $145,000. A bank loan covers the remaining $375,000.
Of course, that loan comes with a mortgage payment of $22,000 per year (principal and interest), which eats into your annual cash flow.
- Year 1: $30,000 - $22,000 = $8,000
- Year 2: $32,000 - $22,000 = $10,000
- Year 3: $34,000 - $22,000 = $12,000
- Year 4: $36,000 - $22,000 = $14,000
- Year 5: $38,000 - $22,000 = $16,000
After five years, you sell for the same $650,000. You still pay $40,000 in selling costs, but now you also have to pay off the remaining mortgage balance, which has been paid down to $340,000.
This leaves you with net sale proceeds of: $650,000 - $40,000 - $340,000 = $270,000.
So, what are your Total Cash Distributions in this scenario?
($8,000 + $10,000 + $12,000 + $14,000 + $16,000) + $270,000 = $330,000
Finally, let's run the equity multiple calculation for the leveraged deal.
Equity Multiple = $330,000 / $145,000 = 2.28x
Look at that difference. Even though the total profit was less, the return on your actual cash invested was significantly higher—all thanks to leverage. As you can see, the basic logic of dividing total cash distributions by your initial equity is a powerful tool used by commercial investors, as you'll often see in any standard real estate glossary.
For another quick example, imagine an investor puts $4 million down, gets $300,000 in cash flow each year for five years ($1.5 million total), and sells for a net of $4 million. Their total distributions would be $5.5 million, giving them a 1.375x equity multiple.
The Formula in Your Spreadsheet
For anyone who lives in Excel or Google Sheets, the formula couldn't be easier. Just set up your model so you have a final tally for your total equity invested and your total distributions.
If your total equity is in cell B1 and your total distributions are in B2, the formula is:
=B2/B1
That’s all it takes. This simple function is the key to calculating equity multiple and getting a clear picture of an investment's long-term profit potential.
What a Good Equity Multiple Actually Looks Like
You’ve run the numbers and have an equity multiple staring back at you. Now what? What does that figure actually tell you about the deal?
On the surface, it’s pretty straightforward. A 1.0x multiple means you broke even—you got back every dollar you put in, but not a penny more. Anything below 1.0x is a loss, and anything above 1.0x is a profit. If you end up with a 1.8x equity multiple, for example, you made back your initial investment plus an extra 80%.
But that simple interpretation doesn't give you the full picture.
A "Good" Multiple Depends Entirely on Your Strategy
In the real world, there’s no universal "good" equity multiple. The right target is completely tied to your investment strategy, how much risk you're willing to stomach, and how long you plan to hold the property. Context is king.
For a lower-risk, stable asset you plan to hold for a decade, a 1.5x multiple might be a fantastic result. But for a risky value-add project with a tight three-year timeline? You'd need a much higher target to make the headache and uncertainty worthwhile.
On those riskier deals, most experienced investors I know are targeting a multiple of 2.0x or higher. That higher number is the reward for taking on the risk of a major renovation, turning around a mismanaged property, and ultimately forcing appreciation.
The key takeaway here is simple: your equity multiple target must be balanced against the risk. A 2.0x goal for a gut renovation makes perfect sense. You wouldn't expect—or need—the same return for a turnkey rental that's already cash-flowing.
How You Can Drive a Higher Multiple with Smart Operations
The clearest path to a better equity multiple is by boosting the property's financial performance. Every single dollar you can add to the net operating income (NOI) through savvy management will directly fatten your wallet at the sale.
Let's imagine you're tackling a value-add apartment building. Your game plan might include a few key moves:
- Fill the Vacancies: Getting occupancy up is the fastest way to increase rental income.
- Push the Rents: Once you've renovated units or added new amenities, you can justify charging what the market will truly bear.
- Cut Down on Waste: Small operational tweaks, like installing LED lighting or low-flow toilets, can meaningfully reduce your operating expenses.
Each of these improvements flows directly to your bottom line, which in turn leads to a higher valuation and sale price—the two main ingredients of your total profit. This is exactly how the pros generate exceptional returns. For instance, the firm REEP Equity has managed an average investor return of a 2.04x equity multiple by mastering these strategies. On one deal, they took a property from a dismal 36% occupancy all the way up to 92%. It just goes to show how operational skill directly fuels investor returns.
At the end of the day, a "good" equity multiple is one that properly rewards you for the risk, capital, and time you've poured into a deal. If you want to dive deeper into annual performance metrics, check out our guide on what makes a good cash-on-cash return.
Using Equity Multiple Alongside IRR and Cash-on-Cash Return
While the equity multiple is a fantastic tool for gauging total profitability, it doesn't tell the whole story. It has one major blind spot: time.
A 2.0x multiple achieved in three years is a wildly different—and much better—outcome than a 2.0x multiple that took ten years to realize. The equity multiple on its own just can't make that distinction.
This is precisely why experienced investors never rely on a single metric. To properly vet a deal, you need to look at it from multiple angles. The equity multiple gives you the big-picture profit, but two other key metrics—the Internal Rate of Return (IRR) and Cash-on-Cash Return—add crucial context around time and annual performance.
The Role of Internal Rate of Return (IRR)
Think of IRR as the metric that answers the "how fast?" question. It calculates the annualized, time-weighted rate of return on an investment. In short, it tells you the average yearly return your invested capital is generating, factoring in precisely when you receive each cash distribution.
A high IRR means you're getting your money back faster, which is a huge deal for investors who want to recycle their capital into new opportunities. For instance, an investment with a 2.0x equity multiple and a 25% IRR is far more attractive than another with the same 2.0x multiple but only a 12% IRR.
You can get a deeper understanding of this by playing with a real estate IRR calculator to see just how much the timing of cash flows can impact your returns.
Where Cash-on-Cash Return Fits In
If IRR measures the annualized return over the entire project, Cash-on-Cash (CoC) Return gives you a yearly snapshot of performance. It’s a straightforward calculation: the annual pre-tax cash flow divided by the total cash you invested. It’s a simple but powerful way to assess a property’s immediate, in-the-moment performance.
The catch with Cash-on-Cash is its narrow focus on the present. It tells you nothing about future appreciation or the final profit you’ll pocket at sale—which is exactly where the equity multiple shines.
A Balanced View: Equity Multiple vs. IRR vs. Cash-on-Cash Return
No single metric is perfect, but together, they paint a comprehensive picture of an investment's potential. Each one answers a different, critical question about the deal.
Here’s a quick breakdown of how they complement one another:
| Metric | What It Measures | Primary Benefit | Key Limitation |
|---|---|---|---|
| Equity Multiple | Total return on invested capital over the entire hold period. | Shows the absolute profit multiple. | Ignores the time value of money. |
| IRR | Annualized rate of return, considering the timing of cash flows. | Accounts for "how fast" you make money. | Can be misleading on its own without profit context. |
| Cash-on-Cash Return | Annual cash income relative to the total cash invested. | Provides a snapshot of yearly performance. | Overlooks appreciation and total lifetime return. |
By using these three metrics in concert, you get a much richer, more complete view of a potential investment. You can see the total profit potential (Equity Multiple), the speed and efficiency of that return (IRR), and the year-to-year cash flow performance (CoC Return).
For another perspective on valuation, it's also worth understanding the fundamentals of the Cap Rate Formula. Combining these tools will give you a powerful toolkit for making smarter, more confident investment decisions.
Common Questions About the Equity Multiple
As you start working the equity multiple into your own deal analysis, a few questions are bound to pop up. It’s a straightforward metric on the surface, but the real world always adds a few wrinkles. Let's tackle some of the most common points of confusion I see from investors.
One of the first things people ask is how it applies to different holding periods. The equity multiple really shines on long-term holds—think deals you plan to keep for seven to ten years or more. Why? Because it neatly captures the entire investment story, from years of steady cash flow to the big payout when you finally sell. Other metrics, like IRR, can sometimes get skewed by a quick flip, but the multiple gives you an unfiltered look at the total wealth generated over the full lifecycle.
How Does Equity Multiple Work with BRRRR?
The BRRRR method (Buy, Rehab, Rent, Refinance, Repeat) is a powerhouse for building a portfolio, but it definitely throws a curveball at the equity multiple calculation. The trick is to anchor yourself to the core formula: total cash you get back divided by the total cash you put in.
When you execute a cash-out refinance—the second "R" in BRRRR—two key things happen to your numbers:
- You get a big cash distribution. That check from the bank goes straight into the numerator (total cash distributions).
- Your invested equity can plummet. If the refi is successful, you might pull out all your initial capital, bringing your net invested equity down to zero or close to it.
This is actually where the metric proves its value. Let's say your successful refinance puts your entire initial investment of $50,000 back in your pocket. At that very moment, your equity multiple hits 1.0x. From that point on, every dollar of cash flow and any future profit from a sale sends your multiple soaring towards infinity, because you have zero of your own money left in the deal. It’s a perfect illustration of recycling your capital.
Should You Ever Ignore a High Multiple?
Almost never. But you should never look at it in a vacuum. A projected 3.0x multiple looks incredible on paper, but what if it takes 15 years to get there? That works out to a pretty sluggish annualized return (IRR). Your money could probably work a lot harder for you in other deals.
A high equity multiple tells you what you'll make; the IRR tells you how fast you'll make it. A great deal delivers on both.
Context is everything. A deal that delivers a 2.0x multiple in just three years is often a much better choice than one that promises a 2.5x multiple over a decade. The shorter timeline means you get your capital and profits back sooner, ready to be redeployed into the next deal. That's how you truly compound your wealth. The sharpest investors always weigh the total return (equity multiple) against the velocity of that return (IRR).
Stop drowning in spreadsheets and start making smarter, faster investment decisions. With Property Scout 360, you can analyze any U.S. property in seconds, getting instant calculations for equity multiple, IRR, cash-on-cash return, and more. Find your next profitable rental today by visiting https://propertyscout360.com.
About the Author
Related Articles
2026 Investor's Guide: Cost of Installing a Sewer Clean Out
Understand the cost of installing a sewer clean out for investment properties in 2026. Get expert advice on prices, ROI, & budgeting for flips. Plan smart!
15 Year vs 30 Year Mortgage: The Investor's Choice
Deciding between a 15 year vs 30 year mortgage for a rental property? Our guide analyzes cash flow, ROI, and equity to help you pick the best loan.
Real Estate Appraisal Software: Features & Limits
Discover what real estate appraisal software is, its core features, and limits. See how it differs from investment tools for profitable deals.