How to Calculate Break Even Point for Your Rental Property
Learn how to calculate break even point for any rental property. Our guide uses real-world examples and simple formulas to help you invest with confidence.
Knowing the break-even point for a rental property is the absolute cornerstone of a smart investment. It’s the line in the sand between an asset that pads your bank account and a liability that drains it. At its heart, the calculation is simple: figure out the exact point where your total rental income covers every single one of your expenses.
The core formula you’ll hear tossed around is Break-Even Rent = Total Fixed Costs + Total Variable Costs. This tells you the bare minimum rent you need to charge each month just to avoid losing money.
Your Guide to Rental Property Profitability

Before you ever sign on the dotted line, calculating this number is arguably the most important piece of due diligence you can perform. This isn't about guesswork; it's about pinpointing the exact moment your investment starts working for you and generating a real profit.
This guide will give you a clear, actionable way to find that magic number. We'll dig into how to track down every cost—both the obvious and the hidden—and then apply practical formulas for break-even rent, occupancy, and even a future sale price. The goal here is to give you the confidence to make sharp, data-driven decisions that build a truly profitable portfolio.
The Foundation of Smart Investing
Think of the break-even framework as the financial bedrock of your investment. It’s the point where your total income from rent perfectly matches your total costs, covering everything from the mortgage payment and insurance to the occasional leaky faucet. You'd be surprised how many new investors skip this step, only to find themselves in a negative cash flow situation they never saw coming.
The break-even point isn't just a number; it's your investment's baseline for survival. Any income above this point is profit, while falling short means you're paying to own the property.
Once you’ve mastered this, you can start looking at more advanced metrics. For instance, understanding how to calculate free cash flow yield is a great next step to truly gauge the earnings power of your property.
To get started, let's break down the essential inputs you'll need for your analysis.
Core Components of a Break-Even Analysis
Getting this calculation right hinges on accurately identifying every cost involved. I've seen investors get into trouble by focusing only on the mortgage and underestimating everything else. The table below summarizes the key financial inputs you absolutely need to track.
| Component | Description | Examples |
|---|---|---|
| Fixed Costs | Expenses that remain consistent every month, regardless of whether the property is occupied. | Mortgage (P&I), Property Taxes, Insurance, HOA Fees |
| Variable Costs | Expenses that can change based on occupancy, usage, or unexpected issues. | Maintenance & Repairs, Utilities, Property Management Fees |
| Rental Income | The total revenue generated from rent payments. | Gross Monthly Rent |
With these components clearly defined, you have the raw data needed to run the numbers and find that crucial financial tipping point for your property. We'll start by putting them into the key formulas.
Getting a Handle on Every Single Property Cost
To figure out the real break-even point for your rental, you need to be brutally honest about every single dollar going out the door. It's so easy to overlook a small expense here or there, but those little things add up and can completely wreck your analysis. You might think you're in the black when you're actually bleeding cash every month.
The best way to start is by splitting your expenses into two distinct categories: fixed costs and variable costs.
Think of fixed costs as the financial heartbeat of your property. They're the predictable, non-negotiable bills that show up every month like clockwork, whether you have a tenant or not.
Variable costs are a different beast. They ebb and flow with occupancy, usage, and the occasional surprise. This is where seasoned pros separate themselves from the rookies—by getting good at forecasting the unexpected.
Pinpointing Your Fixed Costs
These are usually the easiest to track down since they appear on your bank and mortgage statements consistently. For most investors, the core fixed costs are going to be:
- Mortgage Payment: The total amount you pay for principal and interest (P&I).
- Property Taxes: You'll likely pay this annually or semi-annually, but you absolutely have to break it down into a monthly budget item.
- Homeowners Insurance: This is your specific landlord or hazard insurance policy.
- HOA Fees: A mandatory expense if your property is part of a homeowners association.
- PMI or Mortgage Insurance: If you put down less than 20%, this is another fixed monthly hit to your bottom line.
Add all of these up, and you've got your total monthly fixed expenses. This is the bare minimum you need to cover just to hang onto the property.
Estimating Your Variable Costs
This is where the real work—and the real insight—happens. Variable costs are much harder to predict, but they are just as important for a true break-even calculation. You'll have to make some educated guesses based on the property's age, condition, and what's normal for your market.
I can't tell you how many new investors I've seen focus only on the mortgage, completely forgetting the "invisible" costs of ownership. Budgeting for a new water heater or a month of vacancy is what keeps you from having your entire year's profit wiped out in an instant.
Here are the big variable costs you must account for:
- Maintenance and Repairs: A solid rule of thumb is to set aside 1-2% of the property’s value each year. For a $300,000 house, that means you should be putting away $250-$500 every single month.
- Vacancy: Let's be real: no property stays occupied 100% of the time. A conservative and safe bet is to assume you'll lose 5-8% of your potential annual rent to vacancy.
- Capital Expenditures (CapEx): These are the big-ticket items—the new roof, the HVAC system that dies unexpectedly. Saving about 5% of the monthly rent in a separate fund for these is a smart move.
- Property Management Fees: If you're not self-managing, expect to pay a pro anywhere from 8-12% of the rent they collect for you.
- Utilities: Even if your tenants cover most bills, you might still be on the hook for water, trash, or electricity in common areas.
By digging in and tracking both your fixed and variable costs, you're building the solid financial foundation you need for an accurate analysis. If you need a good system for this, our guide on creating a rental income and expenses spreadsheet is a great place to start. It will help make sure no expense ever falls through the cracks.
Applying the Essential Break-Even Formulas
Once you've sorted out your fixed and variable costs, it's time to put those numbers to work. This is the fun part, where we move from basic accounting to real strategic analysis. We’ll use a few core formulas that unlock critical insights into your property's financial health. Believe me, these aren't just textbook exercises; these are the exact calculations savvy investors run every day to weigh risks and spot opportunities.
The first move is always to categorize your expenses. You need a clear line between the consistent, predictable costs and the ones that ebb and flow with tenants and time. This visual breaks it down nicely.
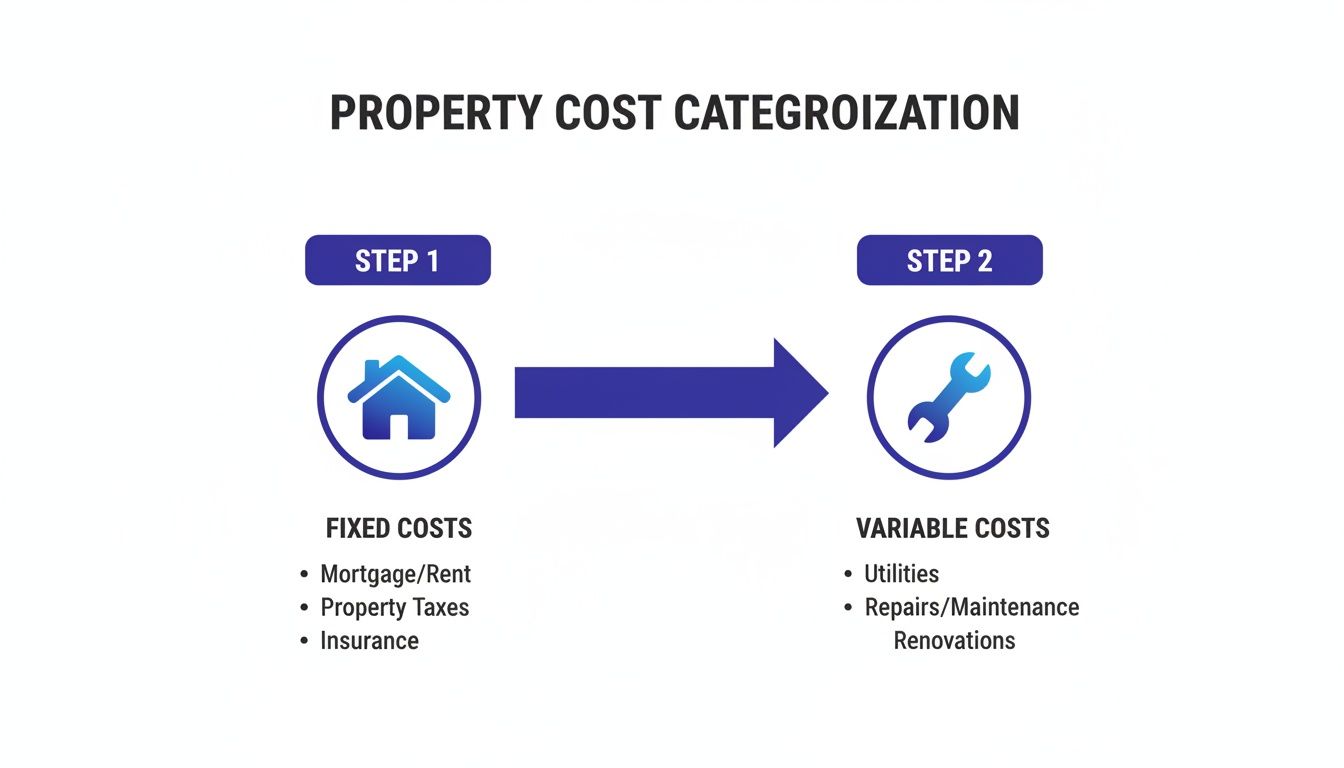
As you can see, the non-negotiables like your mortgage are separate from fluctuating expenses like repairs. Getting this right is the bedrock of an accurate break-even analysis.
Calculating Your Break-Even Rent
Your first and most crucial calculation is the Break-Even Rent. Think of this as your property's "zero line." It's the absolute minimum you have to charge each month just to cover every single expense. Any rent you collect above this number is pure profit. Anything below it is a loss you're funding out of your own pocket.
The formula is beautifully simple: Monthly Break-Even Rent = (Total Monthly Fixed Costs + Total Monthly Variable Costs)
Let's run a quick example. Say your total fixed costs (mortgage, taxes, insurance) come to $1,800 a month. You also budget $400 a month for variable costs like maintenance and a vacancy fund. The math looks like this:
$1,800 (Fixed) + $400 (Variable) = $2,200
Your Break-Even Rent is $2,200. This immediately tells you that charging anything less will put you in the red. For a deeper look at managing your income and expenses, you might want to check out our complete guide on rental property cash flow analysis.
Determining Your Break-Even Occupancy Rate
Next up is the Break-Even Occupancy Rate. This metric shows you what percentage of the year your property needs a paying tenant just to cover its annual costs. It's a fantastic way to understand your real-world exposure to vacancy risk.
Here’s the formula we use: Break-Even Occupancy Rate = (Total Annual Costs ÷ Gross Potential Annual Rent) x 100
Sticking with our example, your total annual costs are $26,400 ($2,200 x 12). Let's assume the going market rent for your property is $2,500 per month, giving you a gross potential annual rent of $30,000.
($26,400 ÷ $30,000) x 100 = 88%
What does this mean? It means your property has to be rented out for 88% of the year—that’s roughly 10.5 months—just to break even. This is a crucial piece of information when you're sizing up a deal. Can the local market truly support such a high occupancy rate?
Knowing your break-even occupancy gives you a clear risk threshold. If typical vacancy rates in your area are higher than what you need to break even, that property might be a much riskier investment than it first appears.
Finding the Break-Even Sale Price
Finally, let's talk about an exit strategy with the Break-Even Sale Price. This calculation determines the minimum price you'd need to sell for to get back your initial investment and every dollar you spent along the way.
The basic formula is a bit of a mouthful, but it's straightforward: Break-Even Sale Price = Purchase Price + All Closing Costs + Holding Costs + Major Improvements - Total Rent Collected
This calculation is especially important in a market like the U.S., where property values have historically appreciated around 3-5% annually. Grounding your projections with a solid break-even number ensures your financial planning is based on reality, not just wishful thinking.
To give you a clearer picture of how these formulas work together, here’s a quick worked example.
Worked Example for a Single-Family Rental
Let’s apply these formulas to a realistic scenario. Imagine you're analyzing a single-family home. After doing your homework, you've gathered all the necessary figures. This table breaks down how to calculate each key metric step-by-step.
| Metric | Calculation/Formula | Result |
|---|---|---|
| Total Monthly Costs | $1,800 (Fixed) + $400 (Variable) | $2,200 |
| Break-Even Rent | Total Monthly Costs | $2,200 |
| Annual Costs | $2,200 (Monthly Costs) x 12 | $26,400 |
| Gross Potential Rent | $2,500 (Market Rent) x 12 | $30,000 |
| Break-Even Occupancy | ($26,400 ÷ $30,000) x 100 | 88% |
Seeing the numbers laid out like this really drives home the relationship between costs, rent, and occupancy. An 88% break-even occupancy rate is a tight margin, highlighting just how critical it is to minimize vacancies to ensure profitability. These three formulas—for rent, occupancy, and sale price—give you a complete financial picture, turning abstract numbers into the actionable intelligence you need to succeed.
How to Stress-Test Your Investment Scenarios
A single break-even calculation is a good start, but it's just a snapshot. The real world of real estate is messy and unpredictable. Interest rates move, local governments reassess property taxes, and your perfect tenant might take a new job across the country.
To build a truly resilient rental portfolio, you have to look beyond a single, perfect-world calculation. You need to start stress-testing your assumptions by asking "what if?"
This is what experienced investors call sensitivity analysis. It's the critical step that separates the pros from the amateurs, letting you uncover a property's real risk profile before you put a single dollar down. You’re essentially trying to find the breaking point—how much pressure can this deal take before it starts costing you money?
Modeling Market and Financing Shifts
The best way to start is by asking specific, tough questions and running the numbers. What happens to my monthly bottom line if mortgage rates jump a full percentage point before I close? How does a 10% property tax hike torpedo my break-even rent?
Here are the variables I always poke at when analyzing a deal:
- Interest Rate Changes: Don't just use today's rate. Model what happens if it climbs by 0.5%, 1%, and even 1.5%.
- Vacancy Rate Spikes: That optimistic 5% vacancy rate is nice, but what happens if the market softens and you're looking at 10% or 15%?
- Rent Projections: What if you misjudged the market and can only get $100 less per month than you planned?
- Unexpected Repairs: How does a surprise $5,000 roof repair in year one blow up your annual projections?
This isn’t just academic. Break-even analysis has evolved from a simple formula into full-blown scenario modeling. In fact, industry data shows that investors who run these kinds of projections over 15-30 year horizons have 34% higher portfolio success rates. It just makes sense—you're preparing for reality, not just the best-case scenario.
A great investment doesn't just look good on paper today; it looks good even when your worst-case assumptions come true. Stress-testing reveals the true margin of safety in your deal.
Using Tools for Deeper Analysis
Look, running dozens of these scenarios by hand in a spreadsheet is a massive headache and a recipe for mistakes. To do this right, I highly recommend using a dedicated vacation rental investment calculator to forecast profits and stress-test your numbers.
Modern platforms like Property Scout 360 are built for exactly this. You can tweak variables—down payment, loan type, rent estimates—and instantly see how it changes everything.
A tool like this immediately recalculates your cash flow, ROI, and break-even point as you play with different financing options. It turns a ridiculously time-consuming task into a quick, interactive process. This is how you build a strategy that can actually handle the volatility of the real world and protect your investment.
Moving Beyond Spreadsheets with Modern Tools

Look, knowing the formulas for a break-even analysis is non-negotiable. But let’s be honest—manually plugging numbers into a spreadsheet for every single property you look at is a soul-crushing grind. It’s slow, it’s tedious, and frankly, it's risky.
A single typo in a formula or an old property tax figure can completely derail your projections. That’s how you end up with a "great deal" that bleeds cash every month. This is where leaning on the right technology can make all the difference.
Automating Your Analysis for Speed and Accuracy
Instead of spending half your day hunting for local tax rates or calling around for insurance quotes, specialized platforms can do the heavy lifting for you. Tools like Property Scout 360 are designed to calculate the break-even point for any U.S. property in seconds.
How? By pulling real-time data from hundreds of sources, these systems give you a complete financial picture almost instantly. This means your analysis is built on a foundation of current, accurate market data, not hopeful guesses.
For instance, a good platform will automatically factor in:
- Localized Property Taxes: Pulled for the specific county and city the property is in.
- Realistic Insurance Estimates: Based on regional averages for similar homes.
- Current Market Rents: Using fresh comps from the local MLS.
- Accurate Mortgage Payments: Calculated with today's interest rates.
This shift is huge. You move from the world of educated guesses and tedious data entry to a place of data-backed confidence. Your time is freed up for what really matters: making the right strategic decisions.
Automation is a serious competitive advantage. If you want to see what a top-tier platform looks like, it's worth checking out the features of the best real estate investment software on the market today.
Running Scenarios in Minutes, Not Weeks
This is where these tools really shine. What if you put down 25% instead of 20%? How does a 30-year fixed loan compare to an ARM?
With just a few clicks, you can model dozens of different scenarios and see the immediate impact on your cash flow, break-even rent, and long-term ROI. No more "Save As" for twenty different spreadsheet versions.
This detailed report from Property Scout 360 shows a complete breakdown of income, expenses, and key profitability metrics.
Notice how the cash-on-cash return, cap rate, and projected annual return are laid out clearly. You get a comprehensive financial snapshot that allows you to make a quick, informed decision. This ability to rapidly test your assumptions turns a static report into a dynamic planning tool that helps you find the truly profitable deals.
Frequently Asked Questions About Break-Even Analysis
Even after you've got the formulas down, the real world of investing always throws a curveball. When you're trying to nail down the break-even point for a property, the little details can make a huge difference. Let's tackle some of the most common questions I hear from other investors to help you analyze your next deal with more confidence.
What Are the Most Commonly Forgotten Costs in a Break-Even Calculation?
This is a big one. New investors often get tripped up because they overlook a few key expenses that can completely wreck a break-even analysis. The biggest culprits are usually the "invisible" costs—the ones that don't pop up on a monthly statement but will absolutely sink your profitability if you ignore them.
Here are the expenses people miss most often:
- Vacancy Reserves: You have to assume the property won't be occupied 100% of the time. Stuff happens. To be safe, I always set aside 5-10% of the gross monthly rent to cover those empty months.
- Capital Expenditures (CapEx): Think of this as your savings account for the big-ticket items. Sooner or later, you'll need a new roof, an HVAC system, or a water heater. Budgeting 5-10% of the rent for CapEx is just smart planning.
- Closing Costs: Don't forget how much it cost to buy the place! Those initial costs, often 2-5% of the purchase price, have to be baked into your total investment, especially when you're calculating your break-even sale price.
- Leasing Fees: If you use a real estate agent or property manager to find your tenants, they're going to take a cut. A typical fee is one month's rent, which can be a significant one-time hit.
Forgetting these numbers paints a dangerously rosy picture. Including them from day one gives you a forecast that’s actually grounded in reality.
How Does the Break-Even Point Differ for Short-Term vs. Long-Term Rentals?
The core math is the same, but the inputs change dramatically depending on your rental strategy.
With short-term rentals, like an Airbnb, your variable costs are way higher. You're constantly paying for cleaning, restocking supplies (coffee, soap, etc.), higher utility bills, and those pesky platform service fees. Because of this, the break-even occupancy rate becomes your north star metric, and you need to watch it on a nightly or weekly basis.
For traditional long-term rentals with annual leases, the variable costs are much lower and more predictable. This makes the monthly break-even rent the number you'll focus on the most.
For a short-term rental, a high break-even occupancy means a slow off-season could wipe out an entire year's profit. For a long-term rental, a high break-even rent makes it nearly impossible to compete with other landlords in your area.
Should I Include Principal Payments in My Break-Even Calculation?
Yes. For a practical, real-world cash flow analysis, you absolutely should.
I know what the accountants will say: the principal portion of your mortgage payment isn't technically an "expense" because it's building your equity. While that's true on paper, it is a very real cash outflow that has to be paid every single month. If your rent can't cover the full PITI (Principal, Interest, Taxes, and Insurance), you are cash-flow negative and will be dipping into your own pocket to keep the property afloat.
For actual investing, always include the principal. You need to know if the property can support itself.
At What Point Should I Walk Away from a Potential Deal?
It’s time to walk away when the numbers just don't make sense, no matter how much you want the deal to work.
A huge red flag is a calculated break-even rent that's way above what similar properties are getting. If you discover you'd have to charge 15-20% more than the competition just to cover your costs, you're setting yourself up for a constant battle to find and keep tenants.
Also, keep a close eye on that break-even occupancy rate. If your analysis shows it creeping above 90-95%, the deal has virtually no margin for error. A single unexpected vacancy or one major repair could instantly push you into the red for the year. Sometimes the best deal is the one you don't do.
Ready to stop messing with spreadsheets and start analyzing deals with serious speed and accuracy? Property Scout 360 provides instant break-even analysis, cash flow projections, and ROI metrics for any property in the U.S. You can try it for free and see for yourself.
About the Author
Related Articles
2026 Investor's Guide: Cost of Installing a Sewer Clean Out
Understand the cost of installing a sewer clean out for investment properties in 2026. Get expert advice on prices, ROI, & budgeting for flips. Plan smart!
15 Year vs 30 Year Mortgage: The Investor's Choice
Deciding between a 15 year vs 30 year mortgage for a rental property? Our guide analyzes cash flow, ROI, and equity to help you pick the best loan.
Real Estate Appraisal Software: Features & Limits
Discover what real estate appraisal software is, its core features, and limits. See how it differs from investment tools for profitable deals.