Understanding Net Operating Income Cap Rate in Real Estate
A practical guide to using the net operating income cap rate. Learn how to calculate NOI and analyze property profitability with real-world examples.
Think of a rental property as a small business. Its Net Operating Income (NOI) is the annual profit it generates before you account for your mortgage or income taxes. The Capitalization Rate (Cap Rate), on the other hand, tells you the rate of return you'd get if you bought that business—the property—with all cash.
These two metrics are the foundational language of real estate investing. Get them right, and you're well on your way.
Unlocking Property Value with NOI and Cap Rate
When you start analyzing investment properties, two terms will come up again and again: Net Operating Income (NOI) and Capitalization Rate (Cap Rate). They are absolutely critical. Together, they tell a powerful story about a property’s financial health and its true value in the current market.
Mastering this relationship is the first real step toward making smart, data-driven investment decisions.
What Is Net Operating Income (NOI)?
NOI gets right to the heart of a property's performance. It measures how much profit a property produces from its day-to-day operations—things like rent collection and laundry income, minus essential costs like maintenance, insurance, and property taxes. To get a good handle on this, it helps to know how to read a Profit and Loss statement, since that's where these numbers live.
Simply put, NOI is all the money a property brings in, minus all the necessary expenses to keep it running. It’s the pure, unadulterated profit of the asset itself.
What Is a Capitalization Rate (Cap Rate)?
The Cap Rate takes that profit figure and puts it into perspective. It’s a quick way to gauge the potential return on an investment property, shown as a simple percentage.
This is incredibly useful because it lets you compare different properties on an apples-to-apples basis, no matter how different their asking prices are. A $500,000 property in one city can be directly compared to a $1.2 million property in another, all thanks to the cap rate.
Key Takeaway: NOI is a dollar amount showing a property's raw profitability. The Cap Rate is a percentage showing the rate of return on that property, which helps you quickly assess both its risk and potential upside.
NOI vs Cap Rate At a Glance
To make this crystal clear, here’s a quick table breaking down the core differences between these two foundational metrics.
| Metric | What It Measures | Simple Formula | Key Takeaway |
|---|---|---|---|
| NOI | The property's annual profit from operations (before debt & taxes). | Gross Income - Operating Expenses | A pure measure of the asset's performance in dollars. |
| Cap Rate | The potential rate of return on an all-cash purchase. | NOI / Property Value | A percentage used to compare risk and return between properties. |
Think of it this way: NOI tells you what the property earns, while the Cap Rate tells you how hard your money is working to earn it.
The Core Relationship
The connection between NOI, Cap Rate, and a property's value is direct and powerful. If you know a property's NOI and what the typical Cap Rate is for similar properties in that market, you can quickly estimate what that property should be worth. It’s a reality check on the asking price.
Likewise, if you know the purchase price and the NOI, you can calculate the Cap Rate to see if the deal meets your investment goals. These three numbers—NOI, Cap Rate, and Value—are locked in a simple but crucial formula that drives nearly all investment analysis.
How to Calculate Net Operating Income Step by Step
Working out your property's Net Operating Income (NOI) isn't rocket science, but it does require a sharp eye for detail. The best way to think about it is like creating a simple profit and loss statement just for the property itself. The whole point is to see how the property performs financially on its own, before any financing or personal tax situations muddy the waters.
The journey to finding your NOI starts with adding up every single dollar the property could possibly bring in.
Step 1: Tally Your Gross Operating Income
First, you need to figure out your Gross Operating Income (GOI). This is the total of all potential income the property can generate. You'll start with the gross potential rent—what you'd collect if the property was 100% occupied all year—and then tack on any other money-makers.
Be sure to include all sources of income, like:
- Rental Income: The main event, of course.
- Parking Fees: Any charges for dedicated parking spots.
- Laundry Facilities: Money from coin-op or card-operated machines.
- Vending Machines: Revenue from any snack or soda machines on-site.
- Late Fees: Those extra charges collected when rent is overdue.
This simple flowchart shows how all these numbers eventually lead you from basic income to your actual return.
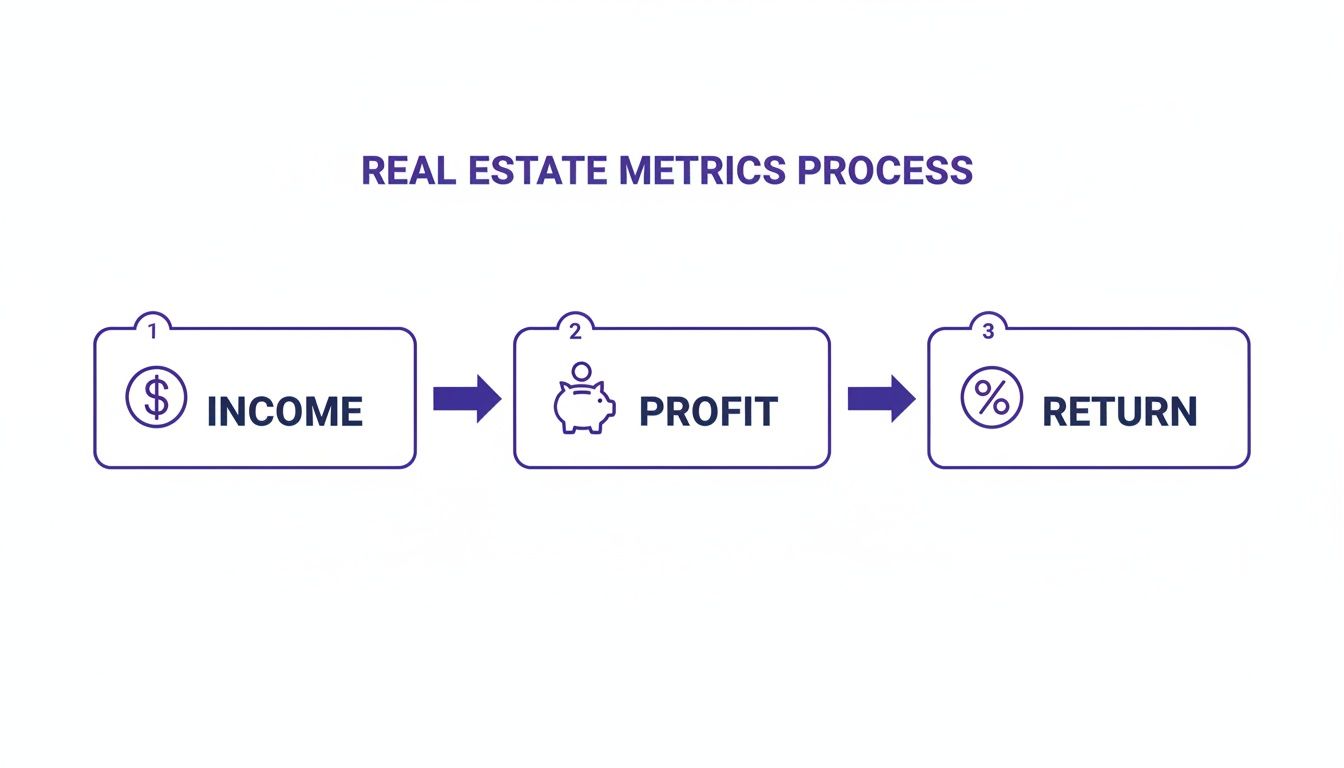
As you can see, the path is straightforward: track your income, calculate your profit (which is your NOI), and then use that to find your return (the cap rate).
Step 2: Subtract All Operating Expenses
Now for the other side of the ledger. You need to identify and subtract all Operating Expenses (OpEx). Think of these as all the necessary, recurring costs you have to pay just to keep the lights on and the property in good shape.
Common operating expenses to track are:
- Property Taxes
- Property Insurance
- Maintenance and Repairs
- Property Management Fees
- Utilities (if you, the owner, pay for them)
- Landscaping and Snow Removal
This next part is crucial. Operating expenses are only the day-to-day costs. You absolutely should not include your mortgage payments (both principal and interest), income taxes, depreciation, or major capital expenditures like putting on a new roof. Why? Because those costs are related to your financing and ownership structure, not the raw operational health of the property. For a deeper dive, check out our guide on how to perform a rental property cash flow analysis.
Step 3: Put It All Together with an Example
Let's walk through the math for a hypothetical duplex to see exactly how the formula works in the real world.
Duplex Example Calculation
Calculate Gross Operating Income (GOI):
- Unit A Rent: $1,500/month
- Unit B Rent: $1,500/month
- Gross Potential Rent: $3,000/month or $36,000/year
Calculate Total Operating Expenses (OpEx):
- Property Taxes: $4,000/year
- Insurance: $1,200/year
- Maintenance (budgeted at 5% of rent): $1,800/year
- Property Management (8% of rent): $2,880/year
- Vacancy (budgeted at 5% of rent): $1,800/year
- Total Annual OpEx: $11,680
Calculate Net Operating Income (NOI):
- NOI = GOI - OpEx
- NOI = $36,000 - $11,680
- NOI = $24,320
There you have it. The final number, $24,320, is this duplex's net operating income. This is the pure profit figure you'll use to calculate your net operating income cap rate, which we'll get into next.
Connecting NOI to Your Cap Rate Calculation
Once you've nailed down your Net Operating Income, you're ready to calculate one of the most useful metrics in real estate: the Capitalization Rate, or Cap Rate.
If your NOI is the investment's engine, the cap rate tells you how efficiently that engine performs relative to the property's price tag. It’s a powerful tool for quickly comparing one investment opportunity against another, apples to apples.
The formula itself is refreshingly straightforward. It connects a property's pure profitability directly to its market value, giving you a clear percentage of its potential annual return.
The Cap Rate Formula in Action
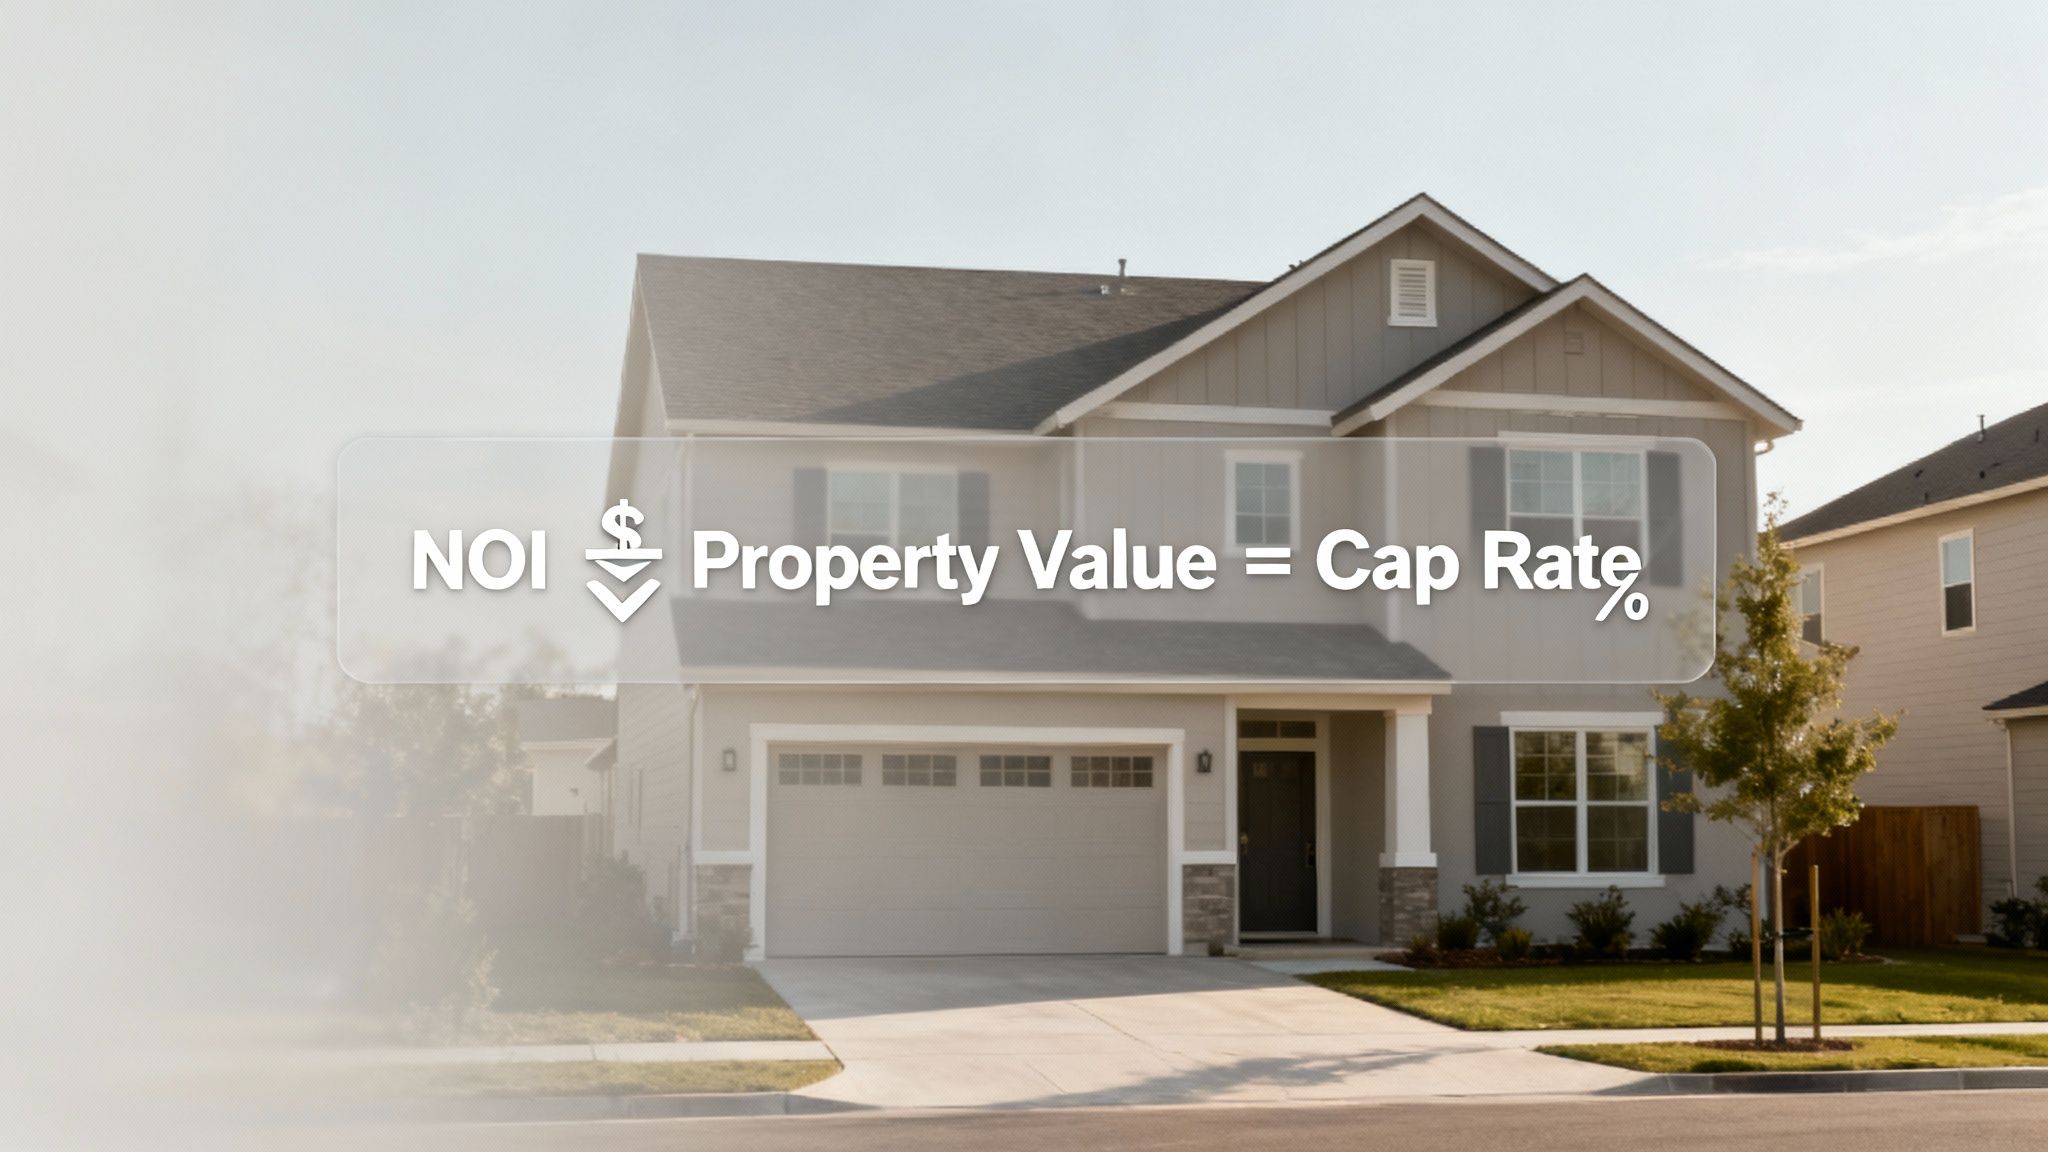
To get your cap rate, you just divide the annual Net Operating Income by the property's current market value or purchase price.
Cap Rate = Net Operating Income (NOI) / Property Value
Let's stick with our duplex example. We already figured out the annual NOI is $24,320. If you're buying that duplex for $400,000, the math looks like this:
- Cap Rate = $24,320 / $400,000
- Cap Rate = 0.0608, which is 6.08%
That 6.08% is the property's cap rate. What it really means is that if you bought the duplex with cash, you could expect an annual return of about 6.08% from its day-to-day operations alone. This is your pure return before factoring in loan payments or any potential appreciation.
You can streamline these kinds of calculations using our rental property spreadsheet analysis.
What Is a Good Cap Rate?
So, is 6.08% a good cap rate? The only honest answer is: it depends.
A "good" net operating income cap rate isn't some magic number. It's completely dependent on the market, the type of property, and what you’re trying to achieve as an investor. A great cap rate in Austin might be a terrible one in Cleveland.
- High-Growth Urban Centers: In hot markets like Miami or Austin, you'll often see lower cap rates, maybe in the 3-5% range. Investors there are willing to accept a smaller immediate cash return because they're banking on the property's value skyrocketing over time. A low cap rate often signals a high-demand, low-risk area.
- Stable Suburban Markets: In many established suburbs, cap rates tend to fall into a more moderate 5-7% range. These areas usually offer a healthy balance of reliable cash flow and a decent shot at appreciation, which is why they're a sweet spot for a lot of investors.
- Smaller, Cash-Flow Focused Markets: Head to smaller towns or certain Midwestern cities, and it's not unusual to find properties with cap rates of 8-10% or even higher. Appreciation might be slow or non-existent, so investors demand a bigger paycheck right now to compensate for what they see as higher risk.
Interpreting Cap Rates Across Different Markets
To put this in perspective, here’s a quick breakdown of how cap rates can vary by market type. This isn't a hard-and-fast rule, but it's a solid guide for understanding the "why" behind the numbers.
| Market Type | Typical Cap Rate Range | Primary Investor Goal | Associated Risk Level |
|---|---|---|---|
| Tier 1 (e.g., NYC, LA) | 3% - 5% | Appreciation | Lower |
| Tier 2 (e.g., Denver, Austin) | 5% - 7% | Balanced Growth & Cash Flow | Moderate |
| Tier 3 (e.g., Indianapolis, Memphis) | 7% - 10%+ | High Cash Flow | Higher |
This table helps illustrate the classic risk-reward trade-off in real estate. As you can see, a higher cap rate isn't automatically better—it’s just different. It points toward a strategy focused on immediate income over long-term value growth.
In the end, it all comes down to a simple trade-off: higher cap rates often suggest greater immediate cash flow but potentially more risk. Lower cap rates usually mean less risk and a bigger bet on long-term appreciation.
Common Mistakes That Can Wreck Your Analysis
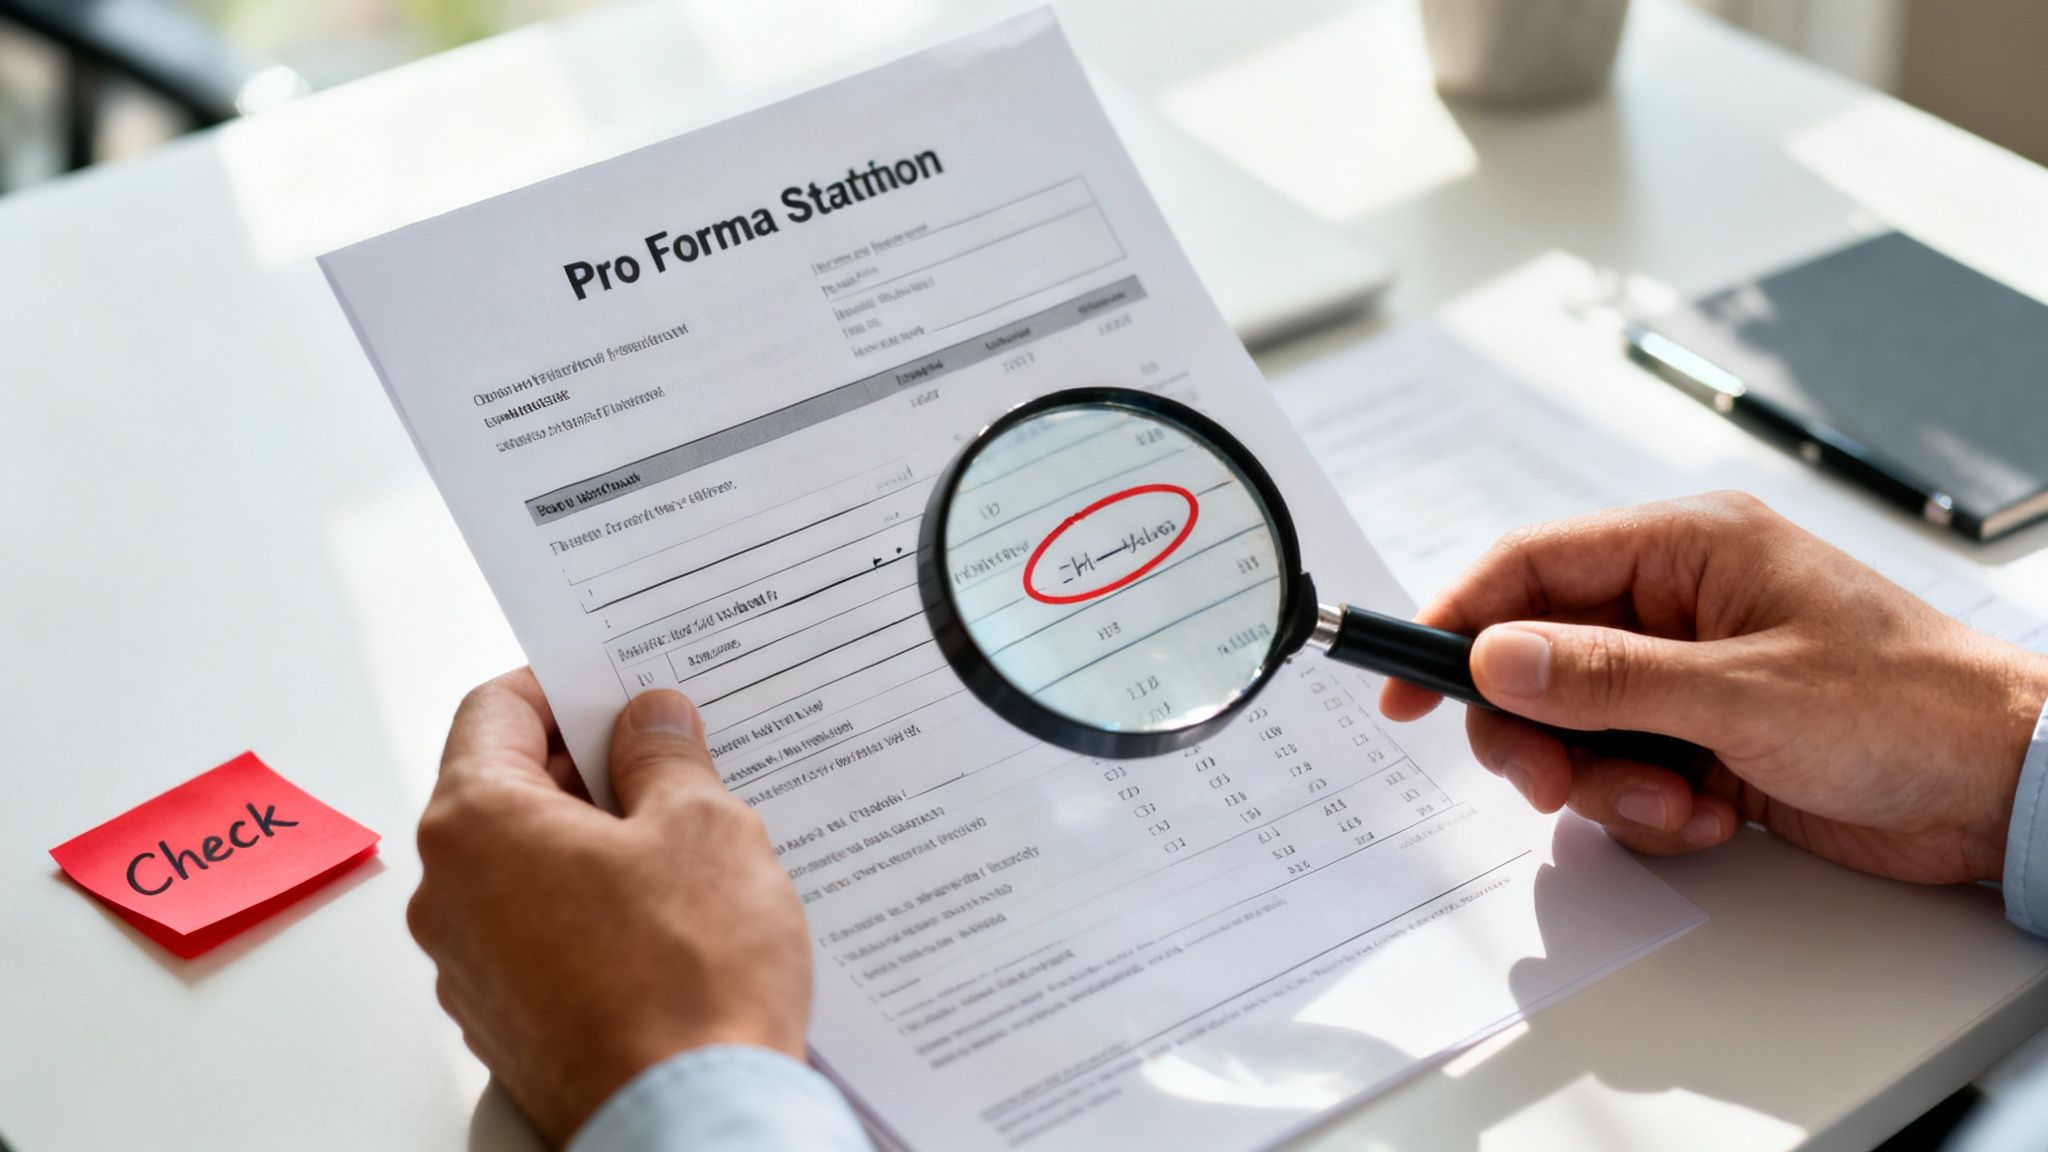
On the surface, calculating NOI and cap rate seems like simple math. But the numbers a seller gives you? That's not math—it's marketing. A seasoned investor knows the real work starts after you get the seller's pro forma statement.
It's a tale as old as time: sellers present a beautifully inflated Net Operating Income. They might conveniently "forget" a few nagging expenses or paint a rosy picture of 100% occupancy, 365 days a year. This makes the property's profitability look fantastic and results in a cap rate that's just too good to be true.
Putting the Seller's Numbers Under the Microscope
Think of yourself as a financial detective. The seller's pro forma isn't a certified financial document; it's a sales brochure. Your job is to verify every single number and build your own, more conservative analysis to uncover the actual NOI.
Here are the biggest red flags I always look for:
- Zero Vacancy Delusions: Sellers love to project income as if every unit is filled every single day. That never happens. Even in hot markets, you have turnover and vacancies. A realistic vacancy and credit loss rate is usually somewhere between 5-10%.
- "Forgotten" Expenses: Where are the property management fees? What about landscaping, snow removal, or pest control? These small, recurring costs nibble away at your profit and absolutely must be included in your operating expenses.
- Magically Low Utilities: If the seller is bragging about low utility costs, your response should be, "Great, show me the bills." Ask for the actual statements from the last 12-24 months. Don't just take their word for it.
Investor Beware: A pro forma that looks flawless is often the one hiding the most problems. You have to build your own financial model from scratch using verified, real-world numbers, not just the seller's optimistic projections.
Accounting for the Costs They Don't Mention
Beyond just checking the numbers you're given, you need to hunt for the costs the seller has zero incentive to bring up. These are the "gotchas" that can turn a great deal on paper into a money pit in reality.
Deferred Maintenance Time Bombs Take a hard look at the big-ticket items. Is that roof 15 years old? Is the HVAC system on its last legs? These are major capital expenditures (CapEx) just waiting to explode. While CapEx isn't technically part of the NOI formula, you are making a massive mistake if you don't budget for it. Ignoring a future $10,000 roof replacement is how you wipe out your cash flow for an entire year.
Verifying the Two Biggest Bills Two of the largest line items in your operating budget will almost always be property taxes and insurance. Never, ever assume the seller's current payments will be what you pay.
- Property Taxes: A sale almost always triggers a tax reassessment. The local government will re-evaluate the property's value based on what you just paid for it, which can cause your tax bill to jump significantly. Call the local assessor's office to get an estimate based on your purchase price.
- Insurance Premiums: Get your own quotes from an insurance broker. Rates change constantly based on your own profile, the property's specific risks, and even recent weather patterns in the region. What the seller paid last year is completely irrelevant to what you'll be quoted this year.
By stress-testing every number and independently verifying every major expense, you're protecting yourself from a bad investment. This level of diligence ensures the net operating income cap rate you use for your decision is based on reality, not a seller's fantasy.
Using NOI and Cap Rate in a Changing Market
Knowing the formula for net operating income and cap rate is just the start. The real skill is using these metrics to navigate the currents of a constantly shifting market—that’s where smart investors truly make their mark.
Markets are never still. Cap rates are always in flux, influenced by everything from interest rates and economic forecasts to the sheer volume of investor demand. This creates cycles of what we call compression and expansion.
The Cap Rate Seesaw: Compression vs. Expansion
Picture a seesaw. On one side, you have property values; on the other, you have cap rates.
When investor demand is roaring and money is cheap, buyers are willing to pay more for the exact same stream of income (NOI). This competition drives property values up, which in turn pushes cap rates down. This is called cap rate compression.
But when the Federal Reserve raises interest rates or the economic outlook gets cloudy, investors pull back. They get more cautious and demand a higher return to compensate for the added risk. This causes property values to level off or even dip, forcing cap rates to climb. We call this cap rate expansion.
Market Trends and Your Strategy
Keeping your finger on the pulse of these trends is absolutely critical. For example, after a long period of increases, some data suggests commercial real esate cap rates might be hitting a peak.
To give you a snapshot, in the fourth quarter of 2023, office properties were trading at the highest cap rates, averaging 6.54%. Meanwhile, the industrial and multifamily sectors were tighter, with cap rates around 5.2% and 5.3%, respectively. You can dig into more of this data on commercial property cap rates on Statista.com.
This kind of market demands a proactive, almost defensive, mindset. Don't just take the seller's pro forma at face value. Run your own sensitivity analysis. Ask the tough "what if" questions: "What happens to my cash flow if vacancy jumps by 5%?" or "How would a 10% dip in market rents hammer my NOI?"
This is how you stress-test a deal to see if it bends or breaks.
It moves your analysis from a single, static cap rate to a dynamic range of potential outcomes. This prepares you for reality, not just the best-case scenario presented in a marketing package. Getting comfortable with how to use a pro forma cap rate is essential for running these forward-looking numbers accurately. By modeling these potential shifts, you base your decision on a property’s resilience, not just on today’s rosy projections.
Answering Your Lingering Questions About NOI and Cap Rate
Even after you've got the formulas down, some questions tend to pop up when you start applying these concepts in the real world. Let's tackle some of the most common ones I hear from investors.
What's the Real Difference Between Cap Rate and Cash on Cash Return?
The short answer? Your mortgage.
Think of cap rate as the "pure" return on a property if you bought it with all cash. It completely ignores financing, which makes it a fantastic tool for comparing the raw profitability of one property against another. It levels the playing field.
Cash on Cash Return, on the other hand, is all about your specific deal. It measures the return you’re getting on the actual money you pulled out of your pocket (your down payment). Since the formula ([NOI - Debt Service] / Cash Invested) includes your mortgage payment, it's a personal metric, not a comparative one.
So, use Cap Rate to shop for the best asset, and use Cash on Cash Return to see how your financing structure impacts your personal profit.
Can a Property Actually Have a Negative NOI?
You bet it can, and it's a giant red flag. A property dips into negative Net Operating Income the moment its operating expenses climb higher than its income.
When you see a negative NOI, it means the property can't even pay its own basic bills (taxes, insurance, management, etc.) from the rent it collects. We're not even talking about the mortgage yet. This is a five-alarm fire, signaling that the property is bleeding cash just to keep the lights on.
Bottom Line: A negative NOI is the classic sign of a deeply troubled property. It tells you that something is fundamentally broken—either income is far too low (think massive vacancy) or expenses are out of control.
Why Aren't Big-Ticket Repairs (CapEx) Included in NOI?
This is a smart question because those big expenses are very real. Capital Expenditures (CapEx) are major, one-off projects like a new roof or a full HVAC replacement. We leave them out of the NOI calculation on purpose.
NOI is designed to measure a property's stable, predictable, year-to-year operating performance. Tossing a one-time $15,000 roof replacement into the mix would completely torpedo that year's NOI, making the property look like a terrible performer when it might just be having an off-year due to a necessary upgrade.
By excluding CapEx, we keep the NOI a clean, standardized metric for comparing the day-to-day operational efficiency of different properties. You absolutely need to budget for these big items separately, but they don't belong in the core NOI calculation.
Ready to ditch the spreadsheets and analyze deals like a pro? Property Scout 360 gives you instant ROI, cash-flow, and cap rate calculations for any residential property in the U.S. Find your next investment and evaluate it in minutes. Give Property Scout 360 a try.
About the Author
Related Articles
2026 Investor's Guide: Cost of Installing a Sewer Clean Out
Understand the cost of installing a sewer clean out for investment properties in 2026. Get expert advice on prices, ROI, & budgeting for flips. Plan smart!
15 Year vs 30 Year Mortgage: The Investor's Choice
Deciding between a 15 year vs 30 year mortgage for a rental property? Our guide analyzes cash flow, ROI, and equity to help you pick the best loan.
Real Estate Appraisal Software: Features & Limits
Discover what real estate appraisal software is, its core features, and limits. See how it differs from investment tools for profitable deals.